Missed opportunityA clear breakout occurred weeks back, but as we all know we are currently at the beginning of a bearish market or in the middle of it thus most traders or investors have been on the sidelines for the past couple of weeks and some bullish investors are on the sidelines. After the breakout, it was a clear sign of a buy.
XONA trade ideas

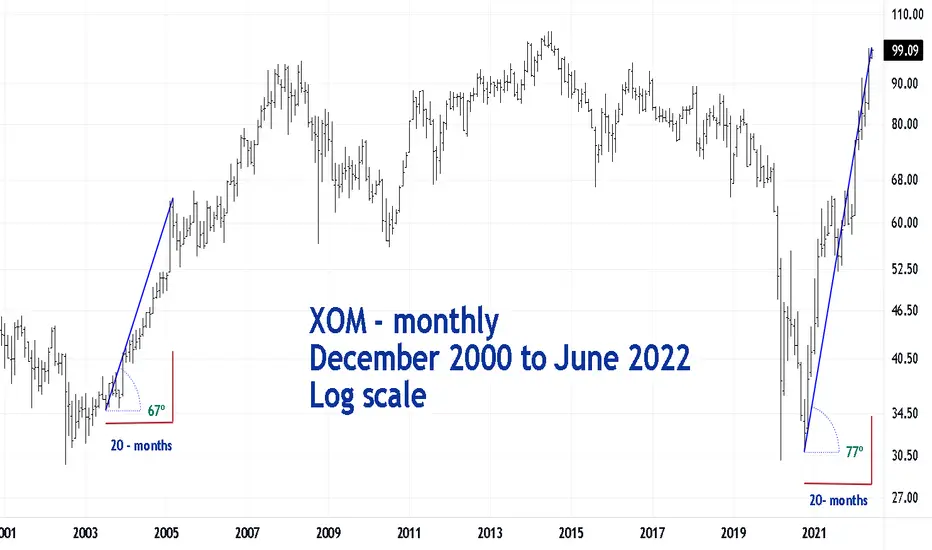
Exxon Mobile is Parabolic The price increase in Crude Oil and energy stocks since March 2020 could be the fastest in history.
Exxon Mobile (XOM) within the prior 20 - months has risen at an angle of 77%.
The most dynamic phase of XOM's 2002 to 2008 bull move occured from July 2003 to March of 2005, the angle was only 67%.
The current powerful advance implies the bull market could continue for at least several months.
XOM is nearing its all-time high of 104.61. If it can move above this top its possible XOM could within one year reach 150.00.
Fall and climbI expect to create a downtrend pattern in the lower time and then the break of the uptrend line and finally the uptrend and break the supply or resistance area.


$XOM RSI Optimizer Signal @KioseffTrading RSI Optimizer being used & is showing a long entry signal at best performing RSI Crossover.

Xom is moving upXom in now in an up trend, let's make sure we don't break 91.64, with the oil prices going up the results will be amazing

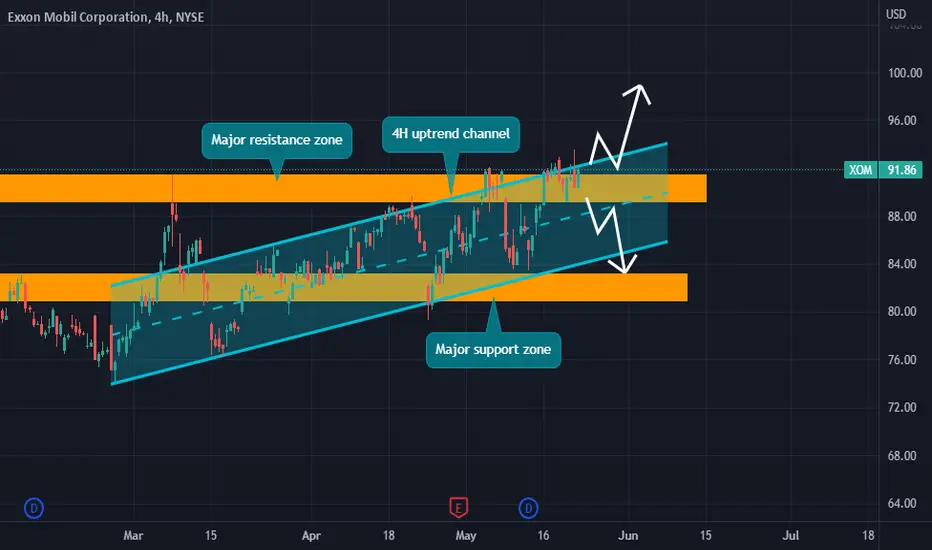
XOM possible tradesIf Im going to look for a buy I will wait for price to breakthrough both the major resistance zone and the 4H uptrend channel than make a retest before taking a long trade, and if Im looking for a short trade price might respect both the channel and major resistance and head low.
XOMBy breaking the price to the level of 87.30
It is likely that it will fall to one of the following levels, and the constant reading of energy prices, especially oil, must be taken into account
Here are the levels
77.25
68.62
61.55

higher low on smaller timeframes >.<XOM is so strong compared to the tech stocks right now! congrats to longs here :) lets see if it can bounce now, potential targets are 91.63-95.69-99.74

Exxon has more to give? Exxon Mobile
Short Term - We look to Buy at 81.80 (stop at 79.22)
Preferred trade is to buy on dips. The medium term bias remains bullish. Trading has been mixed and volatile. We are assessed to be in a corrective mode lower.
Our profit targets will be 87.06 and 89.10
Resistance: 90.00 / 100.00 / 110.00
Support: 82.00 / 75.00 / 70.00
Disclaimer – Saxo Bank Group. Please be reminded – you alone are responsible for your trading – both gains and losses. There is a very high degree of risk involved in trading. The technical analysis, like any and all indicators, strategies, columns, articles and other features accessible on/though this site (including those from Signal Centre) are for informational purposes only and should not be construed as investment advice by you. Such technical analysis are believed to be obtained from sources believed to be reliable, but not warrant their respective completeness or accuracy, or warrant any results from the use of the information. Your use of the technical analysis, as would also your use of any and all mentioned indicators, strategies, columns, articles and all other features, is entirely at your own risk and it is your sole responsibility to evaluate the accuracy, completeness and usefulness (including suitability) of the information. You should assess the risk of any trade with your financial adviser and make your own independent decision(s) regarding any tradable products which may be the subject matter of the technical analysis or any of the said indicators, strategies, columns, articles and all other features.
Please also be reminded that if despite the above, any of the said technical analysis (or any of the said indicators, strategies, columns, articles and other features accessible on/through this site) is found to be advisory or a recommendation; and not merely informational in nature, the same is in any event provided with the intention of being for general circulation and availability only. As such it is not intended to and does not form part of any offer or recommendation directed at you specifically, or have any regard to the investment objectives, financial situation or needs of yourself or any other specific person. Before committing to a trade or investment therefore, please seek advice from a financial or other professional adviser regarding the suitability of the product for you and (where available) read the relevant product offer/description documents, including the risk disclosures. If you do not wish to seek such financial advice, please still exercise your mind and consider carefully whether the product is suitable for you because you alone remain responsible for your trading – both gains and losses.


$XOM with a Neutral outlook following its earnings #Stocks The PEAD projected a Neutral outlook for $XOM after a Positive over reaction following its earnings release placing the stock in drift B with an expected accuracy of 33.33%.
HigherPrice is in a medium term uptrend channel after having broken long term downtrend to the upside ! I would expect price to go back to the 105 area before year end ! Just my thoughts :)

jill - only sell if XOM above the green linedollar is correlated with oil, and oil stonks are collated with oil price. So dollar (DXY) is strong at the moment, so oil stonks are way up. I'd prolly just sell this only as long as its above the green line

XOM Rising Wedge + HTF 68% FIB LevelXOM is consolidating within this rising wedge that is also in confluence with the HTF 68% FIB level as a larger pullback. If price breaks down from this wedge over the next two days, you could see a large move to the downside. Can day trade part of the move or swing the entire move.
STEPS FOR ENTRY:
- First confirm trend change by watching for price action to cease making higher highs and double topping at 85.54 OR making a lower higher
- Next wait for breakdown from wedge and break below 84.35 level to enter into puts. (Beware of pullback/retest of level before entering and use other confluence factors to give more confirmation such as volume, macd, rsi, smaller ma crossings, etc)
- When entering drop to LTF on the 5min chart for a more precise entry. (Written on chart)
- Once you have entered, look to take partial profits at 82.12 then full profits close to 79.29
***** Additional confluence - Price is rejecting at the 200MA on the 30min TF and Death cross formation on the 1hr TF (50ma falling below the 200ma)

XOM Rising Wedge + HTF 68% FIB LevelXOM is consolidating within this rising wedge that is also in confluence with the HTF 68% FIB level as a larger pullback. If price breaks down from this wedge over the next two days, you could see a large move to the downside. Can day trade part of the move or swing the entire move.
STEPS FOR ENTRY:
- First confirm trend change by watching for price action to cease making higher highs and double topping at 85.54 OR making a lower higher
- Next wait for breakdown from wedge and break below 84.35 level to enter into puts. (Beware of pullback/retest of level before entering)
- When entering drop to LTF on the 5min chart for a more precise entry. (Written on chart)
- Once you have entered, look to take partial profits at 82.12 then full profits close to 79.29
***** Additional confluence - Price is rejecting at the 200MA on the 30min TF and Death cross formation on the 1hr TF (50ma falling below the 200ma)

Breakout the uptrend with gap Expected to go down to (target1=75.23; target2=70.88) after breaking the UPTREND(The price may retest the trend and then fall towards the target)
XOM new all time highs or just a repeat of 2014 price action?History is repeating itself like it did in 2014. We are guaranteed of $105 price action because of Biden embargo on Russian oil like in 2014, but now my question is, do we supersede this $105 all time high because of running inflation and War/Embargo? The trifecta can potentially can push AMERICAN oil companies to new ATH's making 2014 not look as bad as it once was.

How To Be ContrarianMy goal is to try to make traders and investor THINK DIFFERENTLY about markets. I believe as humans we seek validation, comfort in affirming our beliefs, and that manifests in the wild swings of the market when the narrative is proven wrong. Back in January 2021 I made an uncomfortable bet on Exxon NYSE:XOM . It was uncomfortable at the time because the narrative was that "dirty energy" was dead, oil was going down to $12/barrel, and EV was the future. These may very well all be true... but it was early. And in investing; being early and being wrong are often indistinguishable. At the time, Exxon was trading below book value (market cap < assets-liabilities on balance sheet), it offered a 7% dividend yield which they did not cut, and had just hit a double bottom. It was NOT obvious at the time... only in hindsight. But these are the types of contrarian trades that investors MUST look at to achieve outsized gains.

XOM to test the highsXOM has a high probability to test its recent highs. I feel the May 20, 2022 87.5 calls seem cheap, 20% and I'm booking half and letting the rest ride. I am no pro but typically summer months cause oil to rise anyways. We shall see!

🤖 XOM headed to new highs? XOM breaking past local trend resistance, but still below a extreme resistance zone. Risky place to take a long in my opinion.
if trend break holds we can target 91.44-new all time high
a break below can send it to 85.06-83.01

XOM BUY BUY BUY Hey everyone!
This one here is a great buy buy the pull backs and hold until 2023 and thank me then.
All my indicators show strong strong buy!
This is where everyone one should invest in not gold OIL we use so much of it daily. And cost have gone down in the past years where gonna see it take over OIL industry is back and stronger then ever.

XOM - Re-Testing the L-MLHXOM is super strong.
I use my favorite tool, the pitchfork, to apply projections of price, filtering, find entries, exits etc.
What many pitchfork traders don't understand is, that they can't just apply this tool to the chart. I see many doing it wrong anyways, which has to do with identifying the correct pivot/swing/pendulum swing points, and not being aware of the rules.
However, using the rules is equally important. Because the rules define the framing around this tool. Otherwise it's worth nothing, or even harmful to the trader.
One of the rules says, that if price is trading outside the pitchfork, it often is going to test/re-test the line where it fell/zoomed out of.
In this case it's the L-MLH, the Lower-Medianline-Parallel. As we see, the first test was just a couple days ago. Now, it looks like XOM is re-testing the L-MLH again.
What happens after the re-test?
a) price is either strong enough to trade back into the projected pitchfork again, recapturing the previous slope/path of price.
or
b) price will trade to the next WL (Warning Line), going south or eating up time by trading sideways.
As a firm believer in the rules of the pitchfork, I'm long this stock, playing for a re-test at the L-MLH.
