Same Story 2 different explanation!It does not matter if you look at it as a head and shoulder or a quadratic regression (function)!
The most important thing is that it is moving toward 30K once again..!
You can see the most important support(green line) and resistance (red line) levels.
Best,
Moshkelgosha
DISCLAIMER
I’m not a certified financial planner/advisor, a certified financial analyst, an economist, a CPA, an accountant, or a lawyer. I’m not a finance professional through formal education. The contents on this site are for informational purposes only and do not constitute financial, accounting, or legal advice. I can’t promise that the information shared on my posts is appropriate for you or anyone else. By using this site, you agree to hold me harmless from any ramifications, financial or otherwise, that occur to you as a result of acting on information found on this site.
BXBT trade ideas

BTC Bottom In?Monthly bottom trendline hit and 20 EMA and fib retracement all merge approximately the same place $37,000. Looks like a great spot to buy the bounce.

BTC update (more in comments)There is a minor short term descending wedge within a major multi-month wedge. One break should lead into the other. I would assume a break (up OR down) soon as the wedge looks pretty cooked!

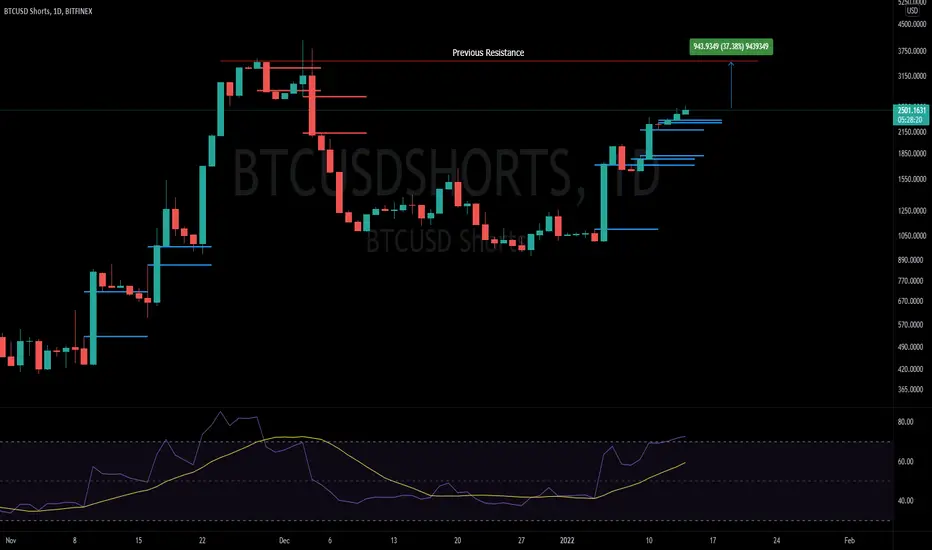
#Bitcoin Technical Analysis 3/3 #BTCUSDSHORTS
are pushing up been at 37.38% from previous Resistance
Conclusion: What Bitcoiners want is to see DXY Drop below actual support level at 94.70 to become resistance in the near future
Remember if DXY goes up BTC is going down and vice versa
My personal opinion is that we're going further down to the mids 30K or even further to find support at green box #3 at 30K
(CHECK CHART #1/3)
I Believe that at the end of Q1 price will initiate a recovery in price reaching previous ATH in Q3
NFA
PLEASE, DYOR/MYOD!!
Hope to See your Likes 👍 to Support My Work
To Follow All My Ideas, Go to My Profile and Select the Follow Green button 😁
Please Re-Examine Before Make Your Last Decisions
Short TheKing ?
- ADX was always a strong indicator about Trends movements and strength, so read carefully the graph, this is a 2 Week view, in comments i will post 1 Month view.
- Just Check ADX Overbought Zone and you will understand, for now, i can tell you that 82% of retailers are shorting TheKing and believe it will crash.
- That said i can tell you that 86% of institutional investors and assets managers are Long on BTC.
- So what i want to explain clearly is :
- Whales are just waiting for a big dip to buy your Bitcoins, they always cumulate BTC, they move them out from exchanges and keep in their wallets. no matter if BTC falls to 1000$, they will buy more.
- TheKing is still Alive because Whales never dropped their BTC, they dropped a bit for living, but this new nerd generation understood about the meaning of freedom in the "Satoshi Whitepaper".
- Most of the Whales are not driving a Lambo but drive a small car, they fly coach, they visit the planet, and they go supermarket like you and me.
- Retailers try to win money in the Both Ways because they are just greedy, Long and Short BTC, the problem is when you Short BTC you don't have your coins... you have your "Short Contract" (x2 at least).
- When you are shorting a disinflation technology, it means you are fighting with something made for a best future, less poverty, more equitability, better world for your family.
- When you are shorting BTC you are taking the risk that the exchange you are using close or get a hack, you cannot move a contract in an hardcore Wallet, but if you buy BTC, you can move coins in your Ledger.
- When you are shorting BTC, you own nothing. Not your coins. Not your Key. just the wind.
- i hope this makes some people's open eyes about a greedy financial system.
- Believe in TheKing!
Happy Tr4ding !

Longs vs. Shorts, Important support level soon, will it hold?I've been studying Long/Short for guidance on where (or if) Bitcoin will rebound.
The following is my opinion based on what I perceive. I welcome contrary, corrective and constructive points of view. None of this is financial advice.
At this time there is an obvious bias towards the shorts. We should have confirmation as soon as Jan 11.
In summer 2021 when we turned our bias more towards short positions, long positions declined as sentiment pivoted that direction. Interestingly, there was not an immediate shift towards short positions as the market attempted to determine which direction the market was headed. The bottom was accented by a spike in short positions.
This past summer we broke through an upper support level, touched the bottom upward trendline and bounced back up. If we do not do so here, then likely we will see a further capitulation.

We may see BTC visiting moving average at 45000 $We may see BTC visiting moving average at 45000
BTC may test 45,000 $46,000 areas in the coming period


Where is Bitbitcoin today?There are a lot of predictions about bitcoin's movements on the Internet, mostly bullish.There are based on so-called fundamentals, on so-called charts, and on data.I am a loyal chart analyst who follows the following principles: 1. Chart contains everything, 2. History will be repeated.
First, let's look at the daily line trend, here is a macd divergence, but in front of the macd gold fork, we can not confirm that the divergence must be successful.And now after falling below ma144, the market has entered a standard downward rebound cycle, even if divergence, it is not confirmed that this is the bottom.We're just looking at the rally, and we have to see if we can break through the ma144.
Second, when we look at the weekly line, many people will compare the current position with the adjustment made earlier last year, namely b and c. The trend of these two positions is similar, so many people think that it is the end of the adjustment.But I would like to suggest that there are a lot of similar trends, and in early 2018, or a, so here is the bottom logic, there is no inevitability.At the same time, if we compare the two positions of A and B, we also have a very high similarity.For example, it was also a record high at that time, the macd high dead fork, and now it is more exaggerated, the weekly macd is divergence, theoretically adjusted for a longer cycle.The goal of the weekly line adjustment should theoretically be ma144, which is the yellow line in Fig.
Third, let's look at the monthly line. If you call up the bitstamp chart (this is the most complete K-line chart I have found in the existing exchange), you can clearly see the upward trend of the 5 waves. According to the wave theory, the next step should be the downward trend of the abc.While this seems exaggerated, you see the monthly macd already facing a death crossing, and from the macd adjustment cycle, at least 6 months, so getting out of the abc may not be without.
Above is what I concluded from the chart, but any prediction is wrong, and the prediction is just a reference for our transactions.When it comes to trading, there should be a quantifiable strategy. What I have long used has been the macd + ma18 strategy, which is not the sharpest offensive weapon, but he is indeed the best balanced and the most stable strategy.
In addition, for the current position, in the end is the middle of the bull market, or the beginning of the bear market, there are some reference conditions.For example, new all-time highs appear, of course, can abandon the bear market view.Or that the weekly macd forms a gold cross.But these references may be more lagging, so for the specific operation, macd + ma18 may be more appropriate.Any strategy, there will also be the possibility of success and failure, so the strategy fails, you also have to strictly implement the stop loss, this is the qualified trade.

A possible forecast for the next 8 months!This is a weekly chart, I usually use weekly charts for the long-term forecasts!
My approach may seem very odd at the very first glance, but if you are looking at the symmetric pattern of exponential upward and downward moves, it becomes clear that this approach could explain the possible price pattern in the chart much better!
As you see pattern 1 is completed and pattern 2 will be finished in 6-8 weeks!
Pattern 3 is pure speculative which must be considered after pattern 2, however, there is always a chance deviation in the forecasts!
If you are trading bitcoin this chart may help you make better trades in the direction of the most probable longer-term pattern!
If you like this chart, you can make this set-up yours by pressing the three dots below the chart, and then save the chart layout for yourself!
I will update this chart as needed!
* In a short time frame we always have some positive days between negative days!
Best,
Moshkelgosha
DISCLAIMER
I’m not a certified financial planner/advisor, a certified financial analyst, an economist, a CPA, an accountant, or a lawyer. I’m not a finance professional through formal education. The contents on this site are for informational purposes only and do not constitute financial, accounting, or legal advice. I can’t promise that the information shared on my posts is appropriate for you or anyone else. By using this site, you agree to hold me harmless from any ramifications, financial or otherwise, that occur to you as a result of acting on information found on this site.

Room for more Downside, Up is still trendIt appears btc is going to continue falling atleast 20%. However, not to fear bitcoin is still on track to hit 100k by year end.
I recommend buying bitcoin at around 35K.

The last chance to change the trend in the next 24 hours This analysis is based on Elliott's Multi-timeframe wave count in three times daily, 4 hours and 1 hour, and I hope this will happen.

Leverage Manipulation on BitcoinCool story bro's about "whale manipulation" are common. Here is some evidence.
The "Liquidation Spike" of December 3rd started with the 8:30am US Jobs Report. The move triggered a cascade of stops and liquidations across the cryptocurrency market. In the days prior there was a dramatic increase in leveraged short positions being opened. On Bitfinex the leveraged shorts increase by 275% over 7 days. When the move down happened these short positions closed into profit from where they were taken.
Gravity seemed to pull price down the retest the low. Now on this move to breach the Liquidation Low there is another noted increase in short positions likely trying to force out stops and leverage longs. The battle ensues! My thesis remains that cryptocurrency has entered the bear phase of its cycle.

The next 3 days..!Happy new year everyone, and Thanks for following me in 2021.
The current Bitcoin price pattern is very similar to the price pattern during the correction between April-June 2021.
In both cases, we see a sideway after a sharp drop.
I think there is a good chance we see price action to 45.5 K in the next 1-5 days and then a 10-15% increase in the price up to 52K.
This analysis will be updated in the next few days!
Do not rush to open a long position! wait for a proper reversal pattern!
Wish you a year full of success and prosperity!
Best,
Moshkelgosha
DISCLAIMER
I’m not a certified financial planner/advisor, a certified financial analyst, an economist, a CPA, an accountant, or a lawyer. I’m not a finance professional through formal education. The contents on this site are for informational purposes only and do not constitute financial, accounting, or legal advice. I can’t promise that the information shared on my posts is appropriate for you or anyone else. By using this site, you agree to hold me harmless from any ramifications, financial or otherwise, that occur to you as a result of acting on information found on this site.


BTCUSD rebound..Don't forget to click on the follow button and ask any questions should you have them!
Here we have our BTCUSD chart.
One of the more stable cryptocurrencies available to trade is BTC. Yesterday, we saw a rapid fall on poor news sentiment.
Remember we are very careful with our risk management because assets like this can be volatile. It is essential that your position sizes are correct in order to protect yourself from these times.
As well as this your trading method Must be accurate to ensure you are buying and selling at the correct time and in the correct places. The mixture of these aspects creates the core for an accurate trading plan you can go to the markets with everyday and make profit from.
On our current BTC chart we are still looking long. Our targets were hit BEFORE yesterday's fall, but on the rise we are looking long again. It is important that you understand buying low and selling high leads to profitable trading. This is the only way...

Short Term BTC countThis is a potential wave count for BTC. A break out of the macro wedge with an impulse wave. This wave has now retraced to the .768 fibonacci.


We may see a correction in Bates in the $48000 areaWe may see a correction in Bates in the $48000 area
Then we may go to new areas after the correction and break $53,000

COMPARISON OF XBT, SLV AND GLDThis comparison was made to see and determine which has been more effective to fight inflation.

After a great fall and come with a great hikeHave been following and even trade with bitcoin in 2021. And this is really a great experience.
It is more than just stock or forex which you have no idea why it is going up and why it is going down when it move.
You will be spoon feed with news later.
So call "Buy on rumors and sell at news, wise versa" this is true.
However, rumors are really named as rumors for certain reason.
Ending the 2021 with a giant up trend channel which is usual for bitcoin. Noting is small gain in this world which we have to take it or leave it.
Learning to hold or stake stable coins is my next move and already doing that with terra network under the Anchor platform.
Just message me for URL if you are interested.
However, this market remain hot and interesting due to a lot of young active energetic moneys are involved. You can check up the tik tok to prove me wrong.
Merry Christmas and Happy 2022.
Covid with the Omicron had sunk the markets for a bit however, once the report is optimistic, bitcoin take no waiting and recover. This is really scary. No body able to predict with the graph.
It suppose to take a rest at 40k isnt it, however, it does not happen. -It do behave like these, it know what all think and react the other way. Playing cat and mouse game.
Regard
silver.

BTCUSD Corrective patterns A B CAlready I have mention all things by technical analysis on the another hands if descending line breakout then we will see again bitcoin all time high.
