Extremely Low Shorts To Longs RatioThis is insane, 3.26% of Open interest in Bitfinex exchange are shorting bitcoin right now. This is extremely low as you know it is a ratio. It can not go below zero it can just be near zero. This is -in my opinion; an indication of extreme optimisim and will probably result in a powerful long squeez. To get this chart use this formula:
BITFINEX:BTCUSDSHORTS/(BITFINEX:BTCUSDSHORTS+BITFINEX:BTCUSDLONGS)*100
BXBT trade ideas

Buy wave 5 of Elliott wave indicator is sick 😲😲😲Go straight up to ext 5 target and ichimoku target, I think we will have correction soon in this zone because degree and target.
We can wait for correction and next massive wave 5 bigger, look this behavior, confident to hold

BTC:USD LONGSLast time we saw price action and longs like this was the rally after the covid crash. After a cool off, bitcoin continued to trade wayyy higher. I think that is something similar to what we will see here, unless BTC break ath. I truly dont know how it will play out

BTC 2021 IdeaSharing my idea for BTC for the next few months. Copying a fractal from earlier this year.

Tweezers Top, correction is possible!A tweezers topping pattern occurs when the highs of two candlesticks occur at almost exactly the same level following an advance.
A tweezers bottom occurs when two candles, back to back, occur with very similar lows.
Like many other candlestick patterns, tweezers occur quite frequently.
Tweezers are more meaningful as part of other trends, especially pullbacks.
There are additional criteria. The first candle should have a large real body (the difference between open and close). However, the second candle can be pretty much any size. Therefore, the two candles may look quite different. For example, in a tweezers top, the first candlestick may be a strong-up candle, closing near the high. On the other hand, the second candle may be a Doji—a cross-shaped, neutral candlestick pattern—that doesn't close near the high but still has a similar high to the first candle.
reference Article:
www.investopedia.com


The Mother of all Algorithmic TradingIf I had any doubt that the whole cryptocurrency market is ruled by an algorithmic superpower, I don't have any anymore..!
Check this article published on Jul 22, 2021
This show will become interesting after October 25th, 2021..!
Best,
Moshkelgosha


You know what happens nextRug shall be pulled.
All the bears capitulated but I ain't f*ing capitulating.
-Last Bear Standing

BTC's Possible Double-TOP ⚠️ 🐻 ⚠️Hi everyone 👋🏽
🕊 Wish y'all have a profitable lifestyle 🍀
📌 BITCOIN /USDT H:4 Chart - Heiken-ashi
📌 PRICE ACTION - Fibbo - Double-Top
📍 Bitcoin may create a double-top after filling the first target of bullish-flag
✍🏼 Straight to the point, Bitcoin may create a possible double-top in H:4 and daily time-frame which can lead the price again to the 44-45k zone
✍🏼 After the vast internet shutdown and failure of centralized plat-forms such as Facebook , WhatsApp and Instagram; Bitcoin and other crypto currencies pumped big in just less than a day.
⚠️ However, from technical-analysis point of view I am just concerned about a double top at 53k price zone.
✍🏼 If the scenario 1 fails, of course BTC is going to see the 57-58k price zone more easily than everyone thinks.
⚠️ RSI in H:4 looks so much in overbought position; more than 80-85 RSI is such a dangerous zone.
LINK OF MY BULLISH-FLAG TA IS AVAILABLE BELOW, PLEASE CHECK IT OUT
THIS IS NOT A FINANCIAL ADVICE, IT IS JUST MY OPINION

BTC Long IdeaI see bitcoin had a BMS and now is completing it's pullback to the broken area
you can have this big RR (1:32) Buy limit with a small size of your account.
Risk 0.5% of balance

Weakest Bulls ever..!In the past five months, Bitcoin gained 93%. However, if you compare the past five months with the previous bullish rallies, it will become obvious this last rally could not be the same as the previous ones.
I believe the last rally could be compared with Dec 2018 - July 2019 period and will be followed by another decline in the price!
Dec 2018 - July 201:
The last 5 months:
based on this comparison I believe a reversal is a more likely scenario..!
Moshkelgosha
DISCLAIMER
I’m not a certified financial planner/advisor nor a certified financial analyst nor an economist nor a CPA nor an accountant nor a lawyer. I’m not a finance professional through formal education. The contents on this site are for informational purposes only and do not constitute financial, accounting, or legal advice. I can’t promise that the information shared on my posts is appropriate for you or anyone else. By using this site, you agree to hold me harmless from any ramifications, financial or otherwise, that occur to you as a result of acting on information found on this site.

Elon Musk vs Satoshi NakamotoWho Is Satoshi Nakamoto?
Satoshi Nakamoto is the anonymous name used by the creators of the Bitcoin cryptocurrency.
Although the name Satoshi Nakamoto is often synonymous with Bitcoin, the actual person that the name represents has never been found, leading many people to believe that it is a pseudonym for a person with a different identity or a group of people.
History of Satoshi Nakamoto
The persona Satoshi Nakamoto was involved in the early days of Bitcoin, working on the first version of the software in 2009. Communication to and from Nakamoto was conducted electronically, and the lack of personal and background details meant that it was impossible to find out the actual identity behind the name.
Nakamoto’s involvement with Bitcoin, however, ended in 2010. The last correspondence anyone had with Nakamoto was in an email to another crypto developer saying that they had "moved on to other things." (Investopedia)
Nov. 27, 2017: Elon Musk denies a theory he is Satoshi Nakamoto, the pseudonymous creator of bitcoin, tweeting here, "Not true. A friend sent me part of a BTC a few years, but I don't know where it is."
In 2004, Elon Musk joined electric vehicle manufacturer Tesla Motors, Inc. (now Tesla, Inc.) as chairman and product architect, becoming its CEO in 2008.
Kimbal Musk the younger brother of Elon Musk:
Kimbal Historic trade: Kimbal Musk (Elon's Brother) sold 30k Tesla shares at 856 dollars in February 2021
Elon Musk Charged With Securities Fraud for Misleading Tweets
FOR IMMEDIATE RELEASE
2018-219
Washington D.C., Sept. 27, 2018 —
The Securities and Exchange Commission today charged Elon Musk, CEO and Chairman of Silicon Valley-based Tesla Inc., with securities fraud for a series of false and misleading tweets about a potential transaction to take Tesla private.
On August 7, 2018, Musk tweeted to his 22 million Twitter followers that he could take Tesla, private, at $420 per share (a substantial premium to its trading price at the time), that funding for the transaction had been secured, and that the only remaining uncertainty was a shareholder vote. The SEC’s complaint alleges that, in truth, Musk had not discussed specific deal terms with any potential financing partners, and he allegedly knew that the potential transaction was uncertain and subject to numerous contingencies. According to the SEC’s complaint, Musk’s tweets caused Tesla’s stock price to jump by over six percent on August 7, and led to significant market disruption.
www.sec.gov
Comparing Tesla and Bitcoin market cap of 775 Billion and 1 Trillion dollars will show us Elon Musk and Satoshi Nakamoto have had the same achievements in the past decade..!
Comparing the price pattern of bitcoin and tesla in the past 20 months shows an undeniable positive correlation of the 2 ..!

Alternative View on BTCEvery time this year that we’ve touched the 60-65 range for Bitfinex BTC Longs / Bitfinex BTC shorts we’ve dumped hard. Will this play out again? Shorts are dropping fast and down 20% today, if this continues we could hit 60 within the next week or so, be careful!

Cup and handle BTC If bitcoin breaks 53k it will skyrocket. dont know for sure i am trading for 2 months so i am a noob. i beleieve this is possible

Time to rest ! BTCUSD 1h Elliott wave countOn 1h chart we completed 5 wave and 5 wave of wave 5 at resistance, now maybe market will retrace base on retrace we can expecting can we have more big wave on higher timeframe and degree

BTCUSD another rally !? Elliott wave count Analysis D 1h chartAfter 5 wave impulse we have a abc correction, and we found some strength at wave 4
Look like btc will re test 47800 area if we break above it maybe we will have more momentum to the upside
Let zoom in to 1h chart to see what happened today
On 1h chart our indicator had a count, maybe we will have some correction, and heading to 47800

An illusion of Decentralized FinanceAn illusion is a distortion of the senses, which can reveal how the human brain normally organizes and interprets sensory stimulation. Although illusions distort our perception of reality, they are generally shared by most people.
look at charts, near 100% correlation in the price pattern of Bitcoin, Etheruem, Ripple, and Solana could not be accidental nor sign of being decentralized! The center is not just the Central banks..!
While people encourage others to invest in cryptocurrencies because they are not governed by central banks which print money out of thin air, they print money out of bits using blockchain technology!
There are 180 current currencies across the world, as recognized by the United Nations, and more than 6000 (thousand) cryptocurrency projects in the world!
You do the math, and tell me what is going to happen in the next 5-10 years!
Today, Fed Chair Powell and Treasury Sec. Yellen testified in front of the oversight committee.
In this meeting Fed Chair Powell said:
The federal reserve has no plan to ban cryptocurrency like China, however, they are thinking about regulations and also planing for the central bank and governer-backed currency..!
Now you may have a better clue to see what is coming in the future years!
Moshkelgosha

No trend in the past 8 days..!A complex correction and no more!
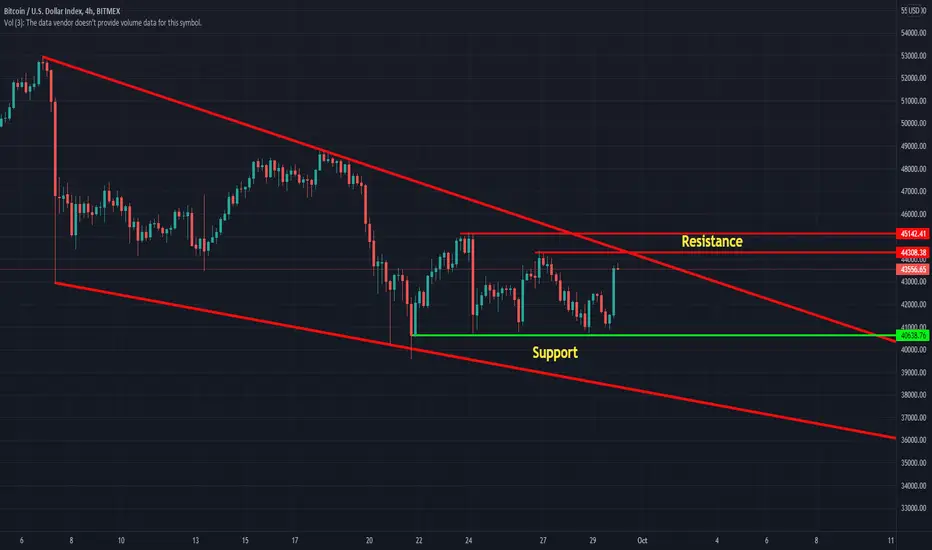
Bitcoin price has made a falling wedge and in the past 8 days tested 40.7 K 5 times!
the most important resistance level is 44.5K-45k.
Pure neutral, and we should wait for another emerging trend!
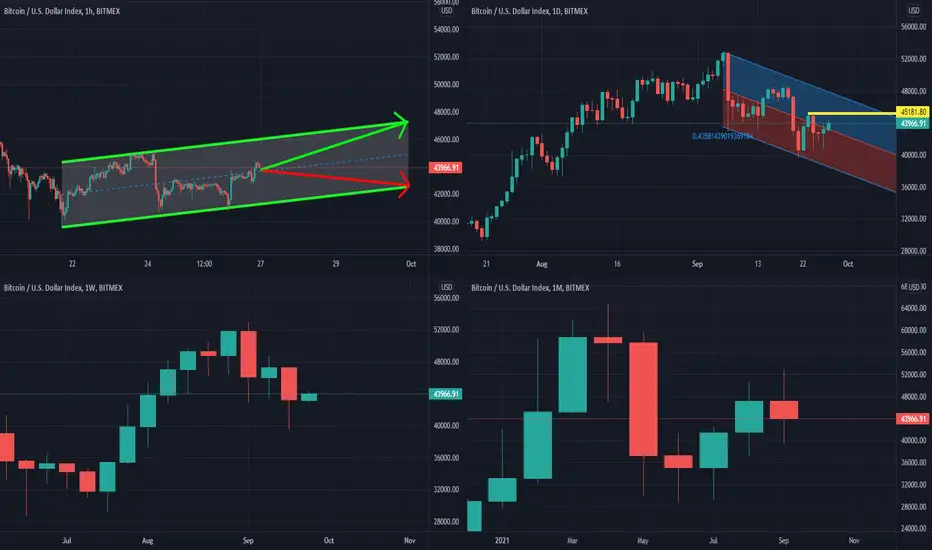
There will be a complex correction..!Multi-Timeframe Analysis:
Hourly Chart: Bearish Flag (Neutral)-(Bearish)
Daily Chart: At the middle of a Downward regression channel (Neutral)-(Bearish)
Weekly Chart: after 7 bullish week we see sellers overwhelmed buyers in the past 4 weeks!
Monthly Chart: spinning Doji (Neutral)
Conclusion: This week will be a Neutral
BTCUSD 1h Elliott wave analysisWe still in range of impulse down and test high of wave 4 and found strong seller in here, so if we don't have any strength, I think btc will break the low 41000 and 39000 to continue bearish soon

Bitcoin 4 Hour - Sell
- Market currently going through corrective move/Bearish flag
- Price in downward channel

Pump friday to saturday/sunday?hello,
Fud on Fud, makes me think we might have bottomed, whats your guess?,
We gonna try to test lows next week after this pump?
thanks
