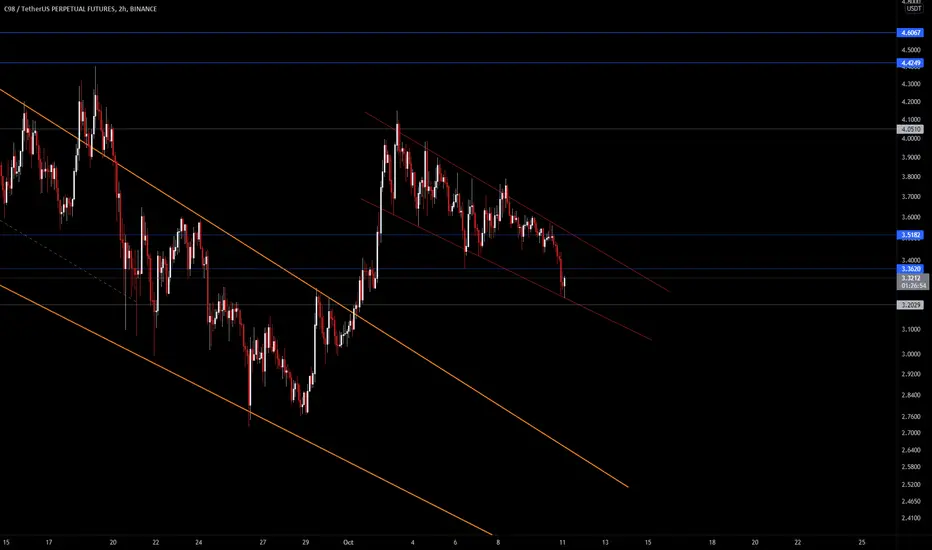
🔥 C98 Bullish Move AheadC98 recently retested the top resistance of the bearish channel, and most likely confirmed support. This means that there's a big possibility for C98 to see more bullish price action in the near future.
First target for me would be the last local top around $4. Second target at $4.40. Let's hope for some nice price action of this token.
Happy trading!
C98USDT.PS trade ideas

C98 Long term trend line rejection - H/S pattern formed and rejecting base.
Entry - retest of Daily 21EMA.
TP1- Top of last shoulder.
TP2 - Highest Daily Close on Head.
SL - Base low on first leg up on 2nd shoulder.

C98USDT breakout C98 beautifully held 0.382 support and about to breakout of descending triangle. Long case is mentioned in the chart. you can long/short from support/resistance in shorter time frame. I love to do in 15 mins chart.
Disclaimer: Not a financial advise. This is purely for educational purposes. Good luck and Happy trading!

C98 bull flag-- bottom touchThere's an opportunity to buy the bottom of this bullflag.
entry: buy: ~3.25
SL: 3.15 (~3%) if scalping, adjust if buying for hodl
C98USDT 4H: Possible LONGC98USDT 4H: Possible LONG
A rebound from the 3.300 level and a possible subsequent rise to the 4.200 level

C98 - Two Possible Bullish Scenarios!Hello everyone, if you like the idea, do not forget to support with a like and follow.
C98 is overall bullish and now retesting a demand zone in green so we will be looking for buy setups on lower timeframes.
First Scenario: (purple projection)
on H4: C98 formed a valid inverse head and shoulders pattern but it is not ready to go yet. Before we buy, we want the buyers to take control again by breaking above the gray neckline.
Second Scenario: (gray projection)
on H4: C98 is trading inside our red channel so if it keeps trading lower, then we will be waiting for a new swing high to form around the upper trendline to consider it our last swing high then buy on its break upward.
Meanwhile, until the buy is activated , C98 would be overall bearish can still trade lower.
Good luck!
All Strategies Are Good; If Managed Properly!
~Rich

C98USDT / LONGBasically and also the main distribution base for investors who fall into emotional turmoil during working with the digital field.
1. They've seen accounts and happy, never-before-seen numbers.
2. They always think that when the account goes up and the profit is big, why not just sell it and then reduce it more?
3. They often ask the school why there is such a change?

C98/USDT 4HOUR UPDATE Welcome to this quick c98/usdt analysis.
I have tried my best to bring the best possible outcome me in this chart.
Reason of trade :- c98 is look flag pattern and bullish single
Entry:- 3.64, 3.78,
Traget:- 20% to 30%
Stoploss:- 3.41,
Remember:-This is not a piece of financial advice. All investment made by me is under my own risk and I am held responsible for my own profit and losses. So, do your own research before investing in this trade.
Happy trading.
Sorry for my english it is not my native languages.
Do hit the like button if you like it and share your charts in the comments section.
Thank you...


C98 Retracement doneIf you consider newly released token in a crypto market C98 was the most profitable.After making a proper correction this will be the time to continue second wave

C98USDT Daily TimeframeSNIPER STRATEGY (new version)
It works ALMOST ON ANY CHART.
It produces Weak, Medium and Strong signals based on consisting elements.
NOT ALL TARGETS CAN BE ACHIEVED, let's make that clear.
TARGETS OR ENTRY PRICES ARE STRONG SUPPORT AND RESISTANCE LEVELS SO THEY CAN ACT LIKE PIVOT POINTS AND REVERSE THE WAVE (or act like a mirror that can reflects light) BASED ON STRENGTH OF THAT LEVEL.
ENTRY PRICE BLACK COLOR
MOST PROBABLE SCENARIOS TARGETS GREEN COLOR
LEAST PROBABLE SCENARIOS TARGETS RED COLOR
DO NOT USE THIS STROTEGY FOR LEVERAGED TRADING.
It will not give you the whole wave like any other strategy out there but it will give you a huge part of the wave.
The BEST TIMEFRAMES for this strategy are Daily, Weekly and Monthly however it can work on any timeframe.
Consider those points and you will have a huge advantage in the market.
There is a lot more about this strategy.
It can predict possible target and also give you almost exact buy or sell time on the spot.
I am developing it even more so stay tuned and start to follow me for more signals and forecasts.
START BELIEVING AND GOOD LUCK
HADIMOZAYAN

C98.Usdt (Y21.P6.E1).Potential inverted H&SHi Traders,
Looking at the BTC dominance, link video below.
If all things fall into place, we can have a big move for this coin.
C98 could be looking like re-accumulation with an inverted H&S structure.
I would trade this based on each formation on the micro level and then look at the bigger picture
For now, I'm just stalking the 4 and 8 hrly via the RSI and other indicators
All the best,
S.SAri
BTC.Dom

C98USDT - LONG SETUPC98USDT since its bullish breakout above the descending corrective trendline, the market has now provided us with a correction to the 0.50 fib in confluence with this previous resistance turned support, i am soon expecting to see the continuation to the upside. Waiting for a 4hr higher high to break above the resistance before looking for a entry to long

C98/USDT. LONG✔️C98/USDT has been on a downtrend, expecting a bounce from the nearest support or order block..

C98 institutional level CUP & Handle pattern. LONG
Target 4.95-5.10
great opportunity
Buy with DYOR
thank you

C98 is at falling wedge. Might go up!Not a financialy advise by any means! This is an analisys for myself. Please comment on what i did wrong or not. I would be thankful for any critics.
C98 is at falling wedge on 1d chart. According to elliot waves c98 wants to break out of the wedge and probably go higher at fast pace as it did earlier this summer. It might even go to 16$ after breaking ATH (lets hope). Strong fundamentals allows that.
RSI tends to be broken and as you can see volume decreases and shrinks rapidly which could mean MM might step in a game.
TPs are on a chart.

C98 Update - Can EMA 200 hold?based on my previous analysis on c98
There price has been rejected without creating a double top as i was expecting which could be a good sign if you are in a long bias BUT it has also broke it's RSI uptrend which is not a good sign for you long guys
there are 3 scenarios i thing gonna happen, 2 of them long because if how bitcoin might act but if you ask me the third one which is a short setup is more probably, maybe a little push lower could happen who knows ...
IF you want to go long, wait for a candle stick pattern on the current level, if you are short, wait for EMA 200 to actually break and a pull-back to it is essential
Thanks for reading :)

#C98 4H TECHNICAL ANALYSIS#C98 4H TECHNICAL ANALYSIS
Due to the formation of the flag pattern and the use of Fibontchi projection, in addition to the possibility of climbing, possible goals can be understood.
TARGETS:
TARGET1 4.5
TARGET2: 5.3
STOP LOSS: 3.23
ENTRY: 3.5-3.8


C98USDT trade will be in range C98USDT trade will be in the range between two yellow zone area as it crosses any of the area trade will move in that direction. In first pathway trade will move towards $5.5. If it breaks resistance then trade will move towards $7.

Coin98 (C98) - October 4Hello?
Welcome, traders.
By "following", you can always get new information quickly.
Please also click "Like".
Have a nice day.
-------------------------------------
(C98USDT 1D Chart)
Due to the short period of chart formation and weak support and resistance points, careful trading is required.
First support zone: near point 3.0.
Second support section: 1.066-1.5
Resistance section: near point 4.968.
A move out of the downtrend line is emerging.
So, unless it goes below the downtrend line, it is expected to turn into an uptrend.
It is necessary to check if there is an upward movement along the uptrend line due to the volatility around October 10th.
It remains to be seen if the RS line can hold above the 80 point on the wRSI_SR indicator until the SR line rises above the 80 point.
------------------------------------------
We recommend that you trade with your average unit price.
This is because, if the price is below your average unit price, whether it is in an uptrend or in a downtrend, there is a high possibility that you will not be able to get a big profit due to the psychological burden.
The center of all trading starts with the average unit price at which you start trading.
If you ignore this, you may be trading in the wrong direction.
Therefore, it is important to find a way to lower the average unit price and adjust the proportion of the investment, ultimately allowing the funds corresponding to the profits to regenerate themselves.
------------------------------------------------------------ -----------------------------------------------------
** All indicators are lagging indicators.
Therefore, it is important to be aware that the indicator moves accordingly with the movement of price and volume.
However, for the sake of convenience, we are talking in reverse for the interpretation of the indicator.
** The MRHAB-O and MRHAB-B indicators used in the chart are indicators of our channel that have not yet been released.
(Since it was not disclosed, you can use this chart without any restrictions by sharing this chart and copying and pasting the indicators.)
** The wRSI_SR indicator is an indicator created by adding settings and options to the existing Stochastic RSI indicator.
Therefore, the interpretation is the same as the traditional Stochastic RSI indicator. (K, D line -> R, S line)
** The OBV indicator was re-created by applying a formula to the DepthHouse Trading indicator, an indicator disclosed by oh92. (Thanks for this.)
** Support or resistance is based on the closing price of the 1D chart.
** All descriptions are for reference only and do not guarantee a profit or loss in investment.
(Short-term Stop Loss can be said to be a point where profit and loss can be preserved or additional entry can be made through split trading. It is a short-term investment perspective.)

C98USDT Technical Analysis
⏳ Spot
💎 C98USDT has broken above the descending triangle and the major resistance. After the range it might go for a Pullback and then continues to go higher.
🏁 Short & Medium Term
💵 Invest Only 5% of your Portfolio
🎳 Entry at market or 3.700
☕️ TP1 4.140
🍺 TP2 4.420
🍻 TP3 5.150
🍾 TP4 6.250
🍷 TP5 _____
🍸 TP6 _____
🍹 TP7 _____
🎁 TP8 _____
🚫 SL 3.200
Good Luck 🎲
Check the Links in Description and If you LIKE this analysis, Please support our page and Ideas by hitting the LIKE 👍 button. ❤️ Your Support is really appreciated! ❤️
Traders, if you have your own opinion about it, please write your own in the comment box. We will be glad for this.
Feel free to request any pair/instrument analysis or ask any questions in the comment section below.
We will have more FREE forecasts in TradingView soon
Have a Profitable Day

c98 looks good c98 chart looks super good. retest looks already completed , but it has some small resistance here. might do a 2x from here
