C98USDT trade ideas

c98 / usdt 4h chart long ideac98 / usdt 4h chart long idea
ong setup for c98 ,but now its not a good entry , divergence formed on rsi and we expect a pullback to 0.45 dollar so wait for retest and reject , after rejection it can go to 0.51 dollar {resistant zone and weekly pivot}

C98 - Order Blocks C98 / USDT
To be clear, this is not a bullish structure. However if looking to enter a long, my strategy would be to enter in the lower green order block at support as we've tested it time and time again (no reason to enter in the mid-channel). Resistance block above in red that you could target for a long, otherwise boring chop in-between for now with less and less volatility.
Order blocks are a great way to identify areas of supply or demand, easily trapping retail traders in liquidity. Identify these more often and use them as areas for S/R and you may be able to gain an edge on other traders or more importantly, institutional players. Order blocks, simply put, are where larger players in the market are either entering or exiting positions. Large players being institutions, banks, or whales. They are frequently used in forex markets by banks and often times become trapping points for retail investors who may not understand what or where they are and get chewed up by the big chip players that have analysts and traders eating up liquidity or using retail as exit liquidity.
If you as a trader can better identify these blocks and levels, it will give you an edge against not only other traders, but against institutional participation.
V

C98: KEEP AN EYE.Guys, keep an eye on C98. If it retests back to the buying range then we can enter long with SL at $0.409. For now, keep this on your watch list.
Trade well.

Another fallAs we are aware of federal reserve's new policies, we don't let others deceive us. This market has two sides, long position for when it's bullish and short position for bearish. It depends on ourselves, we want to fight with this market or walk with that.
You can hold some coins and wait for 5 years but remember there is no guarantee that all these coins could be beneficial till then. Lots of them might leave us forever. Use existing opportunities and fix yourself with real world because you can't match market with your dreams. Even if price face an increment , it's just an opportunity to enter short position. Unless if we see changes in federal reserve's policies. Never trade based on my idea.
C98USDTHello Crypto Lovers,
Mars Signals team wishes you high profits.
This is a 4-hour-time frame analysis for C98USDT
Based on our last analysis on July 5, we expected a rising trend and now you observe that the price had a great rise during its next days. Here we have R1 that used to be a support line. And is our support area which shows the support of the price at some points since the past. At the moment, we see the price fluctuating over S1 and we believe it will have a pull back to R1 and here we will have a shot position for it and then we predict a fall for it to S1. By reaching at R1, it is possible for the price to rise over this line and have more increase. Even it is less probable for the price to experience more decline when it fall to S1 area and move below it.
Warning: This is just a suggestion and we do not guarantee profits. We advise you to analyze the chart before opening any positions.
Wish you luck

C98USDT BAT FORMATIONBat
The Bat Pattern is a 5-point retracement structure that was discovered by Scott Carney in 2001. It has specific Fibonacci measurements for each point within its structure and it is important to note that D is not a point, but rather a zone in which price is likely to reverse, called the Potential Reversal Zone (PRZ). The B point retracement of the primary XA leg must be less than a 0.618, preferably a 0.50 or 0.382 and the PRZ consists of 3 converging harmonic levels: 1) 0.886 retracement of the primary XA leg, 2) extended AB=CD pattern, usually 1.27 AB=CD and 3) minimum BC projection is 1.618.
The first target would be the 382 retracement of AD and the second target the 618 retracement of AD. A common stop level would be behind the X-point. Conservative traders may look for additional confirmation. Bat Patterns can be bearish and bullish. TradingView has a smart XABCD Pattern drawing tool that allows users to visually identify 5-point reversal structures on a chart.

Coin98 #C98 $C98 Update (July-6)The buying power of C98 is quite strong and it has just regained the $0.5 zone so in the near future we can expect a rally to the $0.7 zone.
Currently, C98 has also started a marketing campaign with the goal of attracting more users of its platform. This is the beginning of growth.
We can start accumulating C98 in 0.45-0.5$ zone and stop loss when it loses this zone

C98USDTHello Crypto Lovers,
Mars Signals team wishes you high profits.
This is a one-day-time frame analysis for C98USDT
Based on our previous analysis on June 21, we expected the price to fall and now you see that this falling trend has happened and accordingly, one of our our targets is hit. At the present, we have R2 and R1 as our resistance areas. And S1 is our support area which includes the support of the price at some points. At the present, we see a head and shoulders pattern in our chart and the price is fluctuating below R1. We believe a rise toward R1 would happen and at this point, we can consider a short position to S1. If the price falls toward S1, we expect the right shoulder to be formed for our pattern. But in case the price moves above R1 and fixes there, then we will consider a long position to R2. So please consider the stop loss point due to the unstable condition of the market.
Warning: This is just a suggestion and we do not guarantee profits. We advise you to analyze the chart before opening any positions.
Wish you luck

Coin98 longAscending triangle on Coin98 chart is broken up. Bullish movement to resistance level at 0.537 is expected to happen.

C98usdt BitgetThis is a 4-hour-time frame analysis for C98USDT
Based Given the significance of the level of 0.489, You can see that the price has been on an upward trend, attempting to reach 0.574. Currently, there is a support line and support zones that highlight the price support at random areas. Currently, the price is always changing. forecast a reduction in price attributed to an increase upward to 0.574.

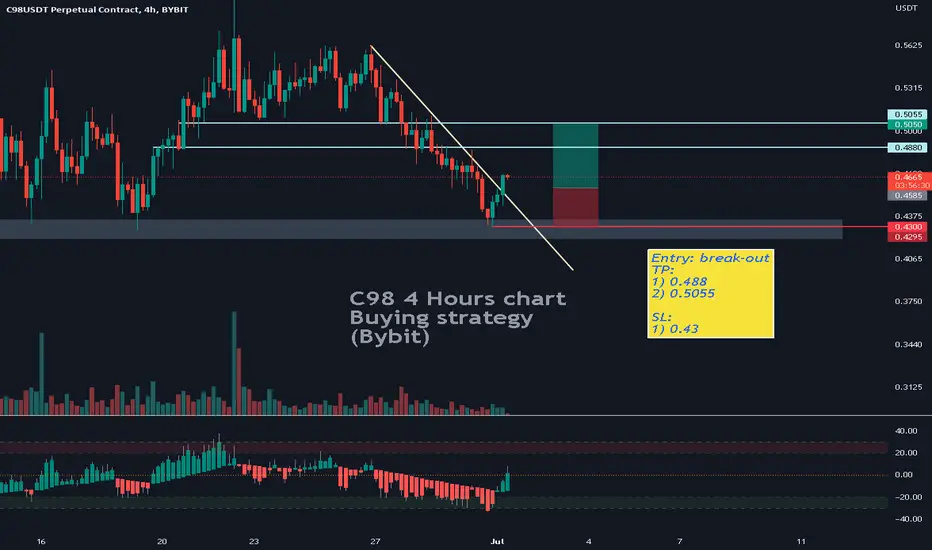
C98 - Buying signalBYBIT:C98USDT
4 Hours Time Frame
-
C98 broke out the downtrend on 4H
We can set a quick strategy with good risk to reward ratio here.
-
Targets:
1) 0.4880-----green horizontal ray
2) 0.5055-----green horizontal ray
Stop loss:
1) 0.43-----red horizontal ray
C98USDTHello Crypto Lovers,
Mars Signals team wishes you high profits.
This is a 4-hour-time frame analysis for C98USDT
Based on our previous analysis on June 15, we predicted a rising trend for the price and now you see that it has happened. At the moment, we have R2 which used to be a support line and also S1 and S2 are support areas that show the support of the price at some points. At the present, the price is fluctuating over S1. We predict the price will fall to S1 and then it rises upward to R1. If the price has a fixation over R1, then we will wait for more rise for it toward R2. But in case the price falls below S1, surely it will face more decline.
Warning: This is just a suggestion and we do not guarantee profits. We advise you to analyze the chart before opening any positions.
Wish you luck

strong support on C98USDTwe have good support on 0.428 and if breakout 0.546 and pullback we can open long position on it

C98BINANCE:C98USDT
COINBASE:C98USD
The price on the C98 chart is on a 4-hour rising channel.
Given the significance of the level of 0.574, a sell position down to f0.465 level can be anticipated if the price rises up in the uptrend channel and reaches the area of 0.574.
(To enter the position, the 4-hour candle must not close the price above this level after reaching the level of 0.574.)
The level of 0.679 is where the sell position's ideal stop-loss should be placed.
Like and share the concepts and analysis if you find them useful.
CrazyS.

C98USDT
Hello Crypto Lovers,
Mars Signals team wishes you high profits.
This is a 4-hour-time frame analysis for C98USDT
In this chart, we have R1 which used to be a support line and expresses the well support of the price at some points. S1 area includes a support area that shows the support of the price since the past. After a falling trend and reaching to S1, the price faced a little rise and at the present, it is fluctuating over S1 area. We believe the price will have more decline to S1 due to the existence of shadows in price and then start a rising trend toward R1. Also, it is possible for the price to lose the support at this point and face more decline to the bottom of S1.
Warning: This is just a suggestion and we do not guarantee profits. We advise you to analyze the chart before opening any positions.
Wish you luck

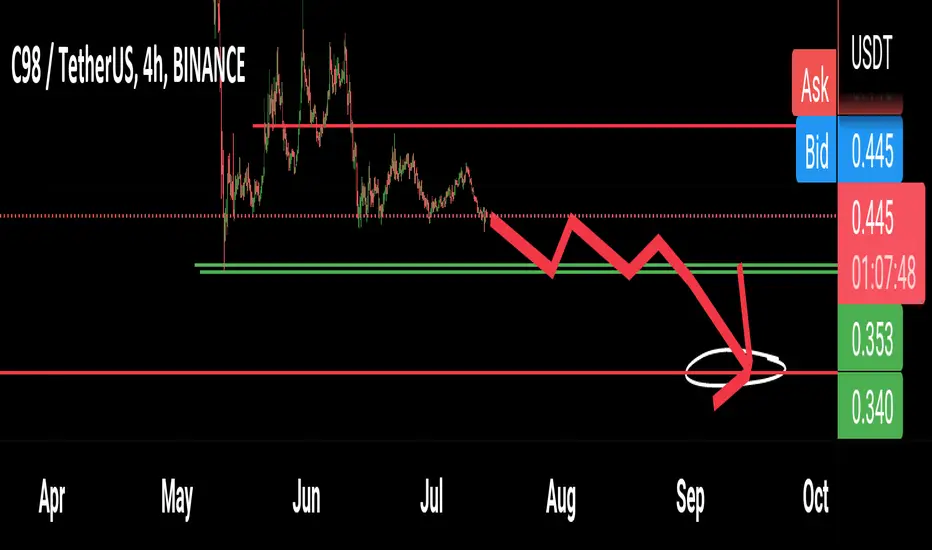
Short C98C98 has been one of the most volatile cryptos since the big drop of BTC on 11th May. It recovered more than 120% since the local bottom.
Today, it broke its trendline (on 4H TF). Also, the RSI's one was broken. Retest of these trendlines seems to be on-going. I think that C98 will be rejected (by trendlines) and will continue to go down. My expected targets are presented in chart, for this "short" scenario.

C98usdt Trading opportunityPrice hitting very strong support zone after hitting ATH in August 2021. At same time spotted completed 5 corrective waves.
This support also equivalent to bottom trendline of downtrend channel. We should expect some relief rally to step in from here. Although it will not be a straight up move.
The idea here will be to accumulate within the zone and always make sure to apply good money management.

C98HEY GUYS what do you think about C98?
If this post was useful to you, do not forget to like and comment.❤️

C98 - I bought some!Hey Guys, C98 seems bullish. I bought some with spot!
NO FINANCIAL ADVICE | DYOR | HAPPY TRADING

C98 - Listed on Coinbase but that was a trap for bulls🐮Reasons to take short
⭐️ BTC bearish
⭐️ Trendline is clear
⭐️ Volume at top
⭐️ Trapped a lot of bulls with listing
⭐️ 5th touch
⭐️ Under VWAP
Will enter when price squeezes to the trendline on 5m timeframe, the base will form and the strip will get faster.
If you don't understand the previous sentence, just use swing stop-loss 3-5%
Fix profit by parts:
1% - 1/3
2% - 1/3, stoploss to breakeven
What's left, hold to the maximum
What do you think of this idea? What is your opinion? Share it in the comments📄🖌
If you like the idea, please give it a like. This is the best "Thank you!" for the author 😊
P.S. Always do your own analysis before a trade. Put a stop loss. Fix profit in parts. Withdraw profits in fiat and reward yourself and your loved ones

C98: READY FOR 50% RALLY!!!Hello traders, here's a trade setup on C98/USDT in 3 hours TF:
C98 is at the support level and could be a good accumulation range. If C98 bounces back like before then we can expect a close to a 50% rally.
Entry: $0.56 to $0.6
Stop Loss: $0.49
Targets:
$0.65
$0.71
$0.75
$0.81
Note: Use 5x to 10x leverage and accumulate the dip. DYOR before investing.

C98USDT Ready to break out? Bullish OBV and CVD DivergencesBYBIT:C98USDT
Coin98 is currently bouncing off the range POC. If we get bullish price action here and hold this level, we could see a breakout happening.
Bullish OBV and CVD Divergences are forming on the 30m and 1hr chart.
We also have a massive Falling Wedge pattern. If we break out of the upper trendline, we could see big moves ahead, especially if Bitcoin breaks out and starts heading towards $35000.
TP areas in the video as per levels marked on the chart.
SL according to your risk tolerance.
Not Financial Advice. DYOR. Papertrade before using real money.
If this analysis helped you, please give it a thumbs up and follow.
Trade Safely,
Shawn
