Coin98 longCoin98 bounced off the ascending trendline. Asset broke trough the descending trendline. Bullish movement to resistance level at 1.13 is possible.
C98USDT trade ideas

C98 - POSSIBLE SHORT OR LONGHey Guys, if C98 falls under the support, it could be a possible short. If we hold, it could be long opportunity. Let`s wait for it!
NO FINANCIAL ADVICE | DYOR | HAPPY TRADING

Coin98 shortCoin98 bounced off the descending trendline. Asset bounced off the resistance area. Bearish movement to support level at 0.34 is expected to happen.

C98USDT H1SELL ENTRY @0.690
STOP LOSS@0.726
TAKE PROFIT@0.633
Market Update (Looking to Long) Like and Subscribe
Thank you Please support our analysis with a like or comment

C98 a nice ride?Fundamentals:
+/- DEFI Agregator
+/- DEX
+Cross Chain
Opinion:
Just another copy of 1inch with extra Defi/Yield features and CrossChain. Unlikely to pump outside token-economics shifting events.
This is not intended or made to constitute any financial advice.
Notes on how I personally use of my charts/NFA:
Each level L1-L3 and TP1-TP3 has a deployment percentage. The idea is to flag these levels so I can buy 11% at L1 , 28% at L2 and if L3 deploy 61% of assigned dry powder. The same in reverse goes for TP. TP1: 61%, TP2:28% and TP3:11%. If chart pivots between TP's, in-between or in Between Sell levels these percentages are still respected. I like to use the trading range to accumulate by using this tactic.
Just my personal way of using this. This is not intended or made to constitute any financial advice.
This is not intended or made to constitute any financial advice.
FED Macro Situation Consideration:
All TP's are drawn within the context of a return to FED Neutral policy. I do not expect these levels to be reached before tightening is over.
NOT INVESTMENT ADVICE
I am not a financial advisor .
The Content in this TradingView Idea is for informational purposes only, you should not construe any such information or other material as legal, tax, investment, financial, or other advice. Nothing contained within this idea constitutes a solicitation, recommendation, endorsement, or offer to buy or sell any securities or other financial instruments in this or in in any other jurisdiction in which such solicitation or offer would be unlawful under the securities laws of such jurisdiction.
All Content on this idea post is information of a general nature and does not address the circumstances of any particular individual or entity. Nothing in the idea/post constitutes professional and/or financial advice, nor does any information on the idea/post constitute a comprehensive or complete statement of the matters discussed or the law relating thereto. You alone assume the sole responsibility of evaluating the merits and risks associated with the use of any information or other Content on the idea/post before making any decisions based on such information.

C98 15M scalpingI guess thats why it bounce off to the moon.. It made a cup and handle pattern. Should have long it.

A hunch, trading pair C98USDT on Binance.From previous chat patterns on the 3H time scale, C98 is going through a down trend, a couple of LH's and LL's (Low Highs and Low Lows) if a bullish candle is formed we may start the ride to a possible LH trend.

C98 hit the targetHello trading view community. Should you like this analysis please support with likes and comment your idea below the analysis please. Thanks.
Never risk more than you can afford to lose.
Always DYOR.
C98 made a history today, It hit not only to our price expectation, but it dropped to ($0.34), then shadoed up, still market may crash more due to BTC
If BTC crashes more tomorrow again, one may expect C98 crash to ($0.25).
This is a personal idea and I am not a financial adviser.

No support remained for C98Hello trading view community. Should you like this analysis please support with likes and comment your idea below the analysis please. Thanks.
Never risk more than you can afford to lose.
Always DYOR.
C98 has already broken all its weekly and daily support levels, and from now on it is making ground for future, and it is running deep in downtrend channel.
If BTC goes bearish and drops more, one may obtain C98 in as low price as $0.50 which will be really sweet deal.
This is a personal idea and I am not a financial adviser.

NO DRAMA - YOU KNOW WHERE TO BUY AND WHERE TO SELLHELLO GUYS
This is WeOOO
c98 backed by binance
binance labs invested in their project
chart looks clear as water
leave some place for wicks and cz wicks
HODL and you know where to SELL
keep the SL in ur brain
thanks again
Remember again MR. weOOO doesnt have money to buy so you guys enjoy the gains!!!!!

C98 at a major responsive zone!!!We had broken a falling wedge before!
Now the alt is at a clear demand zone!
The zone should respond accordingly!
Or, the alt will see ATL soon!

C98USDT BUTTERFLY PATTERNButterfly
The Butterfly Pattern is a distinct 5-point extension structure that was discovered by Bryce Gilmore and further defined by Scott Carney. It has specific Fibonacci measurements for each point within its structure and it is important to note that D is not a point, but rather a zone in which price is likely to reverse, called the Potential Reversal Zone (PRZ). The B point retracement of the primary XA leg lies at 0.786 and the PRZ consists of 3 converging harmonic levels: 1) 1.27 extension of the primary XA leg, 2) AB=CD pattern, either equivalent or 1.27 and 3) Extreme BC projection of 2.00, 2.24 or 2.618.
The first target would be the 382 retracement of AD and the second target the 618 retracement of AD. Common stop levels lie behind the next structure level after the D point or the 1.41 extension of XA. Conservative traders look for additional confirmation. These patterns can be bearish and bullish. TradingView has a smart XABCD Pattern drawing tool to visually identify 5-point reversal structures.


C98 USDT- Watch for bullish price action on lower timeframe
- Not anticipating price to break the bottom so stops would be safe below that level
- Targets: 4.4, 6.2, actively manage the rest

Coin98 longSymmetrical triangle on C98 chart is broken up. Bullish movement to resistance level at 1.4 is expected to happen.


Coin98 longCoin98 bounced off the support level. Asset broke trough off the upper boundary of descending channel. Bullish movement to support level at 1.53 is expected to happen.

C98 ready for POC rally?!Hey, looking at C98, we might see a relief ... Im long with x3 and exit close to POC. Invalidity on the chart.

c98 about to go long as u can see guys C98 is about to confirm long position , set your stoploss management and have a great deal ..

C98 Ideasdow theory + Fibonacci...
determine the buying and selling area, according to 2 plans,
plan A + plan B

$C98USDT UPDATE!!!!Hi Snipers,
Please refer to the recording for the next price levels and scenarios.
Thanks
MS

🔥 C98 Massive Bearish Channel: Break Out When?C98 saw a massive launch on Binance, where it gained over 800% in a matter of a couple of weeks. However, C98 has been selling off considerably since then.
During this sell-off, a bearish channel formation has been formed. With the recent bullish price action in BTC I'm eyeballing a bullish break out in the near future.
Ideally we get a big green candle with a lot of volume to confirm the bullish break out. Keep in mind that we're far from certain yet and that we could as well bounce off and see further downside. Keep an eye on this one!
Happy trading!

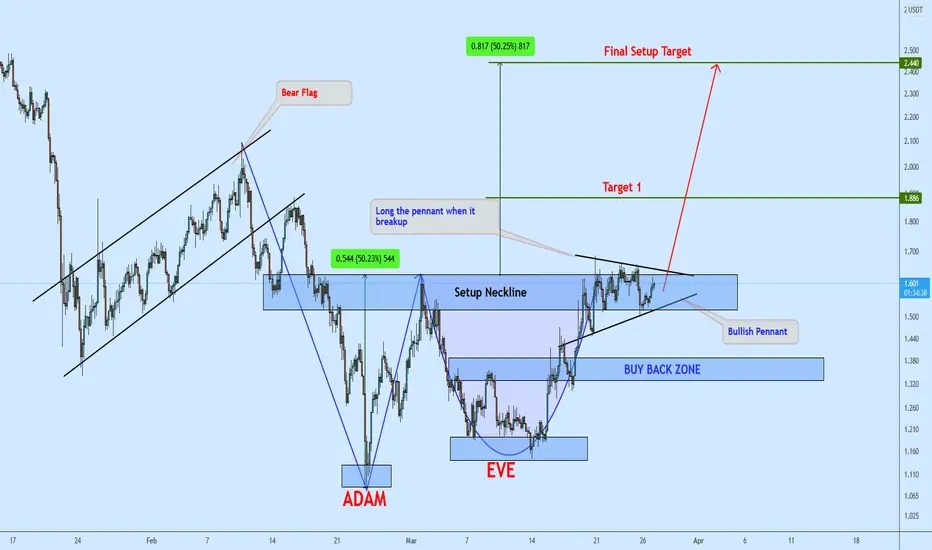
C98usdt on the verge of BreakoutWe should focus on this for quick profit, spotted clean Bullish Pennant after price successfully formed ADAM and EVE.
The idea will be to Buy the pullback to the pennant when it break upside or wait for price to give a retracement with pennant breaking down to clear stop loss before the main rally begin.
Which of the way we should learn more on how to make more profit from market.