C98USDT trade ideas

C98/USDT | 1W 👀As expected, the coin briefly consolidated after the correction, before embarking on a gradual ascent along with the rest of the market.
At current levels, I wouldn't recommend buying the coin, as I anticipate a decline.
- Not financial advice, trade with caution.
#Crypto #Coin98 #Investment #C98
✅ Stay updated on market news and developments that may influence the price of Coin98. Positive or negative news can significantly impact the cryptocurrency's value.
✅ Exercise patience and discipline when executing your trading plan. Avoid making impulsive decisions driven by emotions, and adhere to your strategy even during periods of market volatility.
✅ Remember that trading always involves risk, and there are no guarantees of profit. Conduct thorough research, analyze market conditions, and be prepared for various scenarios. Trade only with funds you can afford to lose and avoid excessive risk-taking
#Crypto #Coin98 #Investment #C98

$C98 Round 2Founder’s tweet: 01/19/2024 11:00AM UTC Mark your calendar.
twitter.com
4HR:
* Golden Cross
* Got out of falling wedge
1D:
* MA50 > MA100 > MA200
* Supertrend is long
* Chikou Span > Price
* Possibility of Cup and Handle Formation

#C98USDT (Watchlist) 2-2024
#C98 is displaying a significant Bullish Inverse Head and Shoulders pattern. A successful breakout from this pattern is expected to propel C98 towards $0.55. However, the validity of this pattern will be compromised if prices retreat back below $0.21 on the weekly timeframe.
Consider for Watchlist:
When we recommend adding a coin to your watchlist, it's typically due to forming a pattern, nearing a historical bottom, or approaching a strong support level. It may also show increased trading volume, reversal candles, or be in an accumulation stage. While we haven't observed a bullish reaction yet, we advise monitoring it until an optimal entry point emerges.
PS:
We avoid trading coins associated with gambling, prostitution, human trafficking, etc.
Note:
This is not financial advice but an analysis of coin movements. Conduct your own research and practice risk management before making any investment decisions. Remember, the cryptocurrency market carries significant volatility and risks.
Best wishes to all,
we ask Allah reconcile and repay. 🙏

C98USDT Inverse Head and Shoulder Pattern!C98USDT Technical analysis update
C98 price exceeded the neckline of an inverse head and shoulders pattern on the weekly chart, which took approximately 500 days to form. While this technical indicator may suggest potential bullishness
Buy zone : Below $0.36
Stop loss : $0.28
Regards
Hexa


C98USDT Elliott Waves AnalysisHello friends.
Please support my work by clicking the LIKE button👍(If you liked). Also i will appreciate for ur activity. Thank you!
Everything on the chart.
Entry: Market and lower
Targets: 0.48 - 0.65 - 0.85
Stop: under 0.13 (depending of ur risk).
RR: 1 to 10
ALWAYS follow ur RM.
risk is justified
Good luck everyone!
Follow me on TRADINGView, if you don't want to miss my next analysis or signals.
It's not financial advice.
Dont Forget, always make your own research before to trade my ideas!
Open to any questions and suggestions


C98USDT IDEAUPDATE
Bullish pennant Breakout is Already Done in 1D Timeframe.
Running in almost 15% Profit so Far since the wedge break out, Still expecting 30% profit.
COIN DETAILS
The live price of Coin98 is $ 0.236229 per (C98 / USD) with a current market cap of $ 164.18M USD. 24-hour trading volume is $ 6.58M USD. C98 to USD price is updated in real-time. Coin98 is -2.93% in the last 24 hours with a circulating supply of 695.00M.

C98 target 0.361D time frame
-
C98 is retesting a rounding bottom structure, that support around 0.2~0.21. Also, C98 is making a potential symmetrical structure, which is like a bottom head and shoulders. Therefore, we can use Fibonacci Projection to set up a perpetual trading plan with great RR around 5.7.
-
TP: 0.367 / 0.47 / 0.55
SL: 0.192

C98 swing longAn idea for a long swing
Invalidation is it price goes below ema 50 weekly and closes below it
Price can have a nice uptrend if the bounce happens
Chart on phone still cuz I don't have my laptop with me
Will chart better on pc starting from next week
Nfa educational purpose only


$C98* Cup & handle formation
* 4HR ASY buy signal already triggered
4HR:
Bullish trend strength: 13
MA7 > MA25 > MA99
MA50 > MA100 > MA200
Kijun Sen acting as support
Bearish reversal potential: 5
MACD Bearish Cross
1D:
Bullish trend strength: 32
MA7 > MA25 > MA99
MA50 > MA100 > MA200
Supertrend is long
Price > MA50
Price > Tenkan Sen
Price > Kijun Sen > Kumo
Chikou Span > Price
Bearish reversal potential: 2
Recent DI+ / DI- Bearish Cross

jeffans: C98USDT +40% move after retest C98USDT is going to do +40% move after retest and cup and handle pattern

✴️ C98 Giant A&E Formation Aims Towards $1.98 Or Up 620%It is hard to miss the gigantic Adam & Eve bottom pattern here, depicted blue on this chart. This is a bottom pattern that's been in the making for 13 months and is now 100% bullish confirmed.
This pattern has a high level of success/accuracy and even more when the rounded part is completed as shown here.
Let's ignore the intermediate targets and go straight to the top.
👉 The main target with better chance of hitting sits at $1.285 for ~365% potential profits, which would equal ~465% total growth.
👉 The second target is a bit higher but doubles profits/growth potential, that would be $0.198 or around 620%.
Again, this can all happen in a short time window, say 2-3 months.
I'll admit something to you right now, the bullish momentum can start in 3 days just as it can start in 3 weeks or 6 weeks, but once it starts going up, that's when we should aim for the targets mapped on the chart.
C98USDT has been growing since late October but still trading within April's and February's peak price. Once these two peaks are gone, that's when we can expect explosive growth.
This is not financial advice.
Thank you for reading...
Thank you again for your continued support.
Happy holidays to you and those you love.
Namaste.

C98 targets!C98 is another DeFi platform to swap,borrow,lend and invest with crypto assets.
They have an interesting wallet and app for the mobile users iOS and Android.
i use it on my ipad
i believe is a promising project
-not a financial advise for sure
Fibonacci targets plain and simple! for holders.

C98USDT.1DBased on the provided market data, the currency C98 is currently in a bullish trend across all time frames (4h, 1d, 7d).
The RSI (Relative Strength Index) values for all time frames are above 70, indicating that the currency is currently overbought. This could potentially lead to a price correction in the future.
The MACD (Moving Average Convergence Divergence) values for all time frames are positive, indicating a bullish trend. MACD is a trend-following momentum indicator that shows the relationship between two moving averages of a security's price.
The Bollinger Bands (Bb) for all time frames are below the current price, which could indicate that the currency is trading at an elevated level.
The support levels are increasing in value across all time frames, which is a good sign for the currency's upward trend. However, the resistance levels are also increasing, indicating that the currency may face selling pressure at these levels.
Based on the technical analysis, it seems that the currency C98 is in a strong uptrend but is currently overbought, which could lead to a price correction. However, the positive MACD values and increasing support levels could continue to drive the price upwards. Investors should proceed with caution due to the overbought conditions and potential for a price correction.
Please note that while technical analysis can be a useful tool in predicting market trends, it should not be used as the sole decision-making tool. Always consider multiple factors when making investment decisions.


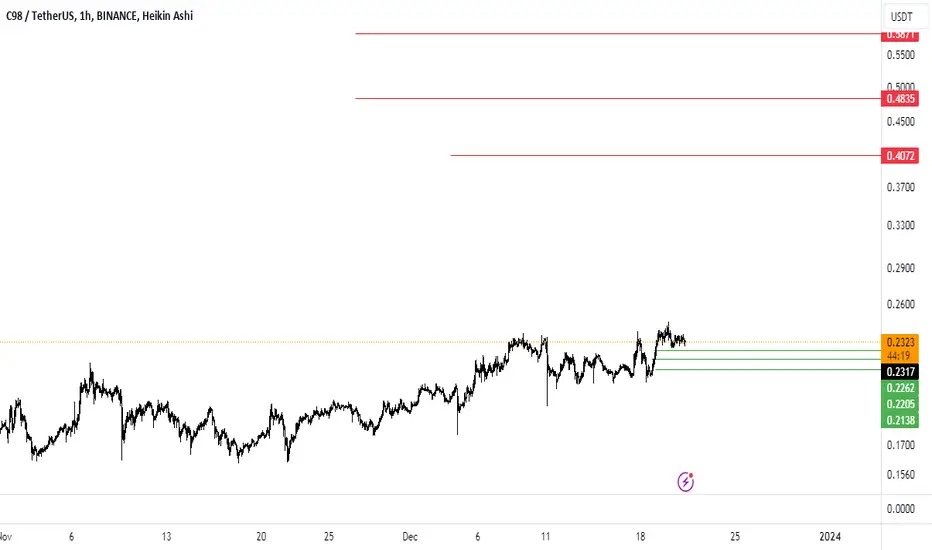
c98For me, the red lines are important goals that I am waiting to react to in the long term. In the short term, it can be checked by maintaining the green lines. If it fails, it will be checked again.
C98 can give a correctionWe have a price channel that is close to the ceiling of this channel
Also, the price becomes an important and strong resistance that overlaps with the ceiling of the price channel
In the lower areas, we have a liquidity pool where the price is expected to return to the bottom by hitting the resistances and sweep this liquidity pool.
For risk management, please don't forget stop loss and capital management
Comment if you have any questions
Thank You

#C98/USDT - Long - Potential 29.86%Strategy: Long
Exchange: BYBIT
Account: Spot
Entry mode: Market order in range
Invest: 2.5%
Exit:
• Target 2 : 0.2944 29.35%
• Target 1 : 0.2396 5.27%
Entry: 0.2276 ⌁ 0.2276
⎿ Current market price: 0.2276
Stop: 0.2029 (-10.85%)
Technical indicators:
• ⎿ 24h Volume: 550981.021462
• ⎿ Satoshis: 0.2276
• ⎿ Analysis: TradingView
Bullish pump in a utility coin that seems to be benefitting from the SEC / Binance US settlement rumours.
I like the bounce from the lowest trendline on our pitchfork (uptrend confirmed by the fast MA's 20 & 50 crossing above the slow 200) and hope we see a move towards the upper trendline with a nice order block protecting the SL.

C98/USDT Its time to buy ...
All that can be said is that the tool is in the accumulation phase and is worth your attention. In the long run, it's just space. The monthly schedule confirms this

C98USDT Elliott Waves AnalysisHello friends.
Please support my work by clicking the LIKE button👍(If you liked). Also i will appreciate for ur activity. Thank you!
Everything on the chart.
Targets: 0.22 and 0.24
after first target reached move ur stop to breakeven
Stop: ~0.15 (depending of ur risk). ALWAYS follow ur RM .
RR: 1 to 3
risk is justified
Good luck everyone!
Follow me on TRADINGView, if you don't want to miss my next analysis or signals.
It's not financial advice.
Dont Forget, always make your own research before to trade my ideas!
Open to any questions and suggestions
