AUDCAD Q3 | D23 | W30 | Y25📊AUDCAD Q3 | D23 | W30 | Y25
Daily Forecast🔍📅
Here’s a short diagnosis of the current chart setup 🧠📈
Higher time frame order blocks have been identified — these are our patient points of interest 🎯🧭.
It’s crucial to wait for a confirmed break of structure 🧱✅ before forming a directional bias.
This keeps us disciplined and aligned with what price action is truly telling us.
📈 Risk Management Protocols
🔑 Core principles:
Max 1% risk per trade
Only execute at pre-identified levels
Use alerts, not emotion
Stick to your RR plan — minimum 1:2
🧠 You’re not paid for how many trades you take, you’re paid for how well you manage risk.
🧠 Weekly FRGNT Insight
"Trade what the market gives, not what your ego wants."
Stay mechanical. Stay focused. Let the probabilities work.
FRGNT
CADAUD trade ideas

AUD/CAD LIVE TRADE UPDATE📍AUD/CAD – Live Trade Update
We’re still in this trade, and the structure suggests more downside potential.
All VMS criteria remain intact, and we’ll continue to monitor volume, momentum, and price behavior closely.
📌 Patience is part of the plan. Let the setup work.

BUY AUDCADAUDCAD has triggered the buy order. Pricing is climbing up towards the 0,89800 supply area.

+AUDCAD (0,89100 to 0,89800) All eyes on AUDCAD. Price is testing the resistance trend line and will soon break above it. A bullish flag pattern can be spotted on the 4 hour chart.

AUD/CAD LIVE TRADE UPDATELIVE TRADE – VMS Pullback Strategy
We entered this trade based on a classic VMS pullback setup:
Price pulled back into a 3-touch S/R zone
Volume and momentum aligned with the direction
Engulfing candle trigger confirmed the move near the 50EMA
Now we’re simply letting the trade play out.
📌 The work is done before entry. Discipline does the rest.

AUDCAD in Downtrend ContinuationSell Limit
Entry Price 0.8945
Stop Loss 0.8975
Risk 1%
Lot Size 1.14
TP (1RR) 0.8915
TP (2.5RR) 0.8866

AUDCAD - Buyers ready to step in AUDCAD is in moving in LTF consolidation before next impulsive phase. Couple highs to target a good R ratio.
Good Luck

AUDCAD POTENTIAL BUY OPPORTUNITY Price currently trades at 0.89166 in today’s trading session I’m looking forward to buying AUDCAD From the current market price with my stop loss situated at 0.88806 and take profit at 0.90227

AUDCAD Is Going Up! Long!
Take a look at our analysis for AUDCAD.
Time Frame: 12h
Current Trend: Bullish
Sentiment: Oversold (based on 7-period RSI)
Forecast: Bullish
The market is approaching a key horizontal level 0.896.
Considering the today's price action, probabilities will be high to see a movement to 0.905.
P.S
Please, note that an oversold/overbought condition can last for a long time, and therefore being oversold/overbought doesn't mean a price rally will come soon, or at all.
Disclosure: I am part of Trade Nation's Influencer program and receive a monthly fee for using their TradingView charts in my analysis.
Like and subscribe and comment my ideas if you enjoy them!

AUDCAD BUY SETUPTHE PRICE FORMED HEAD AND SHOULDER
and do rejection from mitigation order block and imbalance
and we have liquidity on time frame daily buy side liquidity
and time frame weekly double top
so I will buy with you
DON'T forget to follow me so that get more refresh analysis
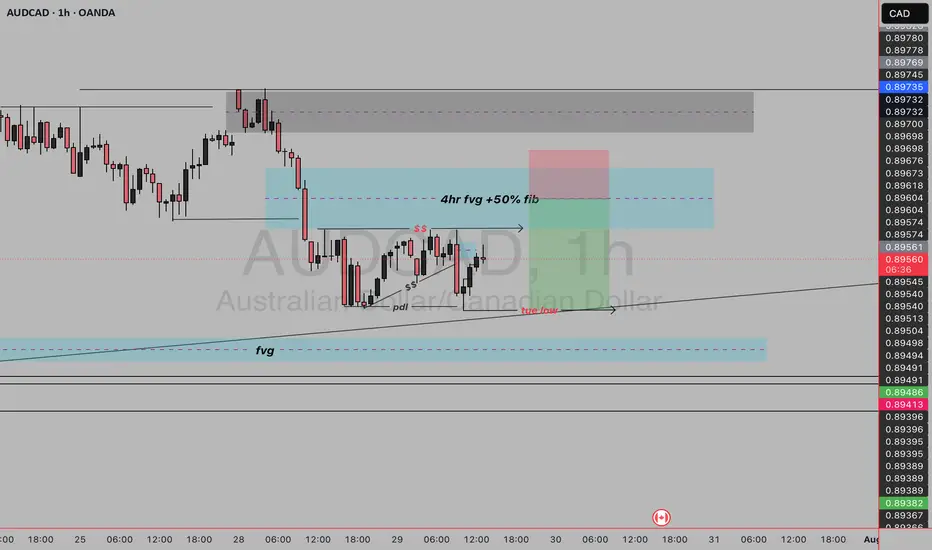
audcad sell setupThis AUD/CAD H1 chart shows a Smart Money Concept (SMC) based sell setup, focused on liquidity engineering, internal structure shifts, and supply zone rejections.
Key Features of the Sell Setup
1. Break of Market Structure
Price previously rallied and made a high at 0.90140.
After that, there was a clear break of structure to the downside with strong bearish candles—indicating distribution and a bearish order flow shift.
2. Premium Supply Zone (Blue Box)
The price is retracing back into a supply zone, where institutional orders previously caused the strong drop.
The blue zone marks a bearish Order Block or supply area where price is expected to react.
Your entry is placed just below this zone.
3. Equal Highs / Liquidity Above
Multiple internal highs were created (marked with $$)—these are liquidity traps.
Price is likely to grab liquidity above these highs before rejecting from the supply zone.
4. Entry Context
Sell entry is placed after a liquidity sweep above minor internal highs.
The Current High (crt high) marks the point of internal liquidity.
This entry is anticipating a rejection from this area (above previous highs but below the OB's top).
5. Fair Value Gap (fvg)
A clear FVG exists below current price—this is your downside magnet or target area.
Price often fills FVGs after mitigation of supply/demand.
6. Stop Loss & Take Profit
Stop Loss (red box): Placed above the supply zone and liquidity grab area, protecting from deeper retracements.
Take Profit (green box): Aiming toward the FVG zone and unfilled imbalance near 0.89430–0.89390.
Why This Is a Valid Sell Setup
Break of Bullish Structure (Shift in Order Flow).
Liquidity Sweeps above equal highs.
Retracement into Supply Zone / Premium.
Confluence with FVG below for target
AUD/CAD’s Big Move: Don’t Sleep on This Breakout Setup!Hey traders, Skeptic from Skeptic Lab here! 🔥 While everyone’s freaking out over interest rate news and Non-Farm Employments , AUD/CAD ’s stealing the show on the daily time frame.
📉Post-tariff crash, it’s rebounding strong. A daily resistance break could kick off a major uptrend. Use RSI overbought/oversold ( linked in my TradingView article ) to confirm momentum.
👀Beware of fakeouts this week—volatility’s high! Trade smart, keep risk tight, and don’t FOMO. Share your thoughts in the comments, boost if it helps <3 🩵

AUDCAD Bullish Setup – 15min Structure Shift1. Price was trading at a discount in the context of a higher time frame bullish trend (HHs and HLs).
2. On the 15-minute chart, price attempted to break a previous lower low but failed — signaling potential exhaustion in bearish pressure.
3. This failure to break structure on the 15 min suggested sell-side liquidity was absorbed, and smart money shifted direction.
4. Price then broke short-term 15-minute structure to the upside, indicating a bullish order flow shift.
5. A bullish retracement followed into an OB, offering a high-probability entry point before continuing higher.

AUDCAD Forex Heist Plan: Entry, SL & TP by Thief Trader Style🏴☠️🔥 AUD/CAD Bank Heist Plan – Thief Trader's Long Con in Motion! 🔥🏴☠️
Breakout Bulls vs Bearish Guards – Who Wins the Forex Vault This Time?
🌍 Hello Money Makers, Market Bandits, and Strategic Robbers! 💰🚀💣
It’s Thief Trader back again, dropping heat with another high-stakes Forex bank job – this time we're targeting the AUD/CAD vault. This is not your grandma’s trading plan. We’re executing a well-calculated heist based on a fusion of technical breakouts + fundamental drivers with a dose of pure trading psychology warfare. 🎯
💼 The Heist Blueprint: Long Entry Game Plan
🧠 Our job is to move in silence until the breakout alarms go off.
We target 0.90200 as the clean breakout trigger over the Moving Average. This zone marks the guard shift — bulls take over if we break through.
📌 Entry Types (Choose your weapon):
🔹 Buy Stop: Above 0.90200 (Post-MA breakout confirmation).
🔹 Buy Limit (DCA Style): Set limit buys at recent lows (M15/M30 swing low) for pullback entries. Layer your entries like a true strategist.
🔔 Set Alerts: Don't sleep on this. Place alerts at breakout zones – let the chart notify you when the bank door opens. 📡
🛑 Risk Management – The Escape Plan
We don't jump in blind. Place your Stop Loss ONLY AFTER the breakout confirms.
📍Suggested SL: 0.89600, near recent 4H wick low.
🔥 Reminder: Your stop depends on your lot size, risk tolerance, and how many entries you're stacking. Don't set it too tight – we don't want early alarms killing the mission.
🎯 Profit Target – Rob & Exit
📍 Primary TP: 0.91200
🎭 Or simply: Escape before the alarm rings (i.e., close early if you see price weakness near resistance or news surprises).
🧲 Scalpers, stick to long bias only. If you're running capital deep, go in hard. If not, ride with the swing team. Use trailing SLs to protect and ride the move like a ghost.
🧠 Behind the Heist – What Fuels Our Mission?
The AUD/CAD pair is showing bullish signs backed by:
✴️ Macroeconomic indicators
✴️ Central Bank divergences
✴️ COT data (Commitment of Traders)
✴️ Intermarket correlations
✴️ Sentiment shifts & positioning strategies
Before executing any trade, read your fundamentals. Study the landscape. Then strike. 🕵️♂️
⚠️ Trading Safety Alert – Timing Is Everything
🚫 Avoid placing trades during high-impact news.
✅ Use trailing SL to lock in profits and prevent whipsaw hits.
📊 Protect your capital like it’s stolen loot – because it is!
💥Support the Crew 💥
🚀 Smash that 💗 Boost Button if you’re vibing with the plan.
Every like strengthens the Thief Trading Crew – and gets us closer to daily market domination. 🎉💪
📲 Stay locked in. Another heist is coming soon.
Till then – rob smart, trade sharp, and vanish like a legend. 🐱👤💸
🔑 #AUDCAD #ThiefTrader #ForexBreakout #LongSetup #ScalpToSwing #TradeWithPlan #DCAEntry #ForexHeist #MarketStrategy #RiskReward

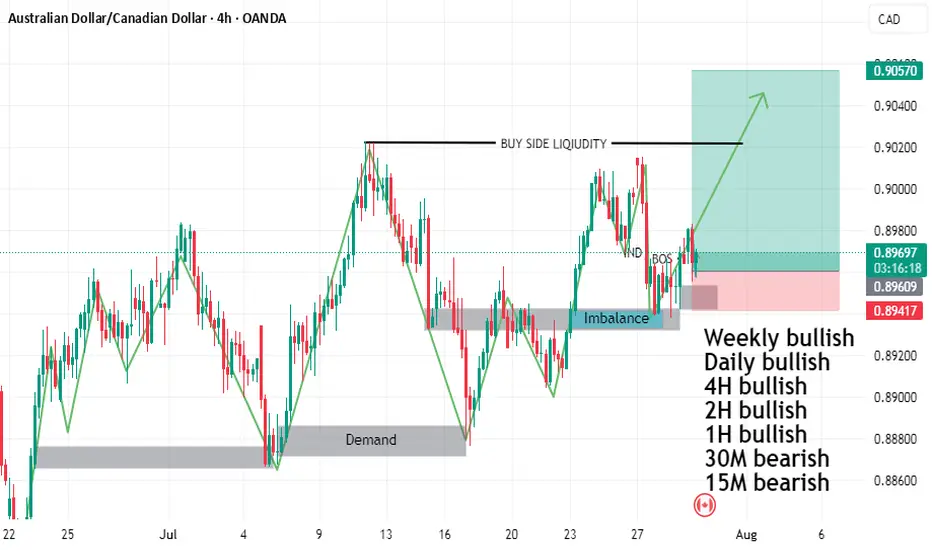
Trade Uni - AUDCADTrade Analysis: Bullish
Risk: 1%
Timeframe: H4
Entry Price: 0.89400
We have a break of a chart structure. Prices have broken through on the upside above the 200-day ema with new bullish momentum.
A long trade has been taken with a minimum 1:1 risk reward ratio.

AUDCAD Daily TF Bullish Set-upPrice is currently sitting on the demand level at daily time frame. Expecting price to move bullishly, but lower time frame confirmation set-up is still needed.

Audcad Audcad is on a down trend we hv price break and retest on the zone so we are expecting more bearish movements to de down side

BUY AUDCADAUDCAD will bounce higher towards 0,89818. A bullish flag is emerging on the 2H chart. Let us wait for a liquidity grab below the we buy.

AudcadAfter a bad loosing week looking to enter this audcad seeing it as a high probability setup expecting price to retrace back to de zone to create a left shoulder on the head and shoulder pattern that is forming on the 1h so when I see de retracment will take de trade

AUD/CAD LIVE TRADE STARTEDAUD/CAD – Short Position Taken
This one was on our watchlist earlier, and it just printed a clean engulfing candle trigger. Here’s what I look for before entering a VMS pullback trade:
A clear new high/low before the pullback
A clean pullback (no choppy mini-pullbacks inside)
Pullback into support/resistance zone
Price action at or near the 50 EMA
Engulfing candle in trend direction
Strong volume (trigger candle should stand out)
Momentum “hooking” in trend direction and below/above 0
We took a short position based on this alignment.
What do you think — continuation or reversal? Up or down from here?

AUDCAD SHORTMarket structure bearish on HTFs 3
Entry at both Weekly and Daily AOi
Weekly Rejection at AOi
Weekly Previous Structure Point
Weekly Rejection at AOi
Daily Rejection at AOi
Daily Previous Structure Point
Around Psychological Level 0.89500
H4 EMA retest
H4 Candlestick rejection
Rejection from Previous structure
Levels 4.17
Entry 120%
REMEMBER : Trading is a Game Of Probability
: Manage Your Risk
: Be Patient
: Every Moment Is Unique
: Rinse, Wash, Repeat!
: Christ is King.

121Hello awesome traders! 👋
Hope you’ve managed to grab some solid pips from the markets this week. As we head into the weekend, I’m wrapping things up by dropping a few clean chart setups for you to review and reflect on.
Enjoy the weekend, recharge well — and I’ll see you sharp and ready next week for more structure-led opportunities.
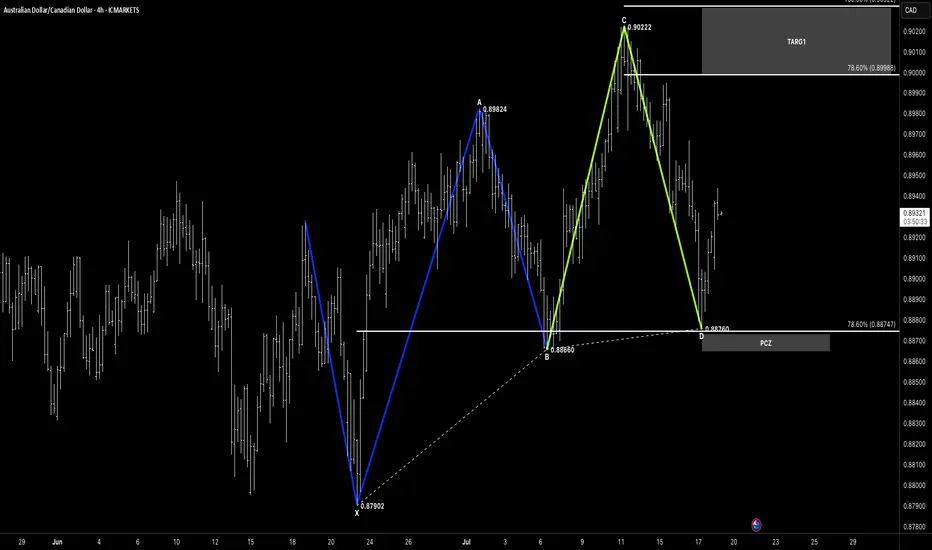
📌 Pattern Breakdown
This one's a 1-2-1 Bullish Formation — clear, clean, and already reacting:
🔹 XA: 0.87902 → 0.89824
🔹 AB retracement → 0.88660
🔹 BC extension: 0.88660 → 0.90222
🔹 CD drops into the PCZ at 0.88760 — aligning with 78.6% retracement
We’ve now seen a clear bullish reaction off the PCZ, confirming it as a valid demand zone.
🎯 Targets Now in Play
With structure holding and price climbing from the PCZ:
✅ Target 1:
• 78.6% = 0.89988
• 100% = 0.90322
🔄 Target 2 (Extension):
• 78.6% = 0.90584
• 100% = 0.91080
We’ll keep managing toward Target 1, then reassess momentum and candle structure for continuation into Target 2 next week.
🧠 Key Concepts in Play
✅ 121 Bullish pattern
✅ Reaction at fib-based PCZ
✅ Controlled impulse off demand zone
✅ Target structure mapped + invalidation clearly below PCZ
🗝 Final Thoughts
Textbook measured move off the 1-2-1 setup, with price now rotating higher from structure.
This is what we look for every week — precision, confirmation, and opportunity.
Let’s protect gains, lock partials near Target 1, and come back Monday with a clear head.
“Structure gives you the zone — reaction gives you the trade.”
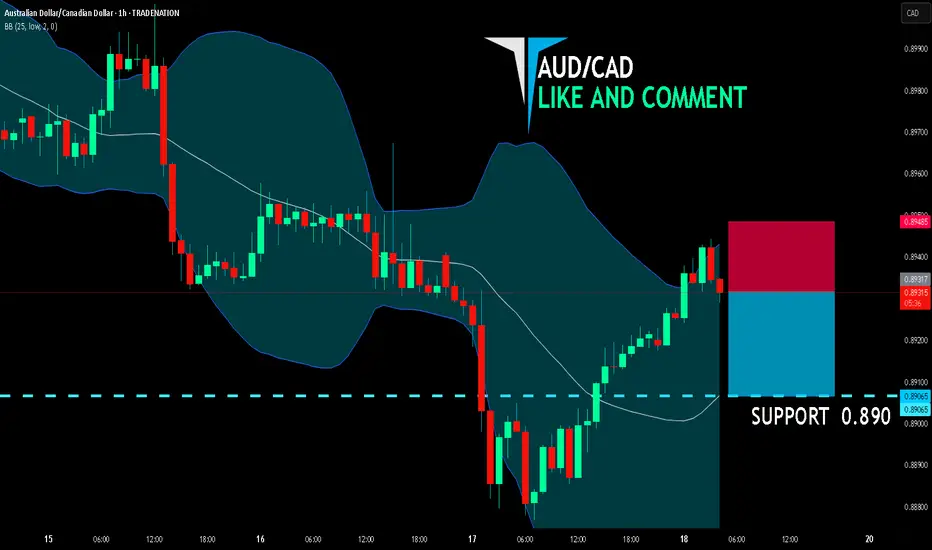
AUD/CAD BEARISH BIAS RIGHT NOW| SHORT
AUD/CAD SIGNAL
Trade Direction: short
Entry Level: 0.893
Target Level: 0.890
Stop Loss: 0.894
RISK PROFILE
Risk level: medium
Suggested risk: 1%
Timeframe: 1h
Disclosure: I am part of Trade Nation's Influencer program and receive a monthly fee for using their TradingView charts in my analysis.
✅LIKE AND COMMENT MY IDEAS✅