AudCad Trade IdeaYesterday I published a short set up for AC stating I wanted to see price break below a strong level of support with retest before looking to short the pair. I said If all goes well we could definitely expect price to tap back into 90400 or at least around that level. Price has been ranging between 91200 and 90400 so going short after a break of structure was my priority with price failing to break to the upside MULTIPLE times. We'll see how price plays out. Might be my last trade for the week with a bunch of news flooding because of the holiday being around the corner.
CADAUD trade ideas


#AUDCAD 4HAUDCAD 4-Hour Analysis
The AUDCAD pair is approaching the lower boundary of a well-defined channel on the 4-hour chart, which acts as a key support level. This support zone has historically triggered bullish reversals, but waiting for the price to touch the channel support ensures a more reliable entry point.
Technical Outlook:
- Pattern: Channel Support
- Forecast: Bullish (Wait for Support Touch, Then Buy)
- Entry Strategy: Buy near the channel support line after confirmation from price action.
Traders should look for bullish signals such as a reversal candlestick pattern (e.g., bullish engulfing) or indicators like RSI showing oversold conditions to validate the buy setup. Proper risk management is crucial, with stop-loss orders placed below the channel support to protect against potential breakdowns. Target the upper boundary of the channel as the next resistance level.

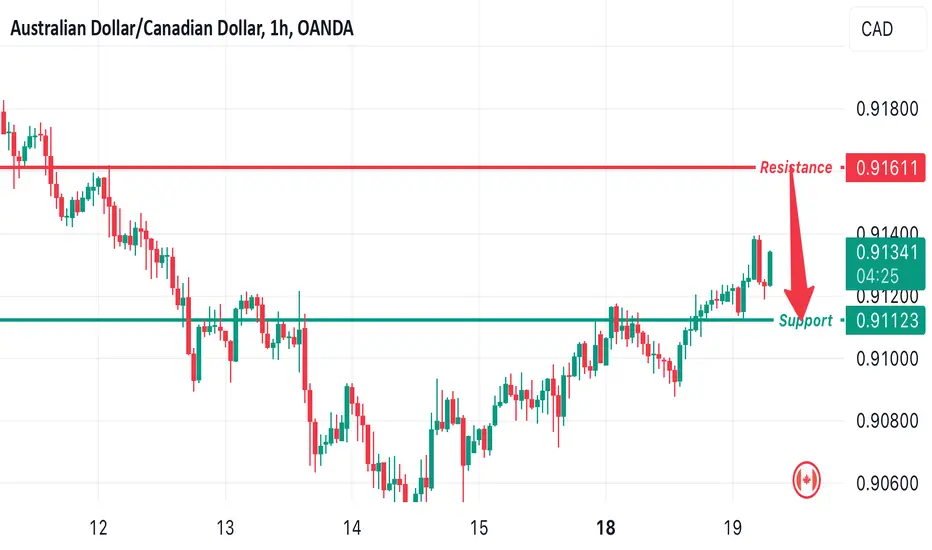
Bearish drop?AUD/CAD is reacting off the resistance level which is an overlap resistance and could drop from this level to our take profit.
Entry: 0.91125
Why we like it:
There is an overlap resistance level,
Stop loss: 0.91526
Why we like it:
There is a pullback resistance level that lines up with the 50% Fibonacci retracement.
Take profit: 0.90536
Why we like it:
There is an overlap support level.
Enjoying your TradingView experience? Review us!
Please be advised that the information presented on TradingView is provided to Vantage (‘Vantage Global Limited’, ‘we’) by a third-party provider (‘Everest Fortune Group’). Please be reminded that you are solely responsible for the trading decisions on your account. There is a very high degree of risk involved in trading. Any information and/or content is intended entirely for research, educational and informational purposes only and does not constitute investment or consultation advice or investment strategy. The information is not tailored to the investment needs of any specific person and therefore does not involve a consideration of any of the investment objectives, financial situation or needs of any viewer that may receive it. Kindly also note that past performance is not a reliable indicator of future results. Actual results may differ materially from those anticipated in forward-looking or past performance statements. We assume no liability as to the accuracy or completeness of any of the information and/or content provided herein and the Company cannot be held responsible for any omission, mistake nor for any loss or damage including without limitation to any loss of profit which may arise from reliance on any information supplied by Everest Fortune Group.

AUDCAD Superswing to 0.9400AUDCAD has been trading within an upward channel since September 2023. Currently, the price is near the bottom of the channel, reacting to the 0.618 Fibonacci level (drawn from the low of August 5th, a pivotal day for this pair).
The plan is to wait for a confirmation of a structural shift on the 4H chart, followed by a retest, and enter a long position around 0.9120. Partial profits will be taken progressively, with the final target set at 0.94.
Stay tuned for updates on my trade: entry, take-profit levels, and exit strategy.
See details on my signature to get in touch with me.
Good luck!

AudCad Trade IdeaAudCad has been bearish for some time now. Cad did have news at 8:30am so I do want to give price some time to dial down. Although there isn't much volatility showing. I personally want to see price break and retest to the downside with price being bearish on both higher and lower time frames. The lower time frame just flipped which is why you can see a bearish candle with a wick. The retest to the downside would be solid confirmations to short the pair for a potential 1:3rr. We'll see what happens.

Lingrid | AUDCAD short After REJECTION of the RESISTANCE zoneThe price perfectly fulfilled my last idea. It hit the target level. FX:AUDCAD is gradually pulling back toward the resistance zone and the upward trendline area. Overall, the market is making lower lows and lower closes on the 4H timeframe. After a significant bearish move, the price is currently positioned to retest the 50% retracement level of that decline. I anticipate that the market to reject the resistance zone and continue moving downward. My goal is support zone around 0.90700
Traders, if you liked this idea or if you have your own opinion about it, write in the comments. I will be glad 👩💻

AUDCAD POSSIBLE SELL OPPORTUNITY!!!Price is currently making a correction of the previous sell from the price of 0.91611 (resistance level) ahead of the CANADA INFLATION RATE REPORT. A sell opportunity is envisaged from that zone. Target is 0.91123
AUDCAD Buy ForecastAUDCAD New forecast👨💻👨💻
Note:
Follow proper risk management rules. Never risk more then 2% of your total capital. Money management is the key of success in this business...... Set your own SL & TP.
Please support this idea with a Like and COMMENT if you find it useful click "follow" on our profile if you will like these type of trading ideas delivered straight to your email in the future.
Thanks for your continued support!! lemme know your thoughts in the comment sec...

AUDCAD, Bullish ChannelBullish Channel
Rejection from Top
No divergence
Buy @ CMP or buy at Bottom of channel
Sl at Break of channel
TP towards 1:1

AUDCAD- BUY Bullish Indication
1- Series of HH and HL
2- market has shown Bullish divergence on 1H Time Frame
3- formation of Inverted Head and shoulder pattern
4- trend line support
5- Rejection from trend line with formation of Bullish engulfing candle at trend line support

Potential Bullish SetupO On AUDCADPotential long setup on AUDCAD on the breakout of last LH, with a divergence.

AUDCAD buy stopAUDCAD was making lower Highs and lower Lows, it was in down trend but now it formed RSI divergence. it has changed its trend. Now it is in up trend. So, We will place the buy stop order above the Latest HH

AUDCAD Possible Long.Pair looking to give us an inverted head and shoulder. Be on the lookout and enter buys only if you see a setup that falls in your plan.

AUDCADall AUD pairs are making similar patterns tonight, however this slow correction and pulling back to the down side give me a good opportunity for short position

AUD/CAD new idea for new weekI expect more buys in this market for the new week as global buy flow is coming our current trade entry is nice but I would advise you to take less risk as it is a zone with buyer reversal power

AUDCADAUDCAD is on a strong down trend. i see a slow correction in 1hr time frame which has touched a supply zone. Not super confident, but I think a short position can be opened at this very spot for a tp2

AUD/CAD SHIFT FROM 1 HOURAs we can see from 1 hour time frme there is market shift happen after break our last supply zone,in 30 min we may have an entry there so keep monitoring from there.

Idea for next week.The AUD/CAD pair has shown an upward movement on the four-hour chart, driven by a mix of market factors. Despite weak economic data from China, which weighs on the Australian dollar, recent gains have been supported by speculation around the Bank of Canada accelerating its rate cuts. The dovish stance from the Bank of Canada’s governor, coupled with falling oil prices, has weakened the Canadian dollar (CAD), giving the Australian dollar (AUD) room to strengthen.
The pressure on CAD is compounded by concerns over lower oil demand, particularly in light of the global economic slowdown. Meanwhile, AUD continues to face challenges due to its strong correlation with Chinese economic performance, although it has managed to outperform CAD in the short term.

AUDCAD LONG 0.937500 SOON!!FRIENDS..
We expect AUDCAD goin to reach 0.937500 soon cad will be weak and aud will try goin up
the bounce from lower channel will provide enough power to go up..
5 times and still cant break..
just try to find good entry for long with confirmation use minimum of 1h timeframe for a good confirmation
goodluck
remember to DYOR before opening position

AUDCAD SELLS- price seems more to be pulling towards sell side.
- I want that daily FVG for my sells. my sells bias will be violented if we close above that daily FVG.
- I always look for my entries during Killzones. for this pair it has to be between London session or Asian session.
- Risk management is always advised.
Good Luck

How to Calculate Unit Sizes or Lot SizesJust a quick video on determining your unit sizes for any account you may have.

Reacting to Reddit Comments on My Sentiment Strategy!In this video, I dive into Reddit comments and questions about my Sentiment Trading Strategy! From insightful feedback to controversial takes, watch as I react and respond to the community's thoughts and concerns. I’ll address some common misconceptions, provide clarifications, and discuss how the strategy stands up to scrutiny.
📌 What to Expect:
✅ Honest reactions to popular Reddit opinions
✅ Detailed explanations and breakdowns of the sentiment strategy
✅ Tips based on questions from the trading community
✅ Engaging commentary on the state of sentiment trading
👉 Got your own questions or comments? Drop them below, and I might feature them in a future video!
🚨 Disclaimer:
Trading Forex and other financial instruments involves significant risk and may not be suitable for all investors. The content in this video is for educational and entertainment purposes only and does not constitute financial advice. Always consult with a financial professional before making any trading decisions.
