Price action Audcad hide it's liquidity sweep well took sometime to spot in on a 1hrs chart as clear as day light
CADAUD trade ideas

AUDCAD SHORTMarket structure bearish on HTFs 3
Entry at Daily AOi
Weekly Rejection at AOi
Daily Rejectioon at AOi
Daily EMA retest
Previous Structure point Daily
Around Psychological Level 0.89000
H4 EMA retest
H4 Candlestick rejection
Rejection from Previous structure
Levels 4.15
Entry 105%
REMEMBER : Trading is a Game Of Probability
: Manage Your Risk
: Be Patient
: Every Moment Is Unique
: Rinse, Wash, Repeat!
: Christ is King.

AUDCADAUD/CAD Analysis: 10-Year Bond Yields, Interest Rate Differentials, UIP, and Carry Trade
1. Current Bond Yields and Interest Rate Differentials
Australia 10-Year Bond Yield: 4.28% (as of June 4, 2025) .
Canada 10-Year Bond Yield: 3.20% (as of May 30, 2025) .
Yield Spread:
4.28% (AUD)−3.20% (CAD)=+1.08%
Australia’s higher bond yield provides a carry advantage for AUD.
Policy Rate Differential:
RBA Rate: 3.85% (cut by 25bps in May 2025) .
BoC Rate: 2.75% (held steady in April 2025) .
Rate Spread:
3.85% (AUD)−2.75% (CAD)=+1.10%
2. Uncovered Interest Rate Parity (UIP)
Theory: The AUD should depreciate against CAD to offset the +1.10% rate spread, eliminating arbitrage opportunities.
Reality: UIP often fails due to risk premiums and market dynamics. Despite Australia’s higher rates, AUD/CAD may remain supported if investors prioritize yield over currency depreciation risks.
3. Carry Trade Dynamics
Mechanics: Borrow CAD (lower rate) to invest in AUD assets (higher yield), profiting from the +1.08% yield spread.
Current Viability:
Opportunity: The yield spread and rate differential favor AUD, making the carry trade attractive.
Risks:
AUD Depreciation: If UIP holds, AUD could weaken, eroding carry profits.
Global Uncertainty: US tariff tensions (cited in RBA’s May 2025 decision ) may increase AUD volatility.
BoC Policy: Canada’s cautious stance on tariffs and stable rates supports CAD stability.
4. Key Economic Context
Australia: Recent RBA rate cuts (to 3.85%) reflect concerns over global trade risks but maintain a yield advantage over Canada.
Canada: BoC held rates at 2.75% in April 2025, citing tariff-related uncertainties but projecting stable inflation near 2% .
Summary Table
Metric Australia (AUD) Canada (CAD)
10-Year Bond Yield 4.28% 3.20%
Policy Rate 3.85% 2.75%
Yield/Rate Spread +1.08% (bond), +1.10% (policy) —
Carry Trade Bias Bullish for AUD Bearish for CAD
Key Risks Global trade tensions, RBA dovishness BoC tariff caution, stable inflation
Conclusion
AUD/CAD Outlook: Moderately bullish for AUD due to yield and rate advantages, but UIP suggests potential AUD depreciation.
Carry Trade: Profitable if AUD stability persists, but monitor tariff developments and BoC policy shifts.
Trade Strategy: Favor AUD longs on dips
#AUDCAD #CAD #AUD

AUDCAD 4H Short Setup📘 Educational Caption for Your Trading Chat
🟥 AUDCAD 4H Short Setup (Smart Money Strategy)
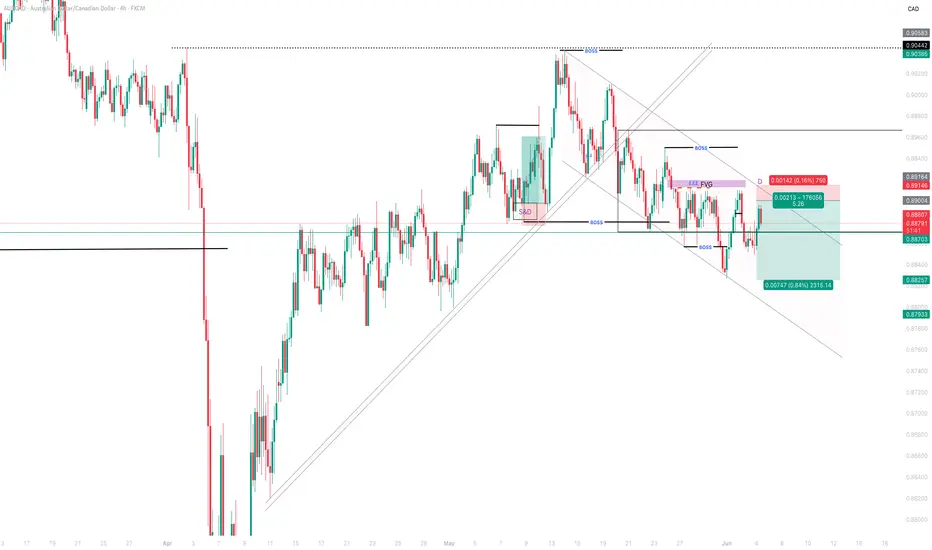
I’ve taken a short position on AUDCAD from the 0.89005 level after spotting a bearish Break of Structure (BOS), price retracement into a Fair Value Gap (FVG), and mitigation of a supply zone.
📉 Entry: 0.89005
🎯 Target: 0.88266
🛡️ Stop Loss: 0.89150
⚖️ Risk-Reward: ~1:2.7 — clean asymmetric setup
This trade aligns with Smart Money Concepts (SMC) — price broke structure, retraced into imbalance, and showed a rejection from premium pricing. We’re potentially seeing the start of a bearish continuation within the current descending channel.
🔔 Note: Patience and risk management are crucial. Let the market do the work once the setup is in motion.
⚠️ Disclaimer: This setup is shared strictly for educational purposes. Always conduct your own analysis and manage your risk appropriately.

Bearish drop?AUD/CAD has rejected off the pivot and could drop to the 1st support.
Pivot: 0.89082
1st Support: 0.87895
1st Resistance: 0.89646
Risk Warning:
Trading Forex and CFDs carries a high level of risk to your capital and you should only trade with money you can afford to lose. Trading Forex and CFDs may not be suitable for all investors, so please ensure that you fully understand the risks involved and seek independent advice if necessary.
Disclaimer:
The above opinions given constitute general market commentary, and do not constitute the opinion or advice of IC Markets or any form of personal or investment advice.
Any opinions, news, research, analyses, prices, other information, or links to third-party sites contained on this website are provided on an "as-is" basis, are intended only to be informative, is not an advice nor a recommendation, nor research, or a record of our trading prices, or an offer of, or solicitation for a transaction in any financial instrument and thus should not be treated as such. The information provided does not involve any specific investment objectives, financial situation and needs of any specific person who may receive it. Please be aware, that past performance is not a reliable indicator of future performance and/or results. Past Performance or Forward-looking scenarios based upon the reasonable beliefs of the third-party provider are not a guarantee of future performance. Actual results may differ materially from those anticipated in forward-looking or past performance statements. IC Markets makes no representation or warranty and assumes no liability as to the accuracy or completeness of the information provided, nor any loss arising from any investment based on a recommendation, forecast or any information supplied by any third-party.

AUDCAD BullishAfter a bearish pullback, the market undergoes a structural change and launches its first impulse. This could be the start of an uptrend on H4.

AUDCAD TRADING IN A BEARISH TRENDAUDCAD TRADING IN A BEARISH TREND.
Expected to continue downtrend in upcoming sessions.
AUDCAD shows high intensity of sellers.
Price may drop down to level of 0.88100 in upcoming sessions.
On higher side 0.89100 is the key resistance level.

DAILY HOT PICK ! AUDCAD SHORT FORECAST Q2 W23 D3 Y25AUDCAD SHORT FORECAST Q2 W23 D3 Y25
🔥🔥DAILY HOT PICK !!!!!! 🎯🎯
Professional Risk Managers👋
Welcome back to another FRGNT chart update📈
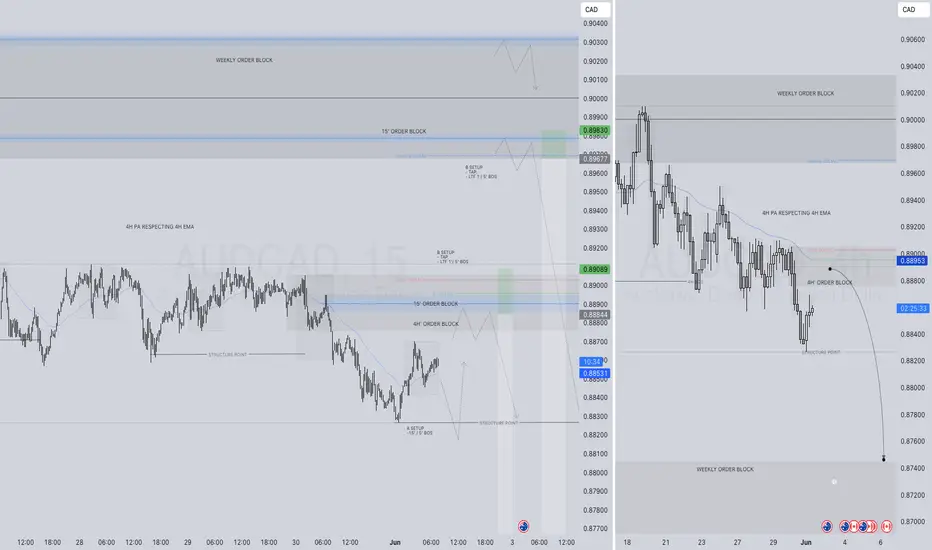
Diving into some Forex setups using predominantly higher time frame order blocks alongside intraday confirmation breaks of structure.
💡Here are some trade confluences📝
✅Daily 50 EMA
✅Weekly order block rejection
✅Daily order block rejection
✅15’ order block identification
🔑 Remember, to participate in trading comes always with a degree of risk, therefore as professional risk managers it remains vital that we stick to our risk management plan as well as our trading strategies.
📈The rest, we leave to the balance of probabilities.
💡Fail to plan. Plan to fail.
🏆It has always been that simple.
❤️Good luck with your trading journey, I shall see you at the very top.
🎯Trade consistent, FRGNT X

AUDCAD | Double Top RejectionThe double top rejection mentioned in the last post. We can see that price topped out at 0.90 and is now retesting the breakout from the last swing low.

AUDCAD | HnS Pattern | 500pips DownPrice action has continued selling off after retesting the previous breakout below the neckline and will be looking to hit another 500pips+
When looking at local price action on lower timeframes the double top rejection at ~0.90 has entered a distribution phase which is signaling price to fall further with the first target at 0.88 and so on.
For price to hit the last target around 0.855 I would like to see a break first then a retest/distribution phase.

AUDCAD SELL/SHORTBy utilizing levels, historical patterns, , we can formulate a hypothesis that the market might follow a similar trajectory if bearish sentiment prevails.

AUDCAD: Will Start Falling! Here is Why:
Our strategy, polished by years of trial and error has helped us identify what seems to be a great trading opportunity and we are here to share it with you as the time is ripe for us to sell AUDCAD.
Disclosure: I am part of Trade Nation's Influencer program and receive a monthly fee for using their TradingView charts in my analysis.
❤️ Please, support our work with like & comment! ❤️

AudCad Trade IdeaWith AudCad respecting a major level of resistance and flipping structures on the 4hr time frame I'll personally be looking to short the pair. If price can break below and retest on the smaller time frame I'll short the pair for a 1:3rr. At that point the smaller time frames would be in sync with the higher time frames overall bearish move. We'll see how price moves.
AUDCAD shortAUDCAD is currently travelling down this channel, look for sell at the touch to the channel line...

AUDCAD Expecting Bearish TrendAUDCAD is currently trading within a defined range and appears to be heading towards a key support level. While the pair is moving lower, further downside may be limited if the Canadian Dollar continues to strengthen. This could lead to a price rebound from the current levels.
The currency pair is approaching a consolidation support zone, and we may observe some price volatility near this level. If a bounce occurs, initial resistance levels to watch are at 0.88800 and 0.89200.
You may find more details in the chart Ps Support with like and comments for more analysis.

AUDCAD SHORT FORECAST Q2 W23 D2 Y25AUDCAD SHORT FORECAST Q2 W23 D2 Y25
Professional Risk Managers👋
Welcome back to another FRGNT chart update📈
Diving into some Forex setups using predominantly higher time frame order blocks alongside intraday confirmation breaks of structure.
💡Here are some trade confluences📝
✅Daily 50 EMA
✅Weekly order block rejection
✅Daily order block rejection
✅15’ order block identification
🔑 Remember, to participate in trading comes always with a degree of risk, therefore as professional risk managers it remains vital that we stick to our risk management plan as well as our trading strategies.
📈The rest, we leave to the balance of probabilities.
💡Fail to plan. Plan to fail.
🏆It has always been that simple.
❤️Good luck with your trading journey, I shall see you at the very top.
🎯Trade consistent, FRGNT X
AUD/CAD 4-Hour Technical & Fundamental AnalysisAUD/CAD 4-Hour Technical & Fundamental Analysis
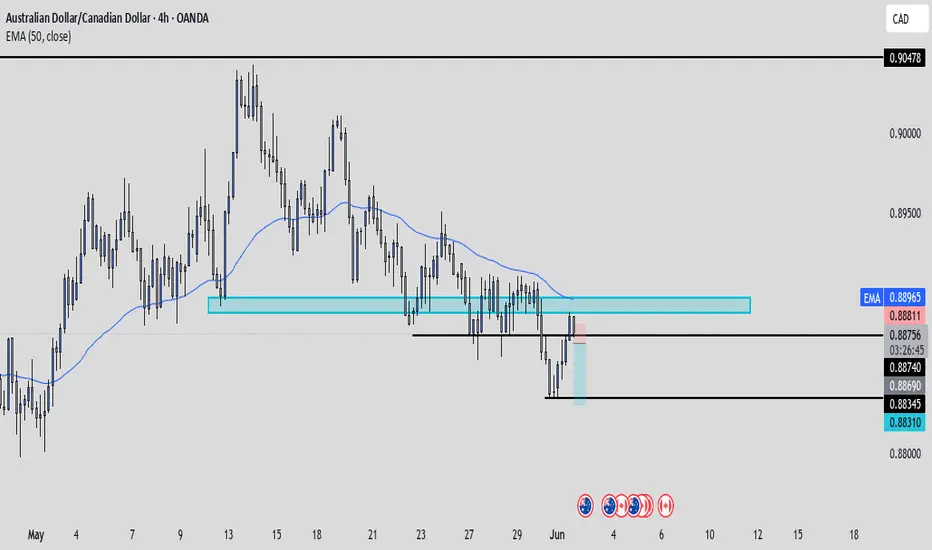
AUD/CAD has broken decisively below key support, now trading with a bearish tone as both technical and fundamental factors align against the Australian Dollar. The 4-hour chart shows a clear downtrend structure, characterized by Lower Highs and Lower Lows, with smart money behavior unfolding near key liquidity levels.
After breaching a significant support zone, price entered an accumulation phase — consolidating beneath the break, suggesting preparation for the next move. A liquidity hunt above recent highs appears likely, creating a potential sell opportunity as price seeks out inefficient zones before resuming its downward trajectory.
If price taps into our liquidity zone and reacts with bearish confirmation, we could see continuation to the downside with solid risk-reward potential.
📊 Trade Setup
📍 Area of Interest (AOI): 0.88580 (Sell Limit)
🛡 Stop-Loss: 0.88880 (Above liquidity zone)
🎯 Take Profit: 0.87860 (Next key support / 1:2.3 RR)
This setup aligns with institutional flow — targeting areas where smart money enters the market and providing a clear technical roadmap for trend continuation.
📰 Fundamental Outlook
🇦🇺 AUD Weakness vs 🇨🇦 CAD Strength
Australian Dollar Under Pressure
Soft economic data and declining business confidence are limiting AUD upside.
The Reserve Bank of Australia (RBA) is signaling a more cautious policy stance, reducing expectations of future rate hikes.
Canadian Dollar Strengthening
Rising oil prices — a key export for Canada — are supporting CAD.
The Bank of Canada (BoC) has leaned slightly more hawkish, keeping the door open for further tightening if inflation persists.
Summary:
AUD/CAD remains tilted to the downside, with both macroeconomic and technical indicators favoring bearish momentum. Watch for price action near our AOI to validate the trade.
📌 Disclaimer:
This is not financial advice. Always wait for proper confirmation before executing trades. Manage risk wisely and trade what you see—not what you feel.

AUD_CAD BULLISH BIAS|LONG|
✅AUD_CAD is approaching a demand level around 0.8800
So according to our strategy
We will be looking for the signs of the reversal in the trend
To jump onto the bullish bandwagon just on time to get the best
Risk reward ratio for us
LONG🚀
✅Like and subscribe to never miss a new idea!✅
Disclosure: I am part of Trade Nation's Influencer program and receive a monthly fee for using their TradingView charts in my analysis.

CHECK AUDCAD SELL SIGNAL READ CAPTAIN(AUDCAD) trading signals technical analysis satup👇🏼
( AUDCAD ) sell zone
( TRADE SATUP)
ENTRY POINT (0.88310) to (0.88270) 📊
FIRST TP (0.88180)📊
2ND TARGET (0.88110) 📊
LAST TARGET (0.88000) 📊
STOP LOOS (0.89400)❌
Tachincal analysis satup
Fallow risk management

Bearish ContinuationPrice is breaking down after a period of consolidation, suggesting the start of a new bearish impulse.
This setup aligns with a 2-leg correction structure, where the second leg to the downside is expected to unfold.
📉 Trade Idea:
Looking for a short opportunity after a potential minor pullback.
Targeting the next support zone around 0.8700.
Structure: Bearish
Pattern: Impulse - Correction - Impulse (2-leg move)

AUDCAD SHORTMarket structure bearish on HTFs DW
Entry at Both Daily and Weekly AOi
Weekly Rejection at AOi
Previous Structure point Weekly
Daily Rejection at AOi
Previous Structure point Daily
Around Psychological Level 0.89500
H4 EMA retest
H4 Candlestick rejection
Levels 5.54
Entry 100%
REMEMBER : Trading is a Game Of Probability
: Manage Your Risk
: Be Patient
: Every Moment Is Unique
: Rinse, Wash, Repeat!
: Christ is King.

AUDCAD On The Rise! BUY!
My dear followers,
I analysed this chart on AUDCAD and concluded the following:
The market is trading on 0.8864 pivot level.
Bias - Bullish
Technical Indicators: Both Super Trend & Pivot HL indicate a highly probable Bullish continuation.
Target - 0.8903
Safe Stop Loss - 0.8843
About Used Indicators:
A super-trend indicator is plotted on either above or below the closing price to signal a buy or sell. The indicator changes color, based on whether or not you should be buying. If the super-trend indicator moves below the closing price, the indicator turns green, and it signals an entry point or points to buy.
Disclosure: I am part of Trade Nation's Influencer program and receive a monthly fee for using their TradingView charts in my analysis.
———————————
WISH YOU ALL LUCK
