CADCHF Bullish Reversal in Motion Channel Break & Momentum ShiftCADCHF setup is developing into a potential bullish recovery after a breakout from a falling wedge. I’m looking for signs of buyer control as price attempts to build higher structure off the recent breakout.
📊 Technical View (My Setup Insight):
Falling Wedge Breakout: Price has cleanly broken out of the descending channel/wedge formation. That’s often a reversal signal, especially near support zones.
Support Holding: The pair found buyers around 0.5810–0.5820, an area tested multiple times in July. This zone has acted as a soft base.
Bullish Flag Recovery: Prior corrective patterns (flags/pennants) were followed by strong impulsive moves, and we may be repeating this pattern now.
Next Targets:
TP1: 0.5843 – aligns with previous structure and minor resistance.
TP2: 0.5862 – near the most recent high and top of consolidation.
Stop-Loss: Below 0.5800 to invalidate the reversal structure.
🧮 Fundamental Drivers (My Outlook):
CAD Support from Oil Stability: Oil prices have firmed around $78–$80, which helps the CAD via improved trade and energy revenue prospects.
SNB Stance Neutral-Dovish: Swiss inflation remains soft, and SNB has signaled comfort with its current policy rate, reducing CHF bullish pressure.
BoC Hawkish Bias: Despite softening Canadian CPI, the BoC remains cautious and hasn’t ruled out future hikes. CAD remains supported relative to CHF.
Global Risk Mood: CHF is sensitive to risk-off flows. With equities and commodities rebounding modestly, safe haven flows into CHF may slow.
⚠️ Risks to the Setup:
A sudden drop in oil prices could hurt CAD.
Risk-off sentiment due to geopolitical tensions or US equity selloffs could fuel CHF strength.
Any surprise SNB jawboning about FX could cause CHF to spike.
📆 Upcoming Events to Monitor:
Canadian GDP / Retail Sales – if strong, reinforces CAD recovery.
Swiss KOF Economic Barometer – gives insight into CHF macro tone.
Oil Inventories – strong builds or drawdowns influence CAD indirectly.
🔁 Leader/Lagger Context:
CADCHF is often a lagger, especially when risk sentiment or oil makes bigger moves. It can follow USDCHF or USDCAD behavior due to shared components.
If oil or global risk sentiment shifts, CADCHF tends to react with a small lag, making it great for secondary confirmation trades.
🧩 Summary – Bias & Watchpoints:
I currently hold a bullish bias on CADCHF following the falling wedge breakout and support defense. Fundamentals are moderately in favor of CAD due to oil stability and BoC’s cautious stance versus the more passive SNB. Key risks include any renewed CHF demand from risk-off shifts or soft Canadian economic surprises. The most critical levels now lie at 0.5843 and 0.5862 for upside targets, while 0.5800 remains key invalidation support.
CADCHF trade ideas
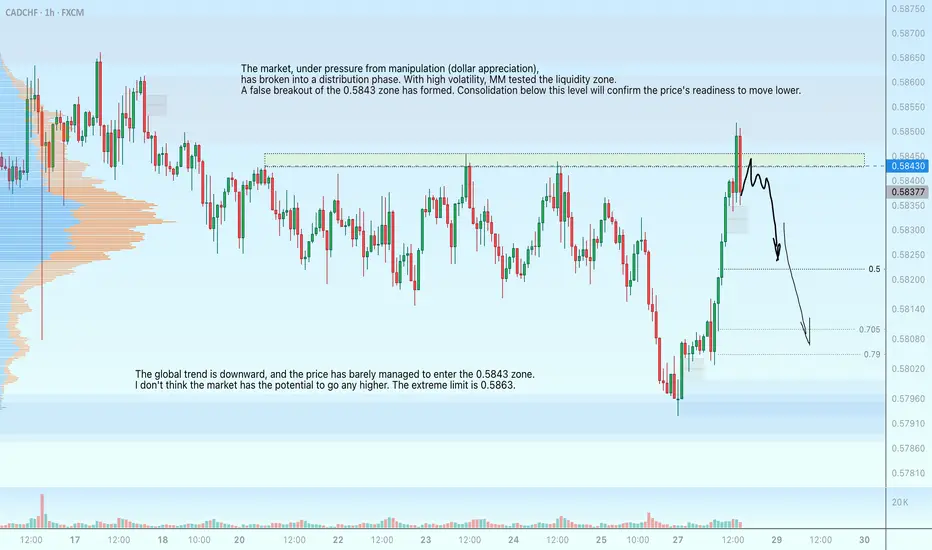
CADCHF - manipulative liquidity grab at 0.5843 before the dropThe market, under pressure from manipulation (dollar appreciation), has entered a distribution phase. Amid high volatility, MM tested the liquidity zone. A false breakout of the 0.5843 zone has formed. Consolidation below this level will confirm the price's readiness to move lower.
The global trend is downward, and the price has barely managed to enter the 0.5843 zone. I don't think the market has the potential to go any higher. The extreme limit is 0.5863.
CADCHF - Sellers still in controlCADCHF has been moving within a reversal structure which could make another swing low to complete this pattern before the next move up.
Good Luck
CAD-CHF Local Rebound Ahead! Buy!
Hello,Traders!
CAD-CHF made a retest
Of the horizontal support
At 0.5797 from where we
Are already seeing a bullish
Reaction so we will be
Expecting a further local
Bullish move up
Buy!
Comment and subscribe to help us grow!
Check out other forecasts below too!
Disclosure: I am part of Trade Nation's Influencer program and receive a monthly fee for using their TradingView charts in my analysis.

SELL CADCHF now for 4h time frame bearish trend continuationSELL CADCHF now for 4h time frame bearish trend continuation
SELL CADCHF now for a four hour time frame bearish trend continuation..........
STOP LOSS: 0.5845
This sell trade setup is based on hidden bearish divergence trend continuation trading pattern...
Always remember, the trend is your friend, so whenever you can get a signal that the trend will continue, then good for you to be part of it
TAKE PROFIT : take profit will be when the trend comes to an end, feel from to send me a direct DM if you have any question about take profit or anything.
Remember to risk only what you are comfortable with….....trading with the trend, patient and good risk management is the key to success here

CADCHF POSSIBLE BUY OPPORTUNITY FROM THE CURRENT PRICE!There’s a possible buy opportunity from the current price as we saw a rebound from the daily timeframe low of 0.57896 multiple times. I anticipate buyers to dominate the market
CAD/CHF Falling Toward 0.5740–0.5720: Buyers May Step In1. Trend Direction :
CADCHF is currently bearish — the price is going down consistently.
2. Price Action :
The pair is still falling and has not shown signs of reversing yet.
3. Target Area for Drop :
I expect the price to continue falling toward the 0.5740 to 0.5720 zone.
→ This is a support area, where price may slow down or bounce.
4. Support Level Importance :
This zone has acted as support in the past, meaning buyers might step in again here.
5. Buy Interest Zone :
If the price holds above 0.5720 and shows signs of strength, buying interest could return.
6. Possible Reversal :
From this support zone, there's a chance that CAD/CHF may reverse and move back up.
7. What to Watch For :
Look for bullish price action (like strong candles or a break of minor resistance) in the support area before considering long (buy) positions.

CADCHF: Market of Sellers
The recent price action on the CADCHF pair was keeping me on the fence, however, my bias is slowly but surely changing into the bearish one and I think we will see the price go down.
Disclosure: I am part of Trade Nation's Influencer program and receive a monthly fee for using their TradingView charts in my analysis.
❤️ Please, support our work with like & comment! ❤️


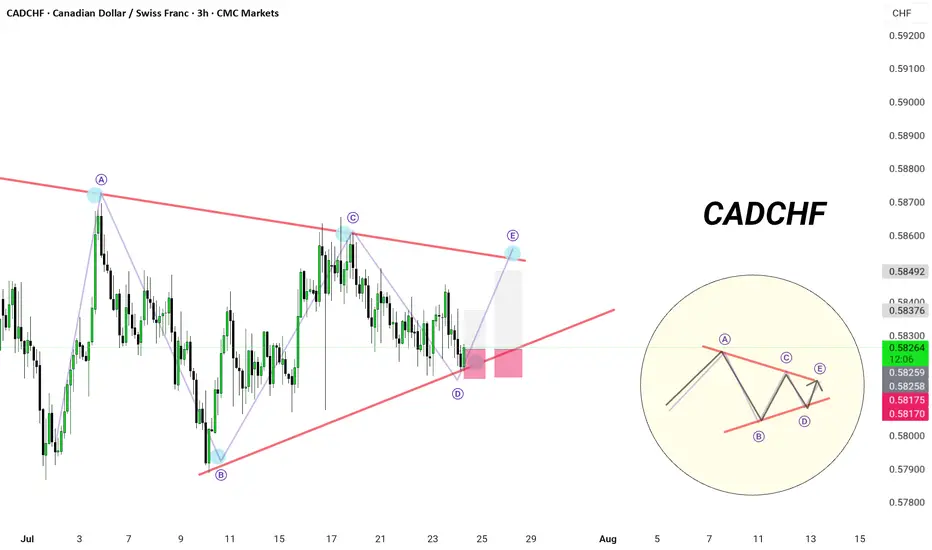
Close to breaking out of the range.After nearly 31 days, a consolidation has formed within the range, which could signal either a buy or sell opportunity.
CADCHF | 3H Chart |
🎯 Triangle Tightens — Precision Required
In true Monaco fashion — elegance meets precision.
🟪 Pattern: Contracting Triangle (ABCDE)
⚙️ Price perfectly respecting dynamic structure
📍Currently printing leg D → E with bullish momentum from the base trendline
🎯 Anticipated move towards 0.5849 resistance zone
🧠 Playbook Setup:
📈 Long from 0.5817–0.5820
🎯 Target: 0.5837–0.5849
🛑 Invalidation: Close below 0.5817
🚧 Wave E = decision point
Breakout or reversal? Play the retest like a gentleman.
📊 Bias: Short-term bullish to complete the structure — then react, not predict.
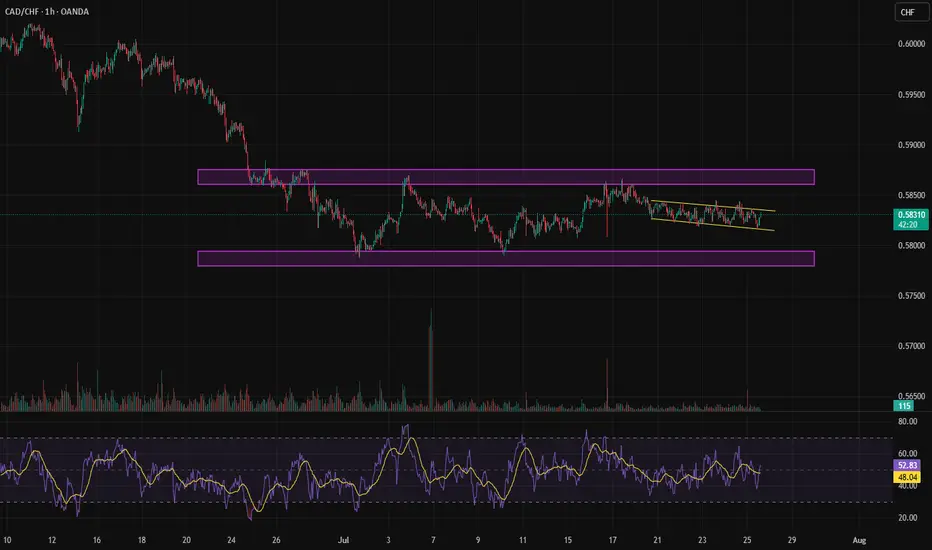
CADCHF: Bearish Outlook Explained 🇨🇦🇨🇭
CADCHF completed an intraday consolidation within a horizontal
parallel channel.
Its support was broken on Friday and we see a positive bearish
reaction to that after its retest.
With a high probability, the price will drop to 0.582 level soon.
❤️Please, support my work with like, thank you!❤️
I am part of Trade Nation's Influencer program and receive a monthly fee for using their TradingView charts in my analysis.
Oh CANDADA!🇨🇦A simple idea, which I will gradually fill with life:
Act 1:
-> the 🇨🇦CAD comes to life.
📊🔮🇺🇲 US retail sales, which will be published today at 2:30 pm, will be higher than expected by the consensus.
Further acts and updates will be follow✅️

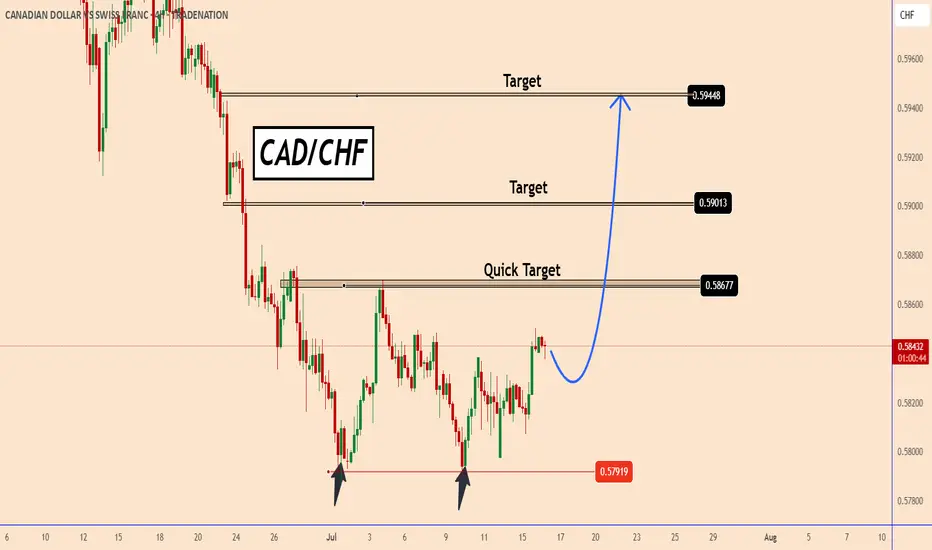
CADCHF found strong support zone near 0.5790CADCHF found a strong support zone near 0.5790
The chances are that the price already completed a doubt bottom pattern. It is not confirmed yet but the support zone is already too strong.
The price may face a strong resistance near the first target 0.5870 that is also the strongest target. Once the price moves above that zone it should rise further to the other targets near 0.5900 and 0.5945
You may find more details in the chart!
Thank you and Good Luck!
PS: Please support with a like or comment if you find this analysis useful for your trading day
Disclosure: I am part of Trade Nation's Influencer program and receive a monthly fee for using their TradingView charts in my analysis.
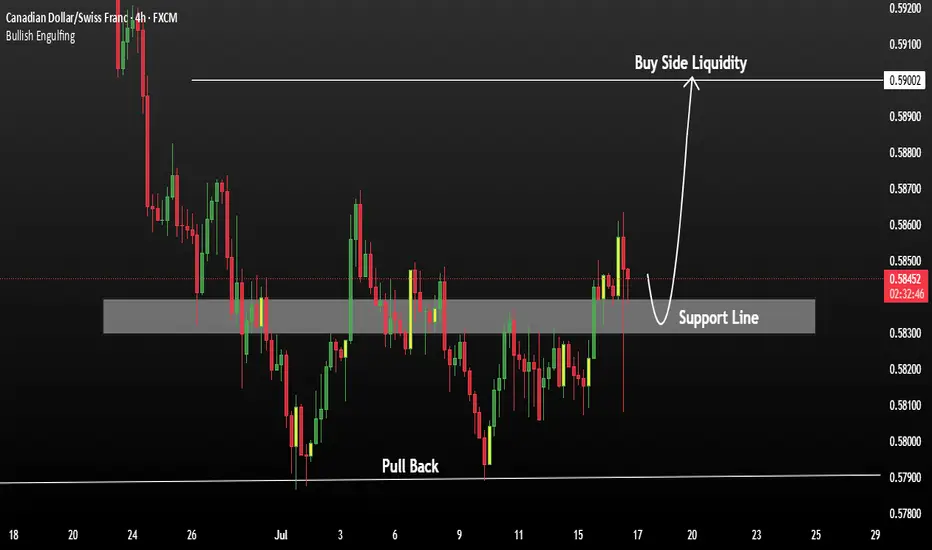
CADCHF Buying Opportunity after Strong Support CADCHF is currently respecting a strong support zone, indicating a potential bullish reversal pattern in development. The structure suggests that most of the downward pressure may be exhausted, and buyers could begin to take control.
Price action shows signs of completing a doubt/uncertainty pattern, reinforcing the base formed at support. A strong resistance level lies near 0.59002. If the 4H candle closes above this level, it may confirm a breakout and open the door for further bullish momentum.
You May find more details in the chart.
Trade wisely best of Luck Buddies.
PS: Support with like and comments for better analysis.
CAD/CHF 4H Bullish Reversal Setup The pair has formed a double bottom pattern around the 0.5800 level (highlighted by the blue arrows), indicating strong support and a potential bullish reversal.
Price has broken the short-term bearish trendline and is now retracing slightly, possibly to retest the breakout zone or neckline of the double bottom.
Ichimoku Cloud is thinning, suggesting weakening bearish momentum and potential for a bullish breakout.
Key Resistance Levels:
First Target (TP1): 0.5884
Second Target (TP2): 0.5942
Current Price: 0.5852
A successful retest and bounce from the neckline area (around 0.5830–0.5840) could lead to a move toward the mentioned targets.
Conclusion:
As long as the 0.5800 support holds, CAD/CHF shows a bullish reversal potential toward 0.5884 and 0.…

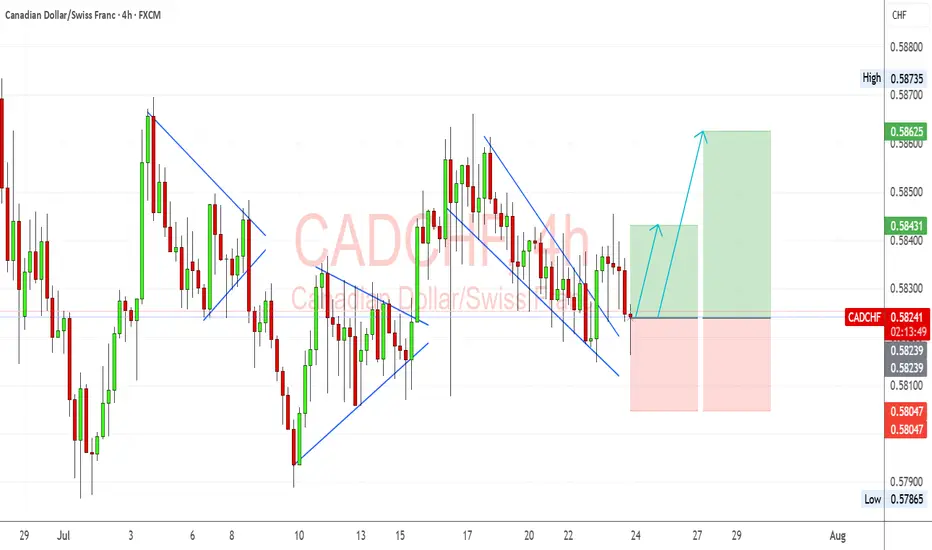
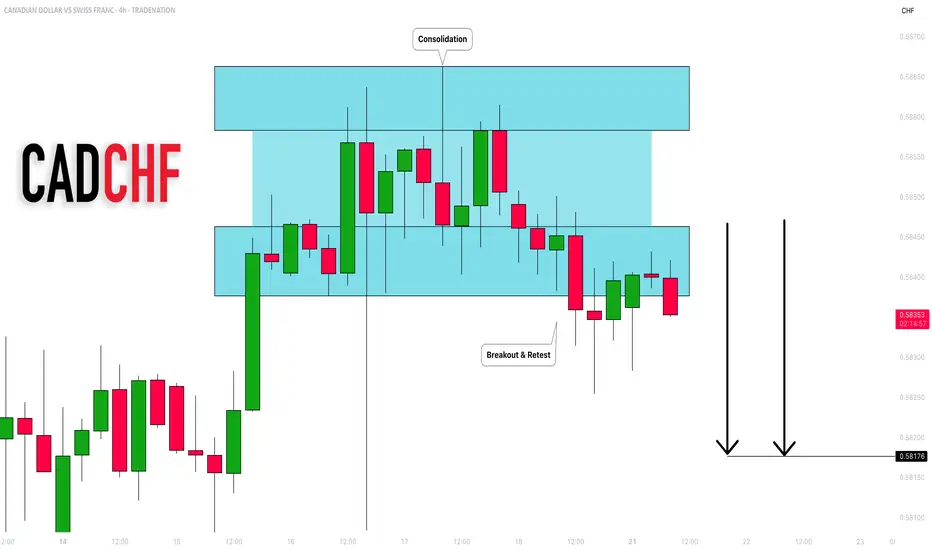
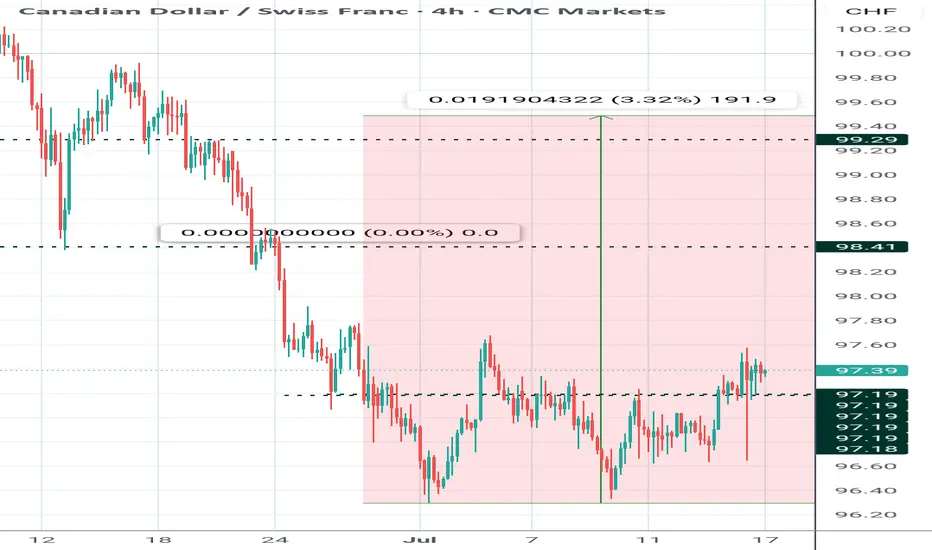
CAD/CHF 4H Technical and Fundamental AnalysisCAD/CHF 4H Technical and Fundamental Analysis
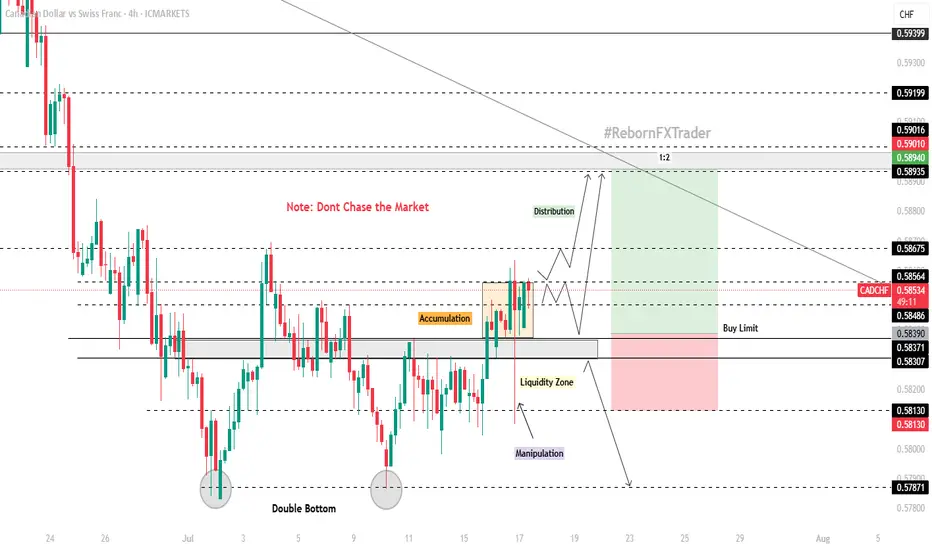
CAD/CHF has shown bullish potential this week, supported by strengthening fundamentals and a technical breakout. From a macro perspective, the Canadian dollar (CAD) continues to benefit from rising crude oil prices, a key Canadian export. With WTI crude trading above $80 per barrel, the commodity-backed CAD gains further momentum. Meanwhile, the Swiss franc (CHF)—often viewed as a safe haven—is seeing mild outflows as risk appetite improves globally and capital shifts toward higher-yielding assets.
From a central bank standpoint, the Bank of Canada (BoC) has struck a cautiously optimistic tone regarding inflation, while the Swiss National Bank (SNB) has already begun cutting interest rates—creating a divergent policy path that favors CAD strength against CHF.
On the technical side, CAD/CHF recently found strong support in the 0.57800–0.58100 zone, where price formed a potential double bottom pattern just below key resistance—a signal often associated with bullish reversal. A minor key level at 0.58300 was broken, followed by a clear accumulation phase. After consolidation, price grabbed liquidity with a long wick but closed above the key level, forming a bullish engulfing candle, suggesting strong buying pressure.
We now await a retracement into our zone of interest to position long entries with favorable risk-reward.
📍 Buy Setup:
Entry: Buy Limit at 0.58390
Stop Loss: 0.58130 (below liquidity grab)
Take Profit: 0.58940 (next key resistance)
📌 Disclaimer:
This is not financial advice. Always wait for proper confirmation before executing trades. Manage risk wisely and trade what you see—not what you feel.
CADCHF Sellers In Panic! BUY!
My dear friends,
CADCHF looks like it will make a good move, and here are the details:
The market is trading on 0.5811 pivot level.
Bias - Bullish
Technical Indicators: Supper Trend generates a clear long signal while Pivot Point HL is currently determining the overall Bullish trend of the market.
Goal - 0.5831
About Used Indicators:
Pivot points are a great way to identify areas of support and resistance, but they work best when combined with other kinds of technical analysis
Disclosure: I am part of Trade Nation's Influencer program and receive a monthly fee for using their TradingView charts in my analysis.
———————————
WISH YOU ALL LUCK

CADCHF bullish expectations for next period
OANDA:CADCHF interesting chart, bearish trend last 5M, i am have bullish expectations on 10.June, but price is make one more strong bearish push.
Currently nice structure created, price pushing bullish, from here expectations are bullish trend to see.
SUP zone: 0.58050
RES zone: 0.59000, 0.59450

CADCHF sell trade taken to continue the downtrendCADCHF has been in a nice downtrend for a while now.
Once I saw that price bounced off the 20 EMA, I entered into a sell trade.
I've marked my entry, SL and TP.
Let's see how this trade plays out.
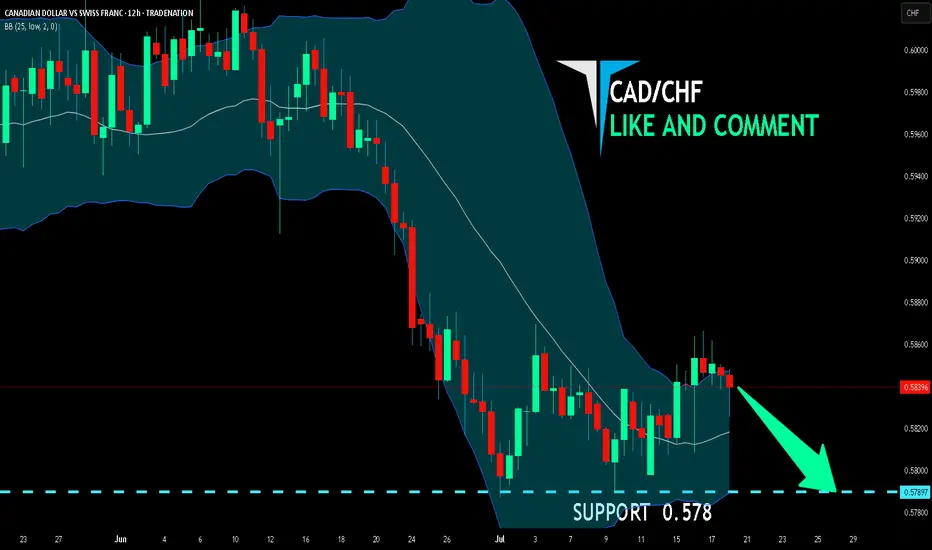
CAD/CHF SENDS CLEAR BEARISH SIGNALS|SHORT
Hello, Friends!
Previous week’s green candle means that for us the CAD/CHF pair is in the uptrend. And the current movement leg was also up but the resistance line will be hit soon and upper BB band proximity will signal an overbought condition so we will go for a counter-trend short trade with the target being at 0.578.
Disclosure: I am part of Trade Nation's Influencer program and receive a monthly fee for using their TradingView charts in my analysis.
✅LIKE AND COMMENT MY IDEAS✅
Price action Cadchf price fails to make lower low shows signs of change in character currently aiming for higher prices
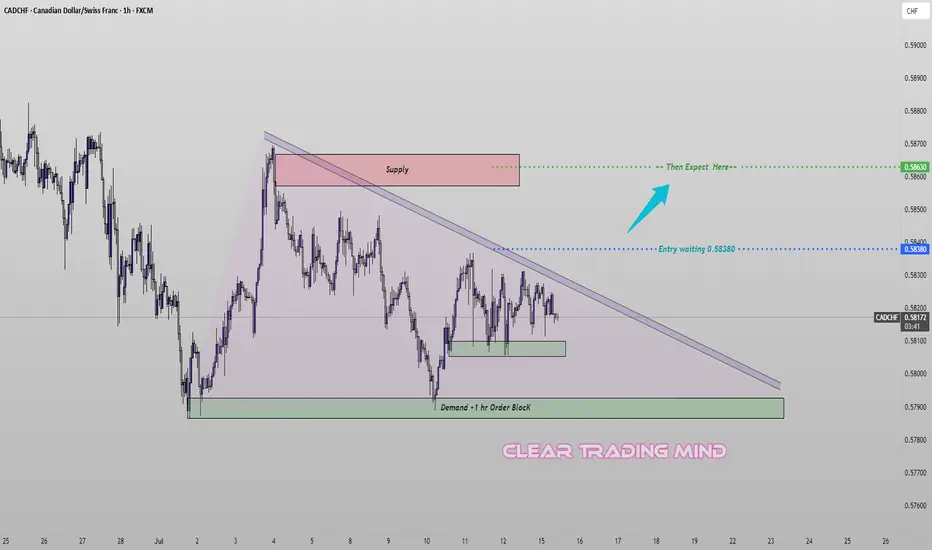
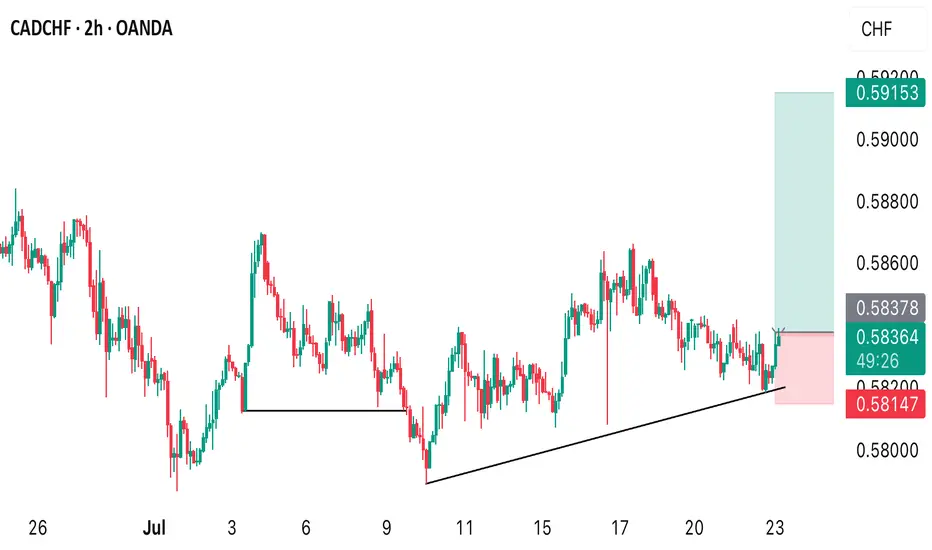
CADCHF Squeeze Between OB and Trendline – Big Move Coming?CADCHF is compressing within a descending triangle structure, showing signs of bullish intent as it continues to reject a key demand + 1H order block area.
🔹 Trade Idea:
I’m watching for a bullish breakout above 0.58380, which will also confirm a trendline breakout from the descending triangle. Until then, I remain on the sidelines.
🔹 Key Technical Factors:
- Price consolidating inside a descending triangle, squeezing between lower highs and a consistent demand zone
- Repeated rejections from the green demand zone suggest buyers are defending the level strongly
- A clean order block (1H) is aligned with the bottom of this structure, adding confluence for a bullish move
- Above 0.58380 breakout may trigger momentum toward 0.58630, near the supply zone
🔹 Trade Plan:
+ Buy above: 0.58380 (on breakout + close above trendline)
+ First Target: 0.58630 (next resistance/supply area)
* Invalid if: price breaks and holds below the demand zone
⚠️ Note: Entry is only valid on confirmed breakout. Until then, patience and watchfulness around structure edges are key.