CAD_CHF STRONG SUPPORT AHEAD|LONG|
✅CAD_CHF will be retesting a support
Level soon around 0.5920
From where I am expecting a bullish reaction
With the price going up but we need
To wait for a reversal pattern to form
Before entering the trade, so that we
Get a higher success probability of the trade
LONG🚀
✅Like and subscribe to never miss a new idea!✅
Disclosure: I am part of Trade Nation's Influencer program and receive a monthly fee for using their TradingView charts in my analysis.
CADCHF trade ideas

CADCHFSell. Market execution. trade 1:2. risk 0.50%
We entered Sell because the market is respecting the sellers' zone.

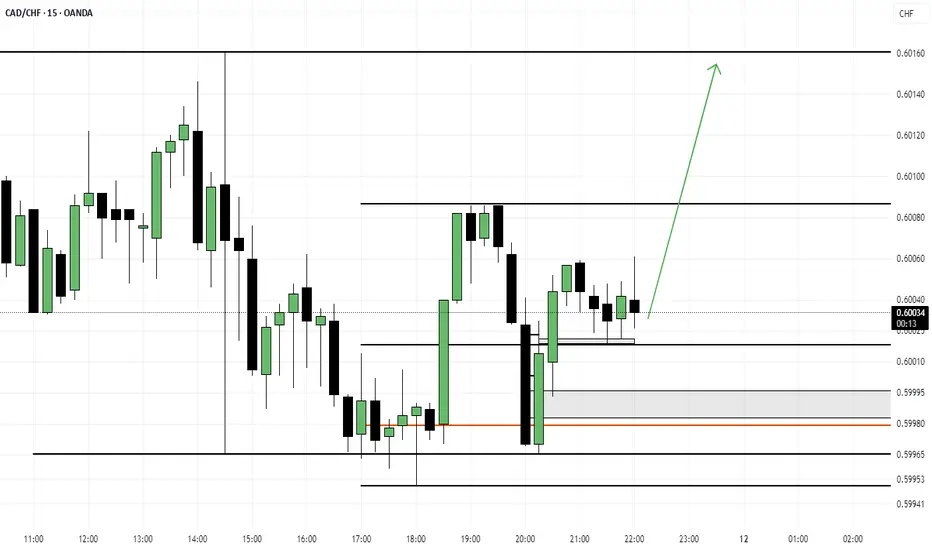
CADCHFCADCHF has already swept sell-side liquidity below a significant low. This indicates that smart money has likely engineered a stop-hunt to remove weak long positions and trap breakout sellers. With the liquidity taken, I am now looking for signs of bullish intent, such as a market structure shift (BOS) or bullish displacement. Once confirmed, I will look to buy on a retracement to a bullish order block, fair value gap (FVG), or imbalance created after the sweep
Do you have enough reasons to take the trade? IF NOT...stay outAll the information you need to find a high probability trade are in front of you on the charts so build your trading decisions on 'the facts' of the chart NOT what you think or what you want to happen or even what you heard will happen. If you have enough facts telling you to trade in a certain direction and therefore enough confluence to take a trade, then this is how you will gain consistency in you trading and build confidence. Check out my trade idea!!
www.tradingview.com

CAD/CHF Loonie Heist: Sniping Swiss Profits with Thief Trading!🌍 Hello Global Traders! 🌟
Money Makers, Risk Takers, and Market Shakers! 🤑💸✈️
Dive into our CAD/CHF "Loonie vs Swiss" Forex heist, crafted with the signature 🔥Thief Trading Style🔥, blending sharp technicals and deep fundamentals. Follow the strategy outlined in the TradingView chart, focusing on a long entry targeting the high-risk MA Zone. Expect a wild ride with overbought conditions, consolidation, and potential trend reversals where bearish players lurk. 🏆💰 Celebrate your wins, traders—you’ve earned it! 💪🎉
Entry 📈: The vault’s open! Grab bullish opportunities at any price, but for precision, set buy limit orders on a 15 or 30-minute timeframe near swing lows or highs for pullback entries.
Stop Loss 🛑:
📍 Place your Thief SL at the recent swing low on the 4H timeframe (0.59400) for scalping or day trades.
📍 Adjust SL based on your risk tolerance, lot size, and number of open orders.
Target 🎯: Aim for 0.61500.
💵 CAD/CHF is riding a bullish wave, fueled by key market drivers. ☝
Unlock the full picture—dive into Fundamentals, Macro Insights, COT Reports, Quantitative Analysis, Sentiment Outlook, Intermarket Trends, and Future Targets. Check 👉🌎🔗.
⚠️ Trading Alert: News & Position Management 📰🚨
News can shake the market hard. Protect your trades by:
Avoiding new entries during news releases.
Using trailing stops to lock in profits and shield running positions.
📌 Markets move fast—stay sharp, keep learning, and adapt your strategy as conditions evolve.
💖 Power up our heist! 🚀 Tap the Boost Button to amplify our Thief Trading Style and make stealing profits a breeze. Join our crew, grow stronger, and conquer the markets daily with ease. 🏆🤝❤️
Catch you at the next heist, traders—stay ready! 🤑🐱👤🤩


CADCHF Sell Now | Re-Entry at Supply ZoneSell Setup Active 🚨
Price has returned to a key supply zone after breaking structure. Clean rejection off:
• Previous support turned resistance
• Dynamic resistance from 50 EMA
• Bearish market structure still valid
📉 Re-entered short at 0.5966
🎯 Target 1: 0.5919
🎯 Target 2: 0.5862
❌ SL: Above the zone (~0.5985)
Let’s see how this plays out — momentum building for continuation.

CAD/CHF taking a pit stop before the break down?We saw a MAJOR Inverse Cup and Handle on CAD/CHF.
And when it broke down, we were too optimistic that downside would prevail.
In the interim, a Symmetrical Triangle was forming instead.
The prior trend was down, the Symmetrical Triangle is sideways, and it would be wrong to say the price is going to just break down.
By probability yes, the price does tend to break below according to the prior trend. But if CAD picks up, it could very well break up. We just have to wait for the APEX and then the break up or down.
My bet and according to the analysis, remains DOWN.
Let's see how it plays.
Disclosure: I am part of Trade Nation's Influencer program and receive a monthly fee for using their TradingView charts in my analysis.

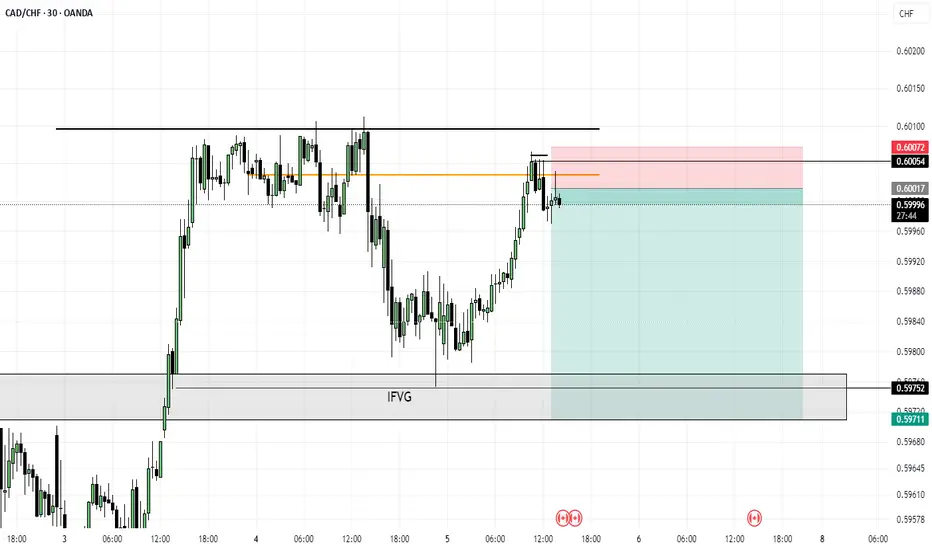
CADCHFCADCHF is showing clear signs of a potential sell-off after sweeping the liquidity resting above recent highs. The pair engineered a stop run into a key supply zone, aligning with confluence from higher timeframe imbalance. With buy-side liquidity now mitigated and no follow-through from bulls, I anticipate a reversal and a bearish move as institutional order flow shifts. I’ll be looking to short on confirmation, targeting inefficiencies below and recent demand levels.
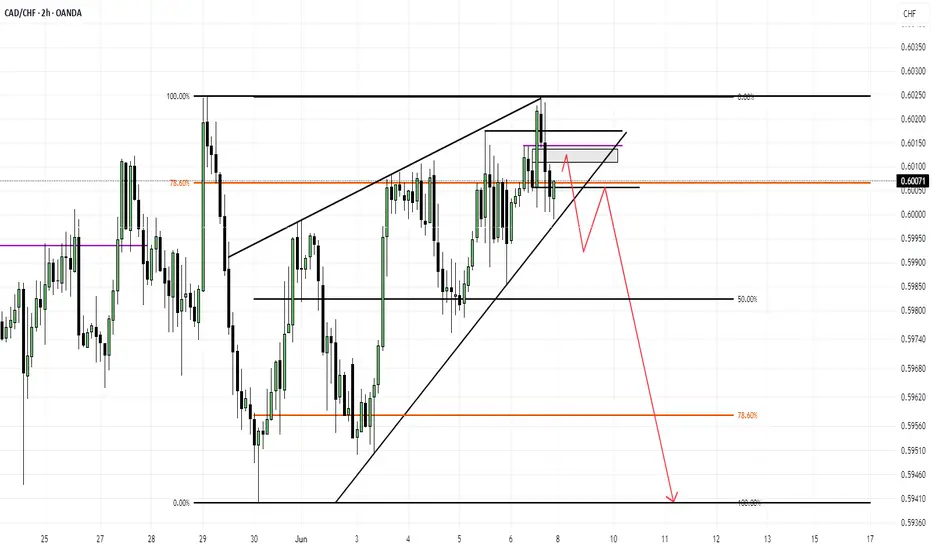
CADCHFCADCHF is currently forming a rising triangle, often seen as a bullish continuation pattern, but in this case, the structure appears to be stalling near resistance. This suggests that liquidity is building above recent highs, creating the potential for a stop hunt or false breakout. Such a move would allow smart money to engineer a sell-off, catching late buyers off guard.
The pattern shows signs of exhaustion, with price struggling to push higher despite higher lows. This imbalance, coupled with a likely liquidity grab, sets the stage for a reversal. Traders anticipating this move can consider partial take profits at the 50% Fibonacci retracement of the recent upward leg, where price often reacts before continuing lower.
Overall, although the triangle may give the illusion of upward pressure, the underlying liquidity dynamics and potential for a structural break favor a bearish outcome.
CAD/CHF BEARISH BIAS RIGHT NOW| SHORT
Hello, Friends!
The BB upper band is nearby so CAD/CHF is in the overbought territory. Thus, despite the uptrend on the 1W timeframe I think that we will see a bearish reaction from the resistance line above and a move down towards the target at around 0.593.
Disclosure: I am part of Trade Nation's Influencer program and receive a monthly fee for using their TradingView charts in my analysis.
✅LIKE AND COMMENT MY IDEAS✅

CADCHF in bullish trend CADCHF in bullish trend potentially printing a walling channel, entry with a sell limit, RR 1:1

CADCHFThere are certain zones marked on my chart where buying areas are highlighted in green and selling areas are highlighted in red. The darker the shade of green, the stronger and more reliable the buying zone, and similarly, the darker the shade of red, the stronger and more reliable the selling zone. There are also some zones labeled as “Buy Scalp” and “Sell Scalp,” which are considered high-risk zones suitable for smaller, quick trades, provided they are not during news releases, market openings, or the end of the trading day. Additionally, there are lines called “Key Price” levels: the green Key Price is for buyers, and the red Key Price is for sellers. These points are significant because if the market hits them, it is highly likely to break through and move on to the next zone, so it’s better to close the trade and look for a new entry in the next zone.
* All the zones marked on the chart hold a much higher level of reliability as long as they are reached within the same trading day. The longer it takes for the price to reach these zones, or if the market stays in a range without hitting them, the less reliable and weaker these zones become. Therefore, it’s important to reach these zones within the same day, as their validity decreases once the day ends. Additionally, there are certain lines marked as “Structure” lines in black. These represent important structures, and as long as the market respects these structures, the zones remain valid. However, if these structures are violated, hunted, or broken, then the opposing zones lose their validity.
در چارت، مناطقی خاص مشخص شدهاند که نواحی خرید با رنگ سبز و نواحی فروش با رنگ قرمز برجسته شدهاند. هرچه رنگ سبز تیرهتر باشد، آن ناحیه خرید قویتر و قابلاعتمادتر است و بههمینترتیب، هرچه رنگ قرمز تیرهتر باشد، ناحیه فروش اعتبار و قدرت بیشتری دارد.
همچنین، مناطقی با برچسبهای "Buy Scalp" و "Sell Scalp" نیز وجود دارند که نواحی پرریسک محسوب میشوند و تنها برای معاملات سریع و با حجم کم مناسباند، به شرطی که این معاملات در زمان انتشار اخبار، باز شدن بازار یا پایان روز معاملاتی انجام نشوند.
علاوه بر این، خطوطی به نام "Key Price" یا "قیمت کلیدی" در نمودار مشخص شدهاند: قیمت کلیدی سبز مخصوص خریداران و قیمت کلیدی قرمز مخصوص فروشندگان است. این سطوح اهمیت زیادی دارند، چون اگر بازار به این نقاط برسد، به احتمال زیاد از آن عبور کرده و به سمت ناحیه بعدی حرکت خواهد کرد. بنابراین، بهتر است در این نقاط معامله بسته شود و فرصت بعدی در منطقه بعدی جستوجو گردد.
🔸 تمام مناطقی که روی نمودار مشخص شدهاند تا زمانی که در همان روز معاملاتی لمس شوند، اعتبار بالاتری دارند. هرچقدر زمان بیشتری طول بکشد تا قیمت به این مناطق برسد، یا اگر بازار در محدودهای نوسان کند بدون آنکه این نواحی را لمس کند، اعتبار آنها کاهش مییابد و ضعیفتر میشوند. بنابراین، رسیدن به این نواحی در همان روز بسیار مهم است، چرا که با پایان روز، اعتبارشان کاهش مییابد.
🔸 همچنین، خطوطی تحت عنوان "ساختار" (Structure) با رنگ مشکی روی نمودار وجود دارند که نشاندهنده ساختارهای مهم قیمتی هستند. تا زمانی که بازار به این ساختارها احترام بگذارد (یعنی آنها را نشکند)، نواحی مشخصشده همچنان معتبر باقی میمانند. اما اگر این ساختارها شکسته شوند، شکار شوند یا نقض گردند، اعتبار نواحی مقابل از بین میرود.

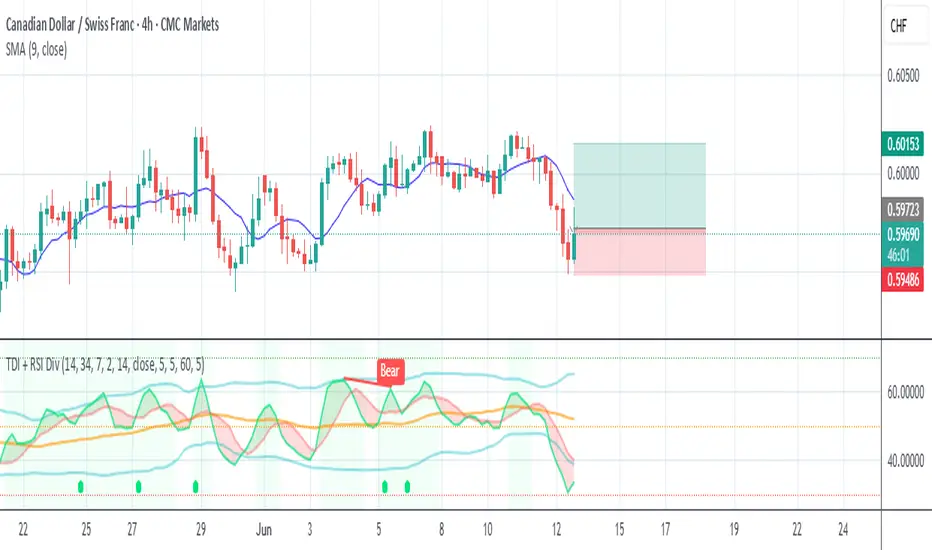
CAD/CHF – Bearish Continuation Setup🔍 **CAD/CHF – Bearish Continuation Setup**
The CAD/CHF pair is set up for a continuation of its bearish trend, with the macroeconomic calendar showing no major events for either currency that could disrupt technical flows. Canadian Housing Starts data is minor, and there is nothing significant for the Swiss franc, making this an ideal week for technical setups.
On the daily chart, CAD/CHF is firmly bearish, showing persistent lower highs and lower lows as price rides down a well-defined channel. Attempts to rally have consistently failed at order blocks located in premium zones, with each mitigation quickly sold into by institutional players. This is confirmed by the repeated sweeps of liquidity above prior highs before price resumes its decline.
The H1 and M15 timeframes show precise execution of smart money concepts: the most recent rally into premium was met with an aggressive bearish rejection, break of structure, and clear loss of bullish momentum on the RSI. The structure remains bearish and intact, with no signs of exhaustion or reversal.
Given the overall technical picture and the lack of upcoming news, the most probable scenario is continued movement lower into unmitigated discount zones. Traders should look to enter short on pullbacks to premium order blocks, with stops placed above the most recent liquidity highs, and targets set at well-defined support and imbalance zones below.
**In summary:**
CAD/CHF remains a sell this week, as bearish momentum and smart money distribution dominate. The lack of news supports pure price action trades, making this an attractive opportunity for SMC-based strategies.
---

POSSIBLE SELL OPPORTUNITY ON CADCHFPrice has broken to the downside. We are looking to enter the move at the break and re-test level where there seems to be some supply!

CAD-CHF Potential Short! Sell!
Hello,Traders!
CAD-CHF made a retest
Of the horizontal resistance
Of 0.5990 and pullback is
Already happening so we are
Locally bearish biased and
We will be expecting a
Further bearish move down
Sell!
Comment and subscribe to help us grow!
Check out other forecasts below too!
Disclosure: I am part of Trade Nation's Influencer program and receive a monthly fee for using their TradingView charts in my analysis.

CAD_CHF SHORT FROM RESISTANCE|
✅CAD_CHF has retested a key resistance level of 0.5990
And as the pair is already making a bearish pullback
A move down to retest the demand level below at 0.5960 is likely
SHORT🔥
✅Like and subscribe to never miss a new idea!✅
Disclosure: I am part of Trade Nation's Influencer program and receive a monthly fee for using their TradingView charts in my analysis.


CadchfWe are currently in a choppy market until we see a break above or below the support or resistance level before we can say

CADCHF 1H | 3R Achieved | Trendline + EMA Rejection Play
This was the clean setup I posted yesterday — textbook trend continuation with EMA dynamic resistance and support break structure.
Price tapped into the marked supply zone and melted straight to TP, delivering a clean 3R.
📍 Confluences:
• EMA 20/50 rejection
• Bearish structure + lower highs
• Clean retest of broken support
• Hourly continuation inside bearish channel
I’ll be watching for a potential reload setup if price pulls back into the 0.597 zone.
🟢 Drop a like if you caught this move — follow for more clean, real-time setups like this every week.

cadchf buy tradeThe Relative Strength Index (RSI) is showing an upward trend, indicating increasing momentum. Additionally, the Moving Average Convergence Divergence (MACD) is showing a bullish crossover, further supporting the potential for an upward move.
CADCHF 1H – Break of Structure & Retest | SELL NOWPrice has broken below the ascending trendline and key support zone. We’re now seeing a clean retest into previous structure + confluence with EMAs.
• ✅ 1H structure break confirmed
• 🔁 Retest of broken trendline and support turned resistance
• 📉 EMAs aligning for bearish momentum
• 🎯 Target: 0.59197 zone
• ❌ SL above 0.5985 zone
Entering short from current price — setup fits clean break and retest criteria.
📉 SELL NOW — trend shift confirmed unless price breaks back above structure.
