Momentum cycle perspective .This chart provides my future view on cadchf perspective which is undergoing a running flat correction .In 2 hr tf.I see it going further down after the bounce off the RSI 60 level which is Cardwellian RSI range rule.
Given the bollinger band burst in higher tf (weekly) , it is likely to do down .
Alternative scenario will be a complex prolonged consolidation.
CADCHF trade ideas

Long Idea: CADCHF | Quick Bounce SetupPair: CAD/CHF
Bias: Long 📈 (Short-term)
Timeframe: Intraday (1H / 15M)
CADCHF is showing signs of support at the 0.61600 level after recent selling pressure. This area aligns with prior structural support, indicating a potential bounce opportunity for a quick scalp trade.
Trade Plan:
Entry: 0.61600
Take Profit: 0.61800 (20 pips 🎯)
Stop Loss: 0.61400 (20 pips 🚫)
Risk-to-Reward Ratio: 1:1 ✅
Price tested 0.61600 multiple times, creating solid short-term support.
Potential short-covering rally towards minor resistance at 0.61800.
Move SL to break-even once price reaches +10 pips to secure position.

The loonie will keep taking the beat??CADCHF Daily: with the oil price not showing a strong recovery among other issues with the Trump's tariffs on Canadian products I am expecting a rejection on Fibo(61) at 0.61850 level confluence with 0.61907 previous Support level.

CADCHF: Pullback From SupportIt is likely that the CADCHF will retrace from the highlighted blue intraday support.
Additionally, there is an ascending triangle pattern forming, along with a breakout of its neckline, which further supports this prediction.
The target for this move is 0.6183.

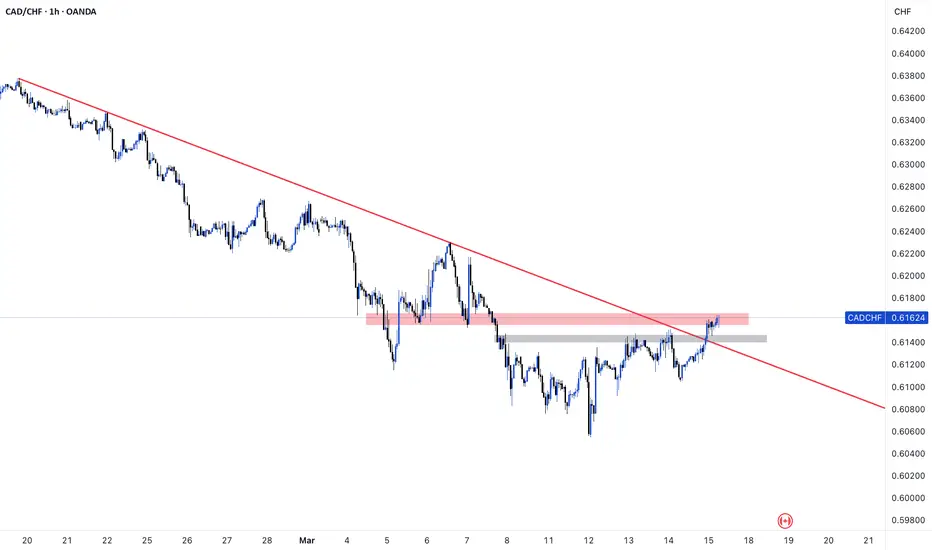
CAD/CHF 1HR // 17 March AnalysisWe can see the downtrend on CAD/CHF being broken on the 1 hour timeframe.
The price did respect the trendline and the marked resistance zone previously but ended up breaking it.
We can look for potential buys if the price breaks through the red support/resistance area. We may see price play between the two areas before giving us an indication the direction.
A good target for buys would be around the 0.62150 area.
DISCLAIMER: This analysis is purely for personal reference and record keeping and should be taken as educational material only, NOT FINANCIAL ADVISE. I will not be responsible for profits or loses due to this analysis.

CADCHF MADKET OUTLOOKPrice may rise to a pullback resistance where we’d be looking forward to sell from. A sell opportunity is envisaged if we get a retrace to 0.62732 it’ll be looking promising to sell from that area of pullback resistance

CADCHF - Bullish Signals - 99 Percent successful Hit chancesCADCHF Shows Bullish Weights More than Bears !!!!
Bullish Confluences:
1- Bullish Divergence
2- Major Support Level Testing and Breaking
3- LH Broken
4- Bearish Wedge Pattern
5- Sentiments of Long are > 90 percent
6- Completion of AB=CD pattern
TRADE PLAN :
Enter into the market at Current market price and take profit on defined FIB level as TP1 TP2 and TP3
STOP LOSS below LL

CADCHFThe trend will be bullish if it breaks the HH
Bullish Divergence
Head and Shoulder
No continuation pattern

ABOUT CADCHFMy option about cadchf Is more bearish so that zone is good and strong restanice if the price comes to that zone it can pullback

CADCHF Long PositionICMARKETS:CADCHF
Entry: 0.61355
Stop Loss: 0.60460
Take Profit 1: 0.62200
Take Profit 2: 0.63248
Take Profit 3: 0.64345

CADCHFhello traders, the price has reached all time low in all tf, the weekly candle is bullish from the point of main support level. weekly candle need to be closed in bullish this week to have some sign of bullish move in future.. however price may only fill the weekly fvg and could fall more due to economic condition.. look for more confirmation and use proper risk management.. goodluck

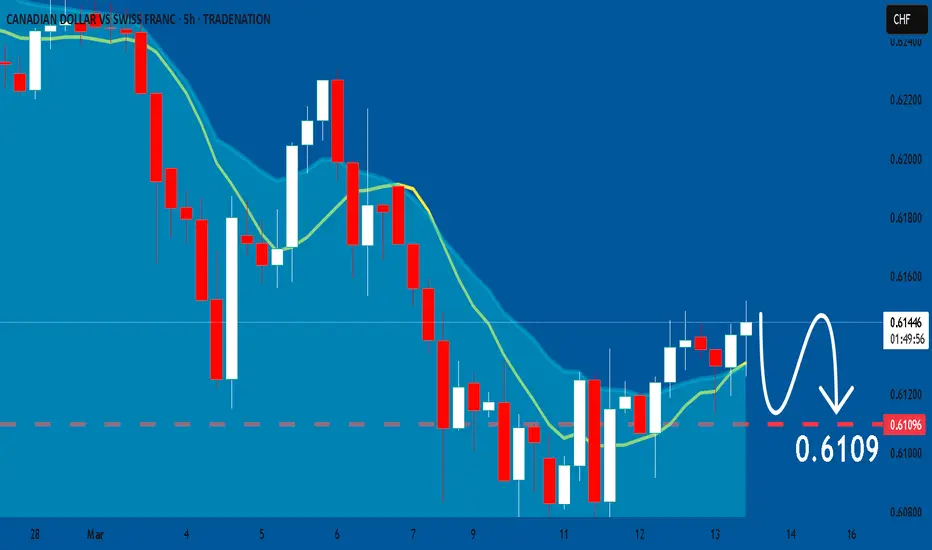
CADCHF: Bearish Forecast & Bearish Scenario
Looking at the chart of CADCHF right now we are seeing some interesting price action on the lower timeframes. Thus a local move down seems to be quite likely.
Disclosure: I am part of Trade Nation's Influencer program and receive a monthly fee for using their TradingView charts in my analysis.
❤️ Please, support our work with like & comment! ❤️
CADCHF; Heikin Ashi Trade IdeaOANDA:CADCHF
In this video, I’ll be sharing my analysis of CADCHF, using my unique Heikin Ashi strategy. I’ll walk you through the reasoning behind my trade setup and highlight key areas where I’m anticipating potential opportunities.
I’m always happy to receive any feedback.
Like, share and comment! ❤️
Thank you for watching my videos! 🙏

CAD/CHF SELL/SHORTBy utilizing Fibonacci retracement levels, historical patterns, , we can formulate a hypothesis that the market might follow a similar trajectory if bearish sentiment prevails.

Heading into 61.8% Fibonacci resistance?CAD/CHF is rising towards the pivot which is a pullback resistance and could reverse to the 1st support.
Pivot: 0.61595
1st Support: 0.60808
1st Resistance: 0.62223
Risk Warning:
Trading Forex and CFDs carries a high level of risk to your capital and you should only trade with money you can afford to lose. Trading Forex and CFDs may not be suitable for all investors, so please ensure that you fully understand the risks involved and seek independent advice if necessary.
Disclaimer:
The above opinions given constitute general market commentary, and do not constitute the opinion or advice of IC Markets or any form of personal or investment advice.
Any opinions, news, research, analyses, prices, other information, or links to third-party sites contained on this website are provided on an "as-is" basis, are intended only to be informative, is not an advice nor a recommendation, nor research, or a record of our trading prices, or an offer of, or solicitation for a transaction in any financial instrument and thus should not be treated as such. The information provided does not involve any specific investment objectives, financial situation and needs of any specific person who may receive it. Please be aware, that past performance is not a reliable indicator of future performance and/or results. Past Performance or Forward-looking scenarios based upon the reasonable beliefs of the third-party provider are not a guarantee of future performance. Actual results may differ materially from those anticipated in forward-looking or past performance statements. IC Markets makes no representation or warranty and assumes no liability as to the accuracy or completeness of the information provided, nor any loss arising from any investment based on a recommendation, forecast or any information supplied by any third-party.

CADCHF long/buy 1:11 probability! Hello everyone
Looking forward to investing in this pair.
1. 5 waves complete structure
2. Ending diagonal
3. Break of low (High probability of move starting)
4. Liquidity build up at the HL needs to be cleared
5. MACD Divergence
Entry: Current Market Price 0.61485
SL: 0.53243
TP: 1.50000
NB: REMEMBER, IT"S AN INVESTMENT!
PLACE THE TRADE AND FORGET ABOUT IT

CadChf bullishBullish setup shows in CADCHF
Good risk reward //
Blue lines indicate two entry points for BUY limit
Liquity is above as shown by equal highs
Red line is SL

I know most dont trade it but pls, buy CADCHFYh, I know you guys focus on the major pairs but I think this pair too is ready to move up. Dont joke with it.
This will also set the stage for USDCAD to fall.
If you're seeing this too, short USDCAD, I will post charts soon

CADCHF- Buy IdeaCADCHF has just formed a "Double Bottom" at weekly and monthly time frame, accompanied by a bullish RSI divergence on the weekly chart. Seasonality indicates bullish momentum after mid-March to the end of April. Look for Buy opportunities on confirmation or you can look for buy on the current level if you are an aggressive trader.

CADCHF is Bullish Price was in a strong downtrend, however a matured bullish divergence on hourly time frame hints the return of bulls. If both previous lower highs mentioned on the chart are broken then we can expect a bullish reversal as per Dow theory. Targets are mentioned on the chart.

Bullish rebound?CAD/CHF is reacting off the pivot and could rise to the 1st resistance which is a pullback resistance.
Pivot: 0.60775
1st Support: 0.60371
1st Resistance: 0.61583
Risk Warning:
Trading Forex and CFDs carries a high level of risk to your capital and you should only trade with money you can afford to lose. Trading Forex and CFDs may not be suitable for all investors, so please ensure that you fully understand the risks involved and seek independent advice if necessary.
Disclaimer:
The above opinions given constitute general market commentary, and do not constitute the opinion or advice of IC Markets or any form of personal or investment advice.
Any opinions, news, research, analyses, prices, other information, or links to third-party sites contained on this website are provided on an "as-is" basis, are intended only to be informative, is not an advice nor a recommendation, nor research, or a record of our trading prices, or an offer of, or solicitation for a transaction in any financial instrument and thus should not be treated as such. The information provided does not involve any specific investment objectives, financial situation and needs of any specific person who may receive it. Please be aware, that past performance is not a reliable indicator of future performance and/or results. Past Performance or Forward-looking scenarios based upon the reasonable beliefs of the third-party provider are not a guarantee of future performance. Actual results may differ materially from those anticipated in forward-looking or past performance statements. IC Markets makes no representation or warranty and assumes no liability as to the accuracy or completeness of the information provided, nor any loss arising from any investment based on a recommendation, forecast or any information supplied by any third-party.

CAD_CHF SWING LONG|
✅CAD_CHF is going down now
But a strong support level is ahead at 0.6060
Thus I am expecting a rebound
And a move up towards the target at 0.6123
LONG🚀
✅Like and subscribe to never miss a new idea!✅
