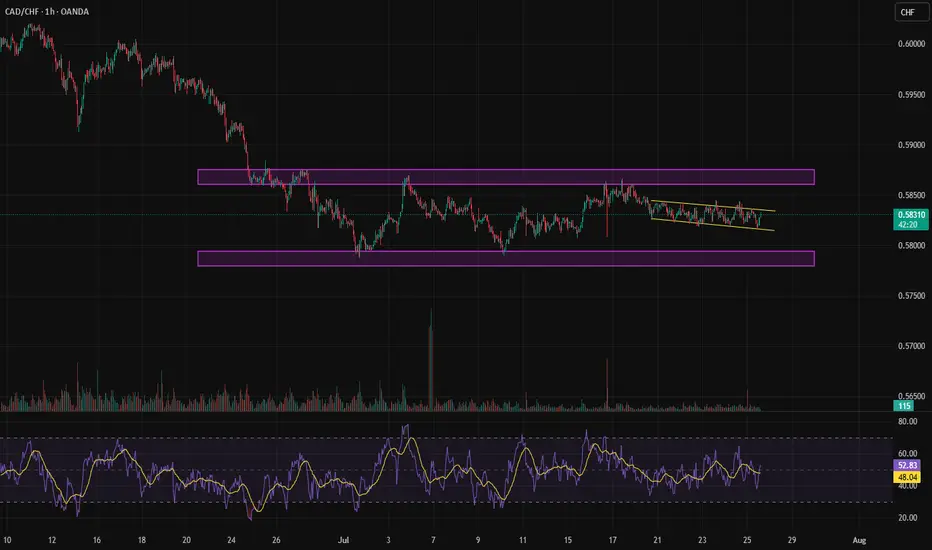
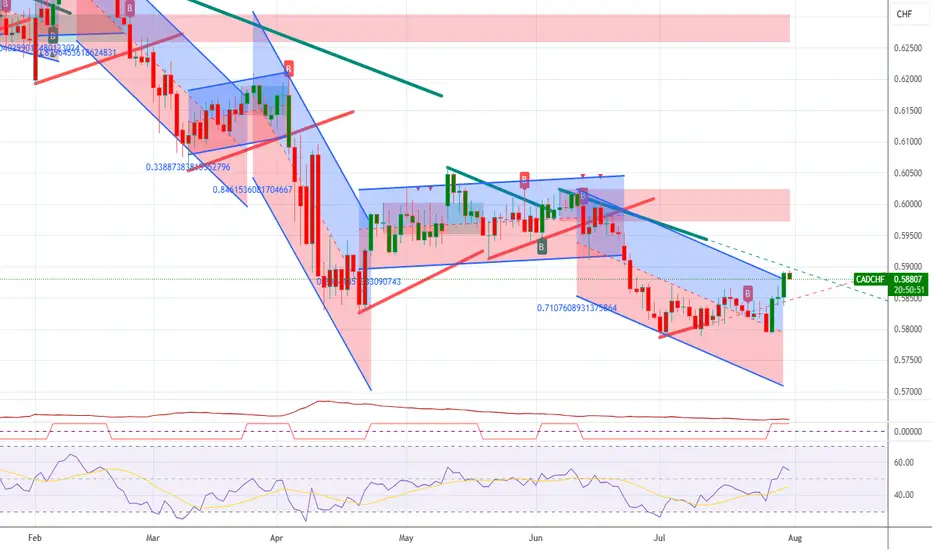
Close to breaking out of the range.After nearly 31 days, a consolidation has formed within the range, which could signal either a buy or sell opportunity.
CADCHF trade ideas
SELL CADCHF now for 4h time frame bearish trend continuationSELL CADCHF now for 4h time frame bearish trend continuation
SELL CADCHF now for a four hour time frame bearish trend continuation..........
STOP LOSS: 0.5845
This sell trade setup is based on hidden bearish divergence trend continuation trading pattern...
Always remember, the trend is your friend, so whenever you can get a signal that the trend will continue, then good for you to be part of it
TAKE PROFIT : take profit will be when the trend comes to an end, feel from to send me a direct DM if you have any question about take profit or anything.
Remember to risk only what you are comfortable with….....trading with the trend, patient and good risk management is the key to success here

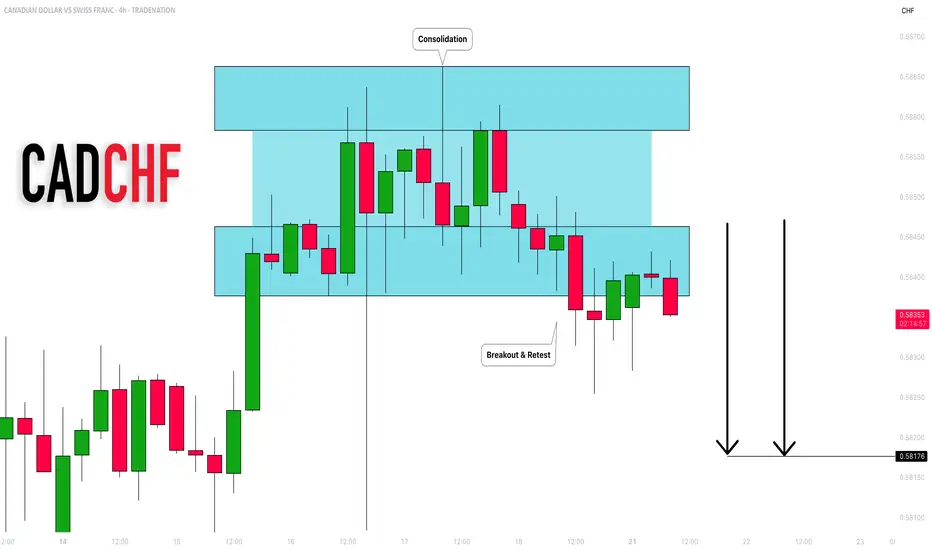
CADCHF: Bearish Outlook Explained 🇨🇦🇨🇭
CADCHF completed an intraday consolidation within a horizontal
parallel channel.
Its support was broken on Friday and we see a positive bearish
reaction to that after its retest.
With a high probability, the price will drop to 0.582 level soon.
❤️Please, support my work with like, thank you!❤️
I am part of Trade Nation's Influencer program and receive a monthly fee for using their TradingView charts in my analysis.
CADCHF bullish expectations for next period
OANDA:CADCHF interesting chart, bearish trend last 5M, i am have bullish expectations on 10.June, but price is make one more strong bearish push.
Currently nice structure created, price pushing bullish, from here expectations are bullish trend to see.
SUP zone: 0.58050
RES zone: 0.59000, 0.59450

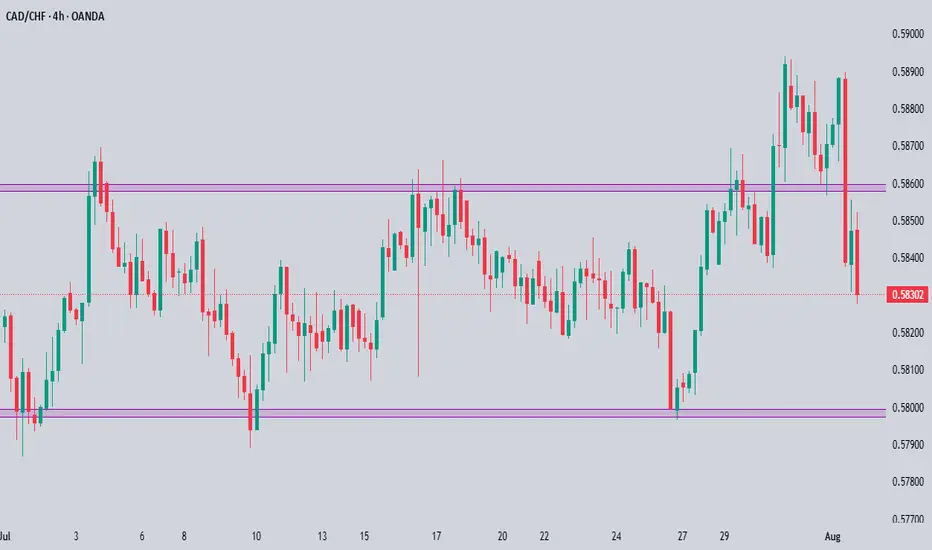
CADCHF Technical & Order Flow AnalysisOur analysis is based on a multi-timeframe top-down approach and fundamental analysis.
Based on our assessment, the price is expected to return to the monthly level.
DISCLAIMER: This analysis may change at any time without notice and is solely intended to assist traders in making independent investment decisions. Please note that this is a prediction, and I have no obligation to act on it, nor should you.
Please support our analysis with a boost or comment!
sell cadchfwe reach to a resistance and then break the last low and pullback to broken low and then we enter....
CADCHF 4HThis CADCHF 4H chart shows a clear market structure shift (MSS) from bearish to bullish, confirming a possible trend reversal. Price has broken structure to the upside and is now pulling back into a bullish order block zone.
What’s likely to happen:
- Price is expected to retest one of the order blocks (preferably the second/lower one) before continuing upward.
- The green zone marks the potential take profit or target area.
What to do next:
1. Wait for a bullish reaction from one of the order blocks — like a bullish engulfing candle or a strong rejection wick.
2. Once confirmed, enter a buy trade with SL below the order block and TP around the top of the green zone.
3. Manage your risk wisely — don’t rush the entry. Wait for confirmation.
This setup is clean and shows smart money interest. Let the market come to your zone. Patience = precision.

Cad/chf sellI can see a stall in the cad dollar at this zone and is looking set for a pullback , I will be selling at 58,500 and looking for profits down at 57.876 a 0.74% profit 📈

CADCHF sell trade taken to continue the downtrendCADCHF has been in a nice downtrend for a while now.
Once I saw that price bounced off the 20 EMA, I entered into a sell trade.
I've marked my entry, SL and TP.
Let's see how this trade plays out.
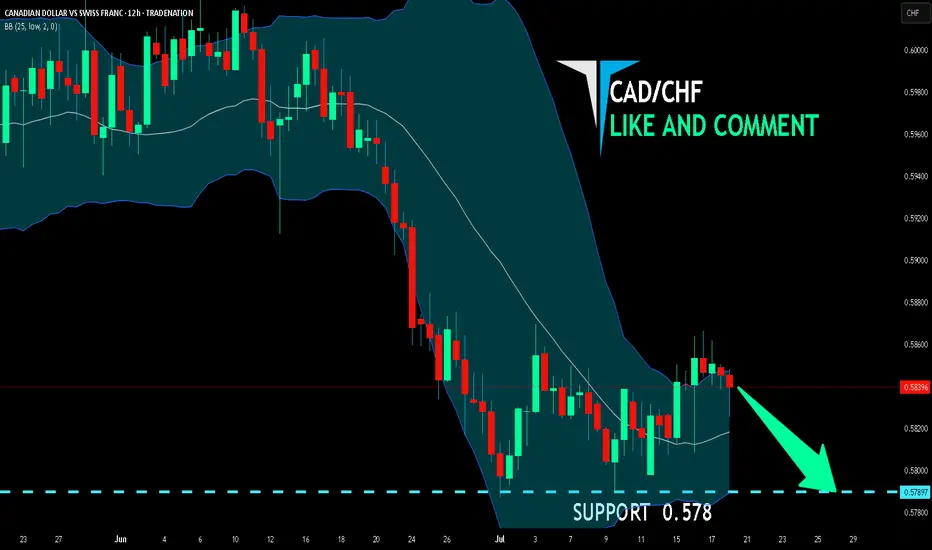
CAD/CHF SENDS CLEAR BEARISH SIGNALS|SHORT
Hello, Friends!
Previous week’s green candle means that for us the CAD/CHF pair is in the uptrend. And the current movement leg was also up but the resistance line will be hit soon and upper BB band proximity will signal an overbought condition so we will go for a counter-trend short trade with the target being at 0.578.
Disclosure: I am part of Trade Nation's Influencer program and receive a monthly fee for using their TradingView charts in my analysis.
✅LIKE AND COMMENT MY IDEAS✅
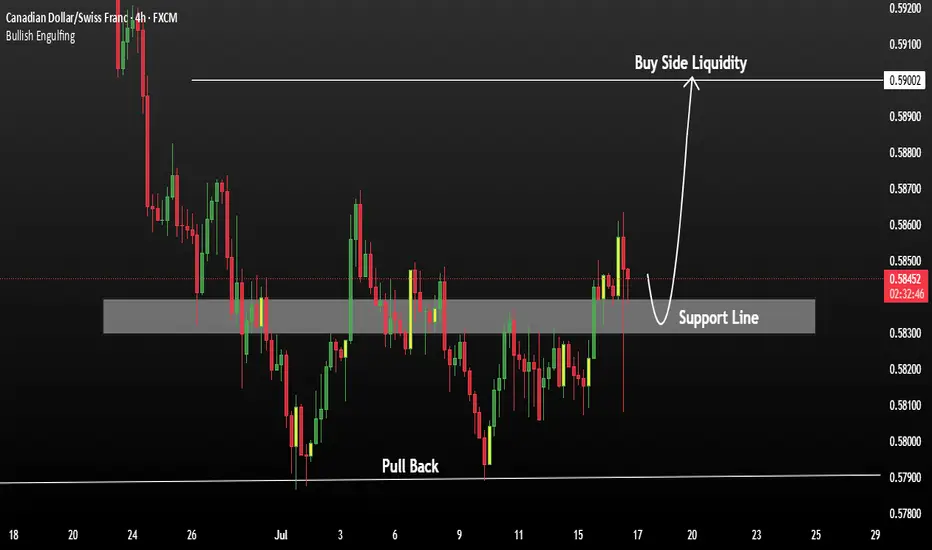
CADCHF Buying Opportunity after Strong Support CADCHF is currently respecting a strong support zone, indicating a potential bullish reversal pattern in development. The structure suggests that most of the downward pressure may be exhausted, and buyers could begin to take control.
Price action shows signs of completing a doubt/uncertainty pattern, reinforcing the base formed at support. A strong resistance level lies near 0.59002. If the 4H candle closes above this level, it may confirm a breakout and open the door for further bullish momentum.
You May find more details in the chart.
Trade wisely best of Luck Buddies.
PS: Support with like and comments for better analysis.
Price action Cadchf price fails to make lower low shows signs of change in character currently aiming for higher prices
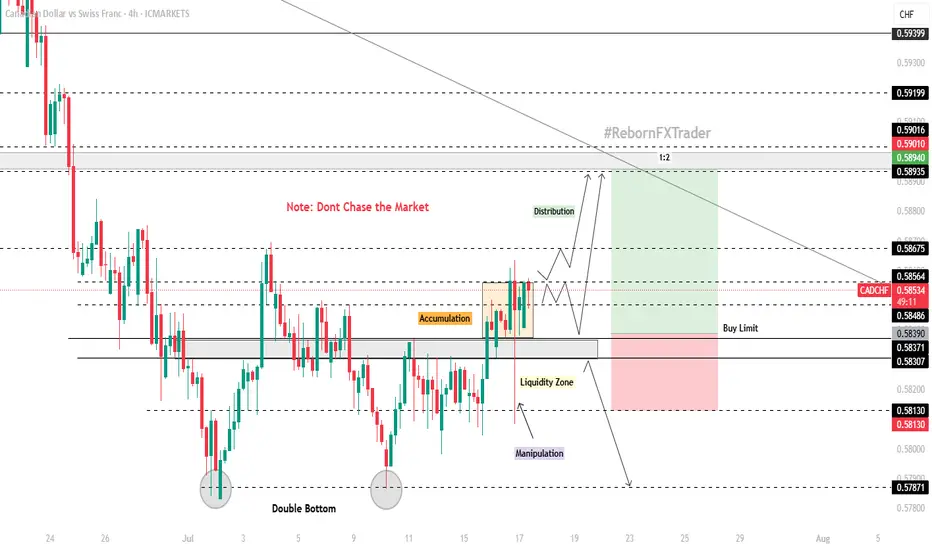
CAD/CHF 4H Technical and Fundamental AnalysisCAD/CHF 4H Technical and Fundamental Analysis
CAD/CHF has shown bullish potential this week, supported by strengthening fundamentals and a technical breakout. From a macro perspective, the Canadian dollar (CAD) continues to benefit from rising crude oil prices, a key Canadian export. With WTI crude trading above $80 per barrel, the commodity-backed CAD gains further momentum. Meanwhile, the Swiss franc (CHF)—often viewed as a safe haven—is seeing mild outflows as risk appetite improves globally and capital shifts toward higher-yielding assets.
From a central bank standpoint, the Bank of Canada (BoC) has struck a cautiously optimistic tone regarding inflation, while the Swiss National Bank (SNB) has already begun cutting interest rates—creating a divergent policy path that favors CAD strength against CHF.
On the technical side, CAD/CHF recently found strong support in the 0.57800–0.58100 zone, where price formed a potential double bottom pattern just below key resistance—a signal often associated with bullish reversal. A minor key level at 0.58300 was broken, followed by a clear accumulation phase. After consolidation, price grabbed liquidity with a long wick but closed above the key level, forming a bullish engulfing candle, suggesting strong buying pressure.
We now await a retracement into our zone of interest to position long entries with favorable risk-reward.
📍 Buy Setup:
Entry: Buy Limit at 0.58390
Stop Loss: 0.58130 (below liquidity grab)
Take Profit: 0.58940 (next key resistance)
📌 Disclaimer:
This is not financial advice. Always wait for proper confirmation before executing trades. Manage risk wisely and trade what you see—not what you feel.
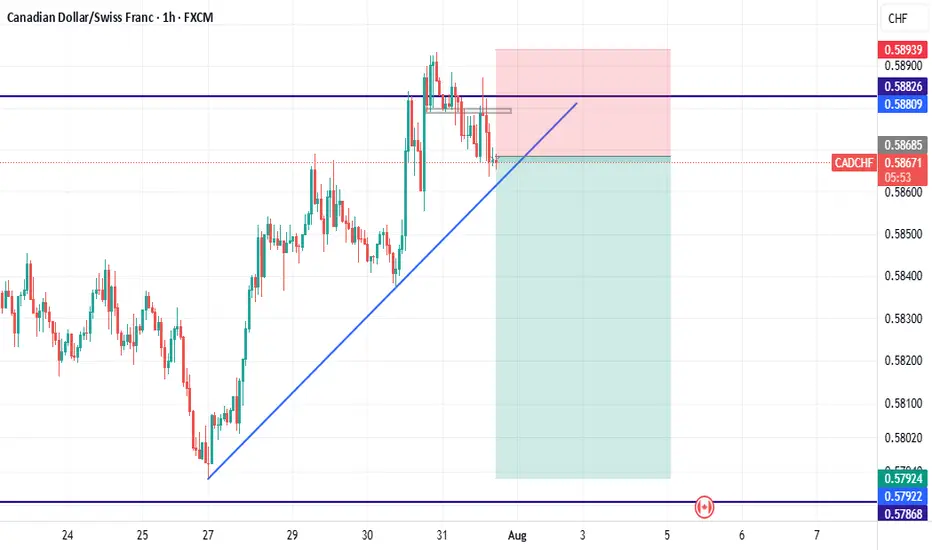
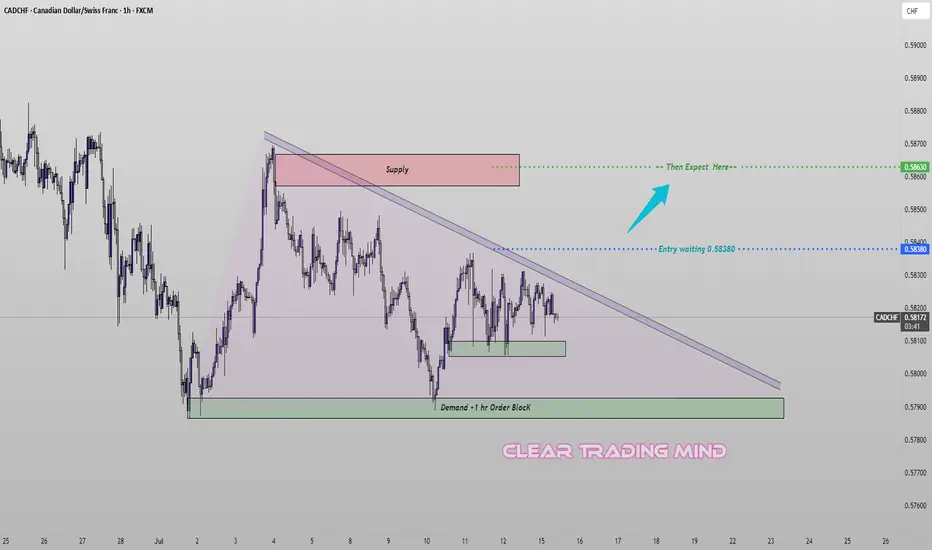
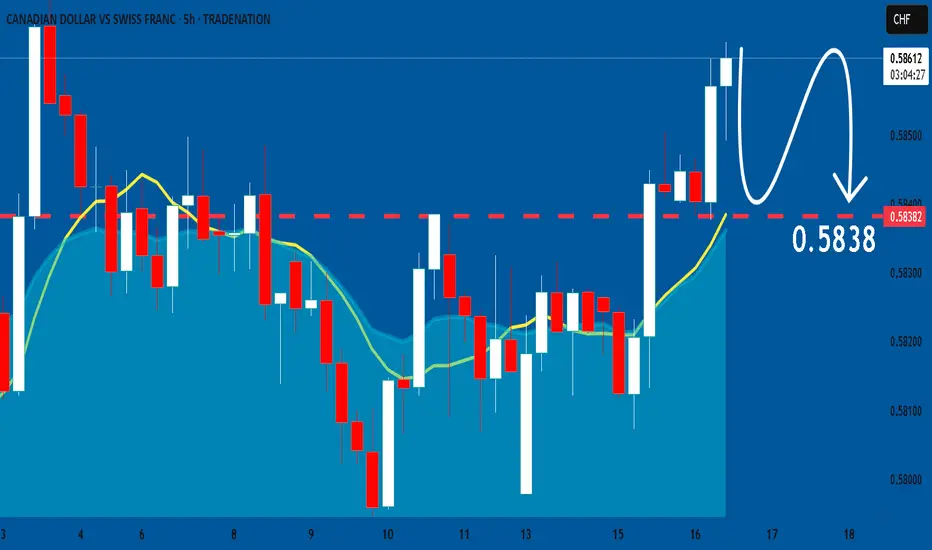
CADCHF Squeeze Between OB and Trendline – Big Move Coming?CADCHF is compressing within a descending triangle structure, showing signs of bullish intent as it continues to reject a key demand + 1H order block area.
🔹 Trade Idea:
I’m watching for a bullish breakout above 0.58380, which will also confirm a trendline breakout from the descending triangle. Until then, I remain on the sidelines.
🔹 Key Technical Factors:
- Price consolidating inside a descending triangle, squeezing between lower highs and a consistent demand zone
- Repeated rejections from the green demand zone suggest buyers are defending the level strongly
- A clean order block (1H) is aligned with the bottom of this structure, adding confluence for a bullish move
- Above 0.58380 breakout may trigger momentum toward 0.58630, near the supply zone
🔹 Trade Plan:
+ Buy above: 0.58380 (on breakout + close above trendline)
+ First Target: 0.58630 (next resistance/supply area)
* Invalid if: price breaks and holds below the demand zone
⚠️ Note: Entry is only valid on confirmed breakout. Until then, patience and watchfulness around structure edges are key.
CADCHF: Bearish Continuation
Looking at the chart of CADCHF right now we are seeing some interesting price action on the lower timeframes. Thus a local move down seems to be quite likely.
Disclosure: I am part of Trade Nation's Influencer program and receive a monthly fee for using their TradingView charts in my analysis.
❤️ Please, support our work with like & comment! ❤️
CADCHF possible Bearish Scenario The CADCHf is bearish mode and recently forming a symmetrical triangle like pattern and Within this also forming another sub triangle. let us see how it behaves to these trendlines.

CADCHF is BullishPrice was in a strong downtrend, however a double bottom reversal pattern hints the control of bulls. If previous lower high is broken with god volume then we can expect a strong bullish reversal as per Dow theory. Targets are mentioned on the chart.
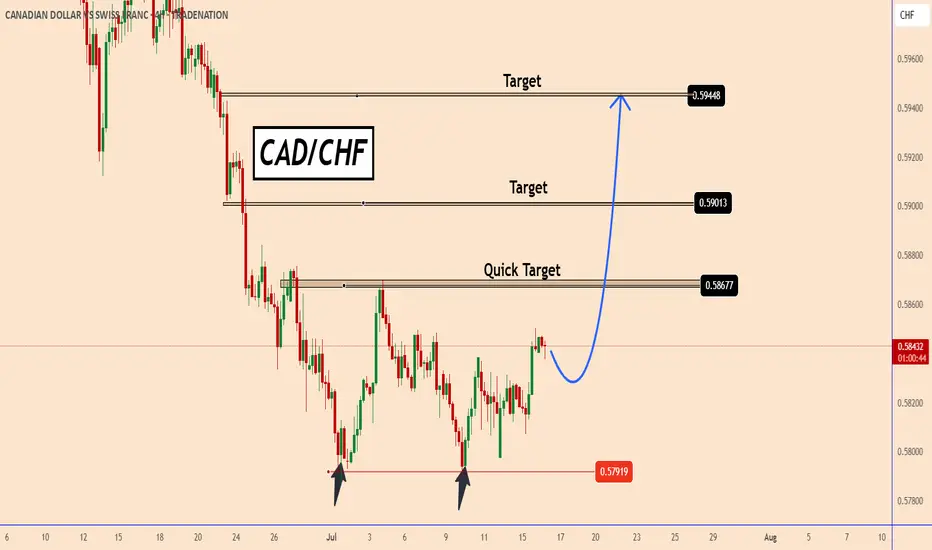
CADCHF found strong support zone near 0.5790CADCHF found a strong support zone near 0.5790
The chances are that the price already completed a doubt bottom pattern. It is not confirmed yet but the support zone is already too strong.
The price may face a strong resistance near the first target 0.5870 that is also the strongest target. Once the price moves above that zone it should rise further to the other targets near 0.5900 and 0.5945
You may find more details in the chart!
Thank you and Good Luck!
PS: Please support with a like or comment if you find this analysis useful for your trading day
Disclosure: I am part of Trade Nation's Influencer program and receive a monthly fee for using their TradingView charts in my analysis.
CADCHF Sellers In Panic! BUY!
My dear friends,
CADCHF looks like it will make a good move, and here are the details:
The market is trading on 0.5811 pivot level.
Bias - Bullish
Technical Indicators: Supper Trend generates a clear long signal while Pivot Point HL is currently determining the overall Bullish trend of the market.
Goal - 0.5831
About Used Indicators:
Pivot points are a great way to identify areas of support and resistance, but they work best when combined with other kinds of technical analysis
Disclosure: I am part of Trade Nation's Influencer program and receive a monthly fee for using their TradingView charts in my analysis.
———————————
WISH YOU ALL LUCK

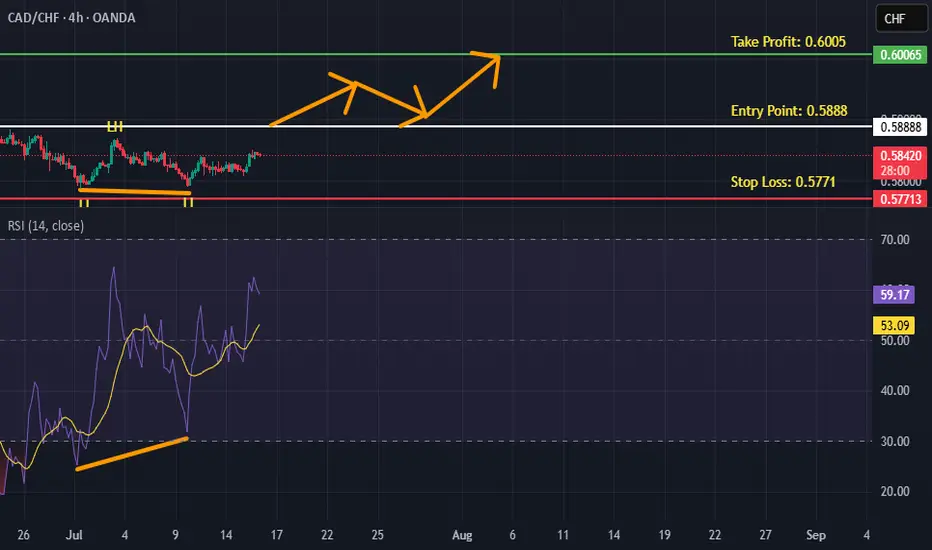
CRT on Weekly timeframe / Bullish 🎯 Trade Idea:
If you're already in: Good entry, but keep a tight stop below 0.5770.
If you're not in yet: Wait for a bullish confirmation candle (engulfing, hammer, etc.) on the daily or weekly before entering.
TP Zones:
TP1: 0.5900 (minor resistance)
TP2: 0.6040 (key structure zone)

CAD/CHF BULLS ARE GAINING STRENGTH|LONG
CAD/CHF SIGNAL
Trade Direction: long
Entry Level: 0.580
Target Level: 0.603
Stop Loss: 0.565
RISK PROFILE
Risk level: medium
Suggested risk: 1%
Timeframe: 1D
Disclosure: I am part of Trade Nation's Influencer program and receive a monthly fee for using their TradingView charts in my analysis.
✅LIKE AND COMMENT MY IDEAS✅
