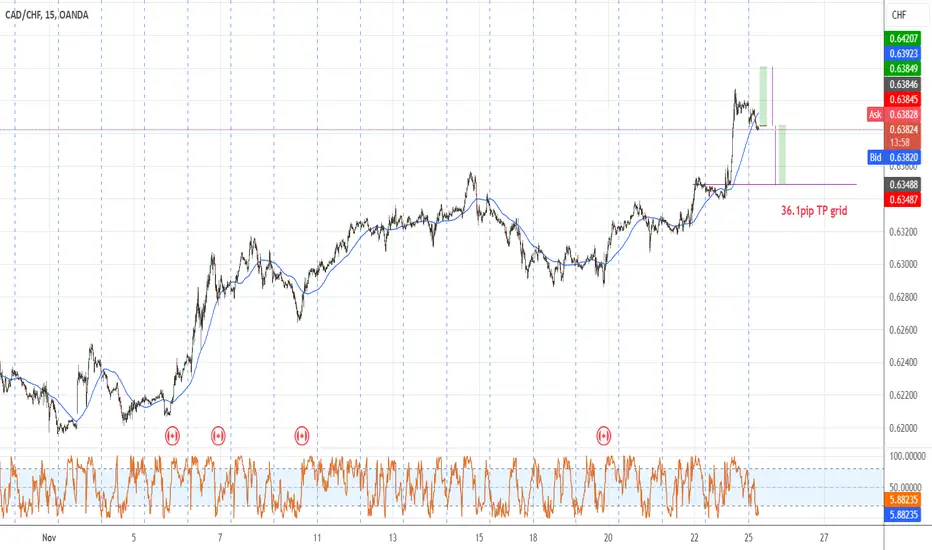
CADCHF: A Local Bullish Reversal in Sight?A bullish reaction has emerged at a key daily support level on the CADCHF chart.
After testing the highlighted blue zone, the price entered a consolidation phase, forming a horizontal range on the 4-hour timeframe.
The breakout above the resistance level signals strong buying pressure, suggesting a potential bullish trend continuation toward the 0.6340 target.
CADCHF trade ideas

CADCHF: Local Bullish Reversal?!We have observed a positive bullish response to an important daily support level on the CADCHF chart.
Following a test of the highlighted blue zone, the price began to consolidate and created a horizontal range on the 4-hour timeframe.
The resistance level was broken, indicating strong buying pressure. As a result, we anticipate a bullish trend continuation, possibly reaching 0.6340.

CAD/CHF Resistance with Fair Volume GapOnCAD/CHF , it's nice to see a strong sell-off from the price of 0.63320. It's also encouraging to observe a strong volume area where a lot of contracts are accumulated.
I believe that sellers from this area will defend their short positions. When the price returns to this area, strong sellers will push the market down again.
Fair Volume GAP (FVG) and high volume cluster are the main reasons for my decision to go short on this trade.
Happy trading,
Dale

#011 DCA CADCHF BuyI looked at the Daily Time Frame and it was a mess!
However, when I zoomed down to the 4H, then 1H and 15Minutes, I saw that even though there were gap, price is generally still trending. Especially when I plotted the 60SMA, and on some charts, the 1020EMA.
I bought the CADCHF because price retraced back to the 60SMA on the 15 Minutes Time Frame.
I placed two orders. The first is the market buy, and second, a limit buy order for if price collapses lower, I could do a recovery and still cop a profit when the first position goes back to breakeven.
If price goes beyond the 2nd order, I will have to look into how I could recover from the drawdown.
That's all for now and that's all for CADCHF. I'll be posting on the GBPUSD trade in the next entry.
1130SGT 25112024
Add : I am buying into the oversold as seen on the stochastic 20,1,1.
CADCHFWe expect it to rise now to the current target. If the four-hour candle closes below the area, the analysis will end

UPDATES ON CAD/CHFAt the moment we wait for price to break supply area in 30min and start looking for buy entry

CAD/CHF DIRECTIONhi guyz,After market shift/change of character happen price did not make a pullback also there was imbalance left near supply zone.as we can see pice has already start making pullback heading to supply zone,at the moment from one hour there is change of character hapeen for bulls,wait for price to fill fair value gap then start looking for entry.Trade safe

CADCHF FORECASTTraders! This pair is looking very good for the drop, we still need to keep an eye on this, to see how structures are developing and where the market will allow us to get in.

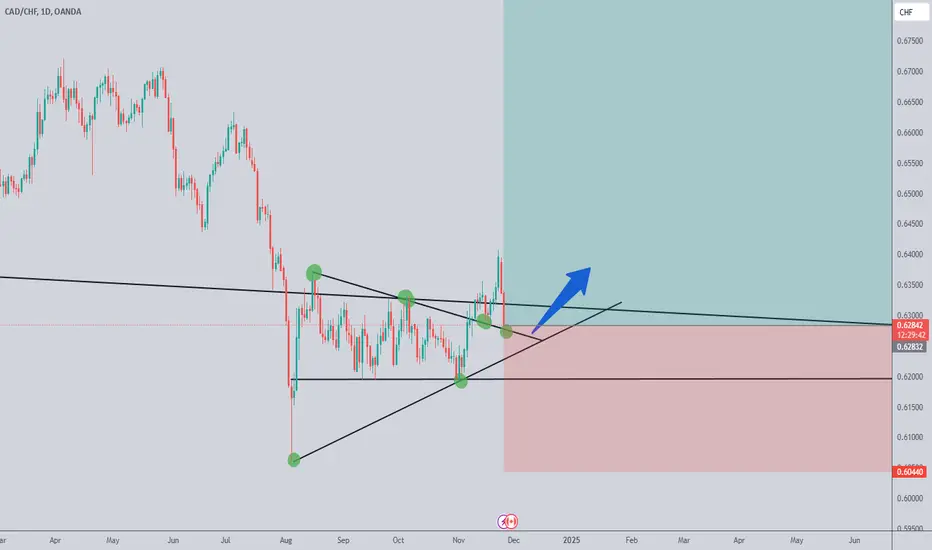
CAD/CHF is ready for a Bullish Rally!Based on the given analysis of CAD/CHF on the daily timeframe, the chart indicates that accumulation has nearly concluded, setting the stage for a potential bullish rally. The price action reflects a bullish structure, as it hovers near significant Fibonacci levels within a consolidation zone. Additionally, while a bearish Change of Character (ChoCh) has been observed in the SXY, suggesting room for a further drop to its support area, the CXY aligns with bullish divergence on the daily timeframe. These technical factors collectively signal favorable conditions for an upward movement, making CAD/CHF an appealing candidate for a bullish trade setup.

CAD/CHF LONG WEEKLY BULLISH
LAST CANDEL CLOSE BUL
WEEKLY FIB WORKS FOR ME
DAILY : FAKE OUT
4H :BULLISH M WITH BOS

CADCHF The Target Is UP! BUY!
My dear followers,
This is my opinion on the CADCHF next move:
The asset is approaching an important pivot point 0.6273
Bias - Bullish
Safe Stop Loss - 0.6249
Technical Indicators: Supper Trend generates a clear short signal while Pivot Point HL is currently determining the overall Bearish trend of the market.
Goal - 0.6318
About Used Indicators:
For more efficient signals, super-trend is used in combination with other indicators like Pivot Points.
———————————
WISH YOU ALL LUCK

CADCHF_LONG OPPORTUNITYCADCHF can give a Long Opportunity by looking into the factors mentioned in the chart on Fundamental & Technical basis.

CAD/CHF: Sellers Press for Control Amid Economic DivergenceMarket Overview
On Wednesday, 27th November 2024, CAD/CHF found itself under significant bearish pressure, primarily driven by contrasting economic developments in Canada and Switzerland.
Technical Analysis
From a technical perspective, the daily chart of CAD/CHF reveals bearish momentum taking over after price bounced off a mid-term descending trendline. Price touched this trendline, met selling pressure, and subsequently pulled back from the resistance area of 0.64064, which coincided with the trendline. Furthermore, today's price action broke below the previous support level at 0.62851, indicating a continuation of the downward momentum. This breach weakened a critical support level, paving the way for additional downside.
The next downside target for CAD/CHF stands at 0.62521, which serves as the first immediate support. If bearish pressure persists and this level is broken, subsequent targets are 0.62349 and 0.62101.
A potential reversal scenario would be validated if the price recovers and sustains above the 0.63314 mark, which coincides with the 61.8% Fibonacci retracement level.

Wed 27th Nov 2024 CAD/CHF Daily Forex Chart Sell SetupGood morning fellow traders. On my Daily Forex charts using the High Probability & Divergence trading methods from my books, I have identified a new trade setup this morning. As usual, you can read my notes on the chart for my thoughts on this setup. The trade being a CAD/CHF Sell. Enjoy the day all. Cheers. Jim

"CADCHF: Bullish Divergence at Key 0.618 Fibonacci LevelCADCHF has formed a bullish divergence precisely at the 0.618 Fibonacci retracement level. This key technical setup suggests potential upward momentum

CADCHF: Long Trading Opportunity
CADCHF
- Classic bullish formation
- Our team expects growth
SUGGESTED TRADE:
Swing Trade
Buy CADCHF
Entry Level - 0.6275
Sl - 0.6250
Tp - 0.6324
Our Risk - 1%
Start protection of your profits from lower levels
❤️ Please, support our work with like & comment! ❤️

#CAD #CHF Long Set UpLooks like we will have short term reversal on 1H TF. I will long it on break of 0.62974
Entry 0.62974
Stoploss 0.62664
TP-1 0.63287
Tp-2 0.63594

CADCHF BUY1. Strong Economic Indicators for Canada
GDP Growth and Employment: The Canadian economy shows stable growth, with strong macroeconomic data like GDP and low unemployment supporting demand for the CAD.
Impact of Oil Prices: As a major oil exporter, the CAD is highly correlated with oil prices. When oil prices rise, the Canadian dollar typically appreciates, driving economic growth in Canada.
2. Technical Indicators for an Uptrend
Support on the Daily Chart: CAD/CHF may be at or near a strong support level, indicating a possible reversal and continuation of an uptrend.
Buy Signals from Indicators: Technical tools like RSI, MACD, and Bollinger Bands may signal an oversold zone with potential for an uptrend, which can be confirmed on platforms like TradingView.
3. Bank of Canada Policy Compared to the Swiss National Bank
Higher Interest Rates in Canada: The Bank of Canada’s rate-hiking policy supports the Canadian dollar, making it more attractive compared to currencies like the Swiss franc.
Weak Position of CHF: The Swiss National Bank traditionally maintains low-interest rates to keep the franc weak, especially when global markets are stable and there is less demand for safe-haven assets.
4. Stronger Risk Appetite in Global Markets
Less Demand for CHF as a "Safe-Haven": Under positive global economic conditions, the Swiss franc loses its appeal as a safe asset, creating an opportunity for CAD to appreciate against CHF.
Higher Interest in Higher-Yielding Assets: Due to Switzerland’s low-rate policies and lower returns, CHF may be less attractive when there’s increased interest in higher-yielding currencies like CAD.
Conclusion
Buying CAD/CHF can be justified by Canada’s positive economic indicators, technical signals for a potential uptrend, and the differences in the interest rate policies of the two central banks.
Canadian dollar in massive bearish trend on 4hr TF this setup has been chosen based on indices as CXY is in a bearish trend and giving no signs of reversal so its good to look for good sell setup on shorter TFs

CAD CHF is on continuation of bearish phaseCAD CHF is on continuation of bearish phase
Seasonality trends are favoring the CHF, as CAD/CHF shows a downward trajectory. Commitment of Traders (COT) data indicates a decline in CAD/CHF, with non-commercial positioning suggesting potential strength for the CAD. However, overall sentiment from endogenous factors leans more in favor of the CAD than the CHF.
That said, CHF shows improvement in endogenous factors, driven by rising manufacturing activity, stronger services PMI figures, increased business confidence, and a growing money supply. In contrast, CAD's money supply growth is negatively impacting its endogenous outlook. On the exogenous front, CAD’s GDP is declining, further weighing on its prospects.
Overall, leading economic indicators, including endogenous and exogenous factors, along with the growth in CHF's real GDP (aligned with global GDP trends), collectively point to bearish momentum for CAD/CHF.

Potential bullish rise?CAD/CHF has reacted off the pivot which has been identified as an overlap support and could rise to the 38.2% Fibonacci resistance.
Pivot: 0.62743
1st Support: 0.62401
1st Resistance: 0.63198
Risk Warning:
Trading Forex and CFDs carries a high level of risk to your capital and you should only trade with money you can afford to lose. Trading Forex and CFDs may not be suitable for all investors, so please ensure that you fully understand the risks involved and seek independent advice if necessary.
Disclaimer:
The above opinions given constitute general market commentary, and do not constitute the opinion or advice of IC Markets or any form of personal or investment advice.
Any opinions, news, research, analyses, prices, other information, or links to third-party sites contained on this website are provided on an "as-is" basis, are intended only to be informative, is not an advice nor a recommendation, nor research, or a record of our trading prices, or an offer of, or solicitation for a transaction in any financial instrument and thus should not be treated as such. The information provided does not involve any specific investment objectives, financial situation and needs of any specific person who may receive it. Please be aware, that past performance is not a reliable indicator of future performance and/or results. Past Performance or Forward-looking scenarios based upon the reasonable beliefs of the third-party provider are not a guarantee of future performance. Actual results may differ materially from those anticipated in forward-looking or past performance statements. IC Markets makes no representation or warranty and assumes no liability as to the accuracy or completeness of the information provided, nor any loss arising from any investment based on a recommendation, forecast or any information supplied by any third-party.

CAD/CHF BULLS WILL DOMINATE THE MARKET|LONG
Hello, Friends!
CAD/CHF pair is in the uptrend because previous week’s candle is green, while the price is evidently falling on the 4H timeframe. And after the retest of the support line below I believe we will see a move up towards the target above at 0.633 because the pair is oversold due to its proximity to the lower BB band and a bullish correction is likely.
✅LIKE AND COMMENT MY IDEAS✅
