CADCHF ShortThis instrument is also similar to the USDJPY (not saying they are correlated in anyway), since my analysis is telling to go short on this pair, then, this is what i am expecting; a bearish engulfing bar from the current forming candlestick.
CADCHF trade ideas

CADCHF: Consolidation & IndecisionThe current situation on CADCHF is quite unusual as the price is consolidating within a narrow horizontal trading range. The resistance levels are between 0.6280 and 0.6294, while the support levels are between 0.6263 and 0.6249.
To predict a bearish trend continuation, we should wait for a bearish breakout below the support range, with a 4-hour candle closing below it to confirm the breakout. This could lead to a further decline towards the 0.619 level.
On the other hand, to anticipate a bullish move, we need a 4-hour candle closing above the resistance range. This could signal a bullish continuation towards 0.634.
It is recommended to wait for a breakout and then follow the market trend accordingly.

CADCHF Will Go Down From Resistance! Short!
Please, check our technical outlook for CADCHF.
Time Frame: 12h
Current Trend: Bearish
Sentiment: Overbought (based on 7-period RSI)
Forecast: Bearish
The market is on a crucial zone of supply 0.626.
The above-mentioned technicals clearly indicate the dominance of sellers on the market. I recommend shorting the instrument, aiming at 0.612 level.
P.S
Please, note that an oversold/overbought condition can last for a long time, and therefore being oversold/overbought doesn't mean a price rally will come soon, or at all.
Like and subscribe and comment my ideas if you enjoy them!

CADCHF possible sell predictionOverall trend is bearish, price did a pullback, now price broke suppport, indicatng a possible continuation in the bearish overall trend. Price did a pullback into a sell zone for a possible sell activation.
Remember: Risk Management very important

CADCHF ShortPAIR:
💎4hr Short Signal
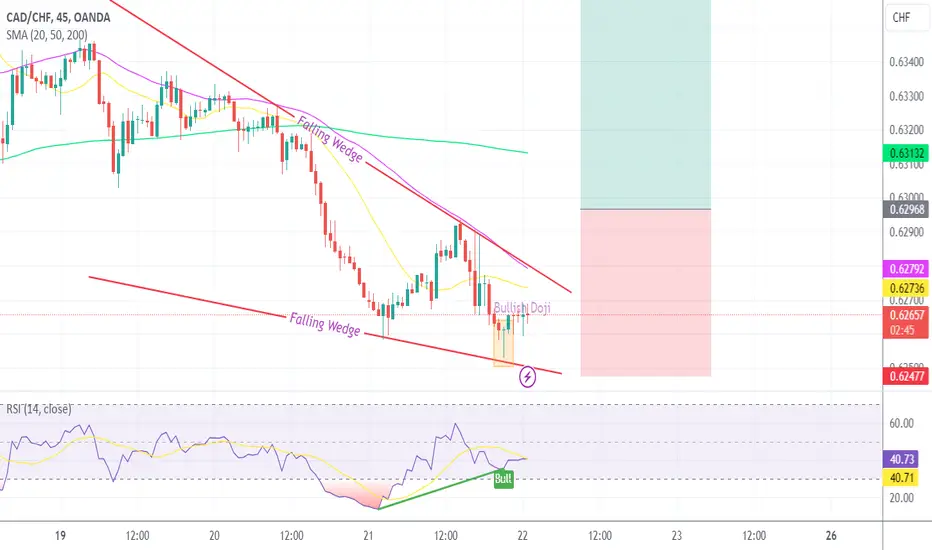
CADCHF has been breaking into new lows on our Weekly, Daily and now our 4hr entry time frame. and surfing below our 50/200 EMAs. Price has now had a pullback followed by a valid engulfing pattern. That makes this a good example of the 50ema Pullback Strategy.
🎯 ENTRY - 0.62753
✅ TAKE PROFIT - 0.62276
🔴 STOP LOSS - 0.62912

CAD/CHF Swing short positon.Market failed to continue go up after it closed to PDL or where the ChoCh is.
Plus the fundamental (Canada is planning to cut interest rates)
Wait for another pullback to enter the market.

CadChf could see some downside if Chf strengthensHello fellow traders , my regular and new friends!
Welcome and thanks for dropping by my post.
Do check out my recorded video (in trading ideas) for the week to have more explanation in place.
Do Like and Boost if you have learnt something and enjoyed the content, thank you!
-- Get the right tools and an experienced Guide, you WILL navigate your way out of this "Dangerous Jungle"! --
*********************************************************************
Disclaimers:
The analysis shared through this channel are purely for educational and entertainment purposes only. They are by no means professional advice for individual/s to enter trades for investment or trading purposes.
*********************************************************************

CADCHFlooking to enter a 3 Position if price breaks the 1h Timeframe Support.
CHF Currency still looking bullish
CAD Currency still looking bearish

CADCHF SELLCADCHF to go down, weak for some reason and i would never want to guess why, God is Good, and money has been presented to be made. Boowez.

CAD/CHF 4hrs ( sell Trade Target Range 150 PIP ) Pair Name : CAD/CHF
Time Frame : 4hrs Chart / Close
Scale Type : Large Scale
------
spreading knowledge among us and to clarify the most importan+t points of entry, exit and entry with more than 5 reasons
We seek to spread understanding rather than make money
Key Technical / Direction ( Short )
Type : Mid Term Swing
———————————
Bearish Break
0.62800 Area
Reasons
- Major Turn level
- Visible Range Lvn
- inner Pattern Break
- Week / Day low
- Fibo Golden
- Fixed Poc
Bullish Reversal
0.61000 Area
Reasons
- Major Turn level
- Visible range hvn
- pattern Target
- Fibo Golden
- Choch Zone


cadchfcadchf is at the bottom of the downtrend and has broken and tested the support zone. I set the top of this support zone as sl and opened a sell position.


CADCHF: Important Breakout 🇨🇦🇨🇭
CADCHF broke and closed below a key intraday/daily support.
The broken structure and a trend line will compose a resistance cluster now.
Probabilities will be high that the price will drop lower.
Next supports: 0.6248 / 0.621
❤️Please, support my work with like, thank you!❤️

CADCHF Strong buy signalThe CADCHF pair offered us an excellent sell signal last time we looked into it (July 02, see chart below) as trading within a Channel Down pattern, it was rejected on its 1D MA50 (blue trend-line) and hit our 0.63100 Target:
The Channel Down priced its new Lower Low, even broke momentarily below its bottom aggressively, and now seems to have recovered. The recent pull-back offers a good opportunity to enter this confirmed uptrend, which is technically the new Bullish Leg of the Channel Down.
Our Target is 0.65000, firmly below the 0.786 Fibonacci retracement level of the previous Lower High of the Channel, which is where both Lower Highs so far have been priced.
-------------------------------------------------------------------------------
** Please LIKE 👍, FOLLOW ✅, SHARE 🙌 and COMMENT ✍ if you enjoy this idea! Also share your ideas and charts in the comments section below! This is best way to keep it relevant, support us, keep the content here free and allow the idea to reach as many people as possible. **
-------------------------------------------------------------------------------
💸💸💸💸💸💸
👇 👇 👇 👇 👇 👇

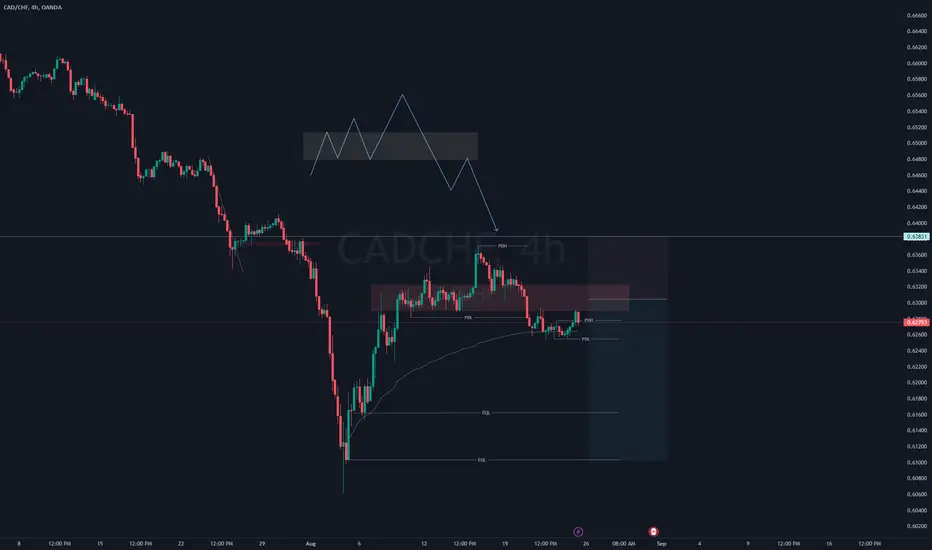
CADCHF Shortif you guys do remember on my first and last post on this instrument, i got in when i had the head and shoulders pattern formation in my zone and as a result of the execution the market finally stopped me out in sl. but right now my bias is that i am still looking for a short opportunity on the same pair, and the zones i greyed out are the ones i am interested in, so i will keep my eyes on the chart, waiting again for the setup to come to me and then look for my entry criterium before the execution.

CADCHFLooking to sell CAD CHF
Price is continuing with the Daily downtrend.
on the 4H Time Frame a Impulsive move to the downside is already visible.

CADCHFExpecting bullish cad chf / based on cot report cad and chf are on extremes and taken prev. week low its time to fill the imbalance on buyside.

CADCHF BULLISH PredictionFollowing a very quick bearish move, CAD/CHF HUT A STRONG SUPPORT ARE ON THE MONTHLY TIMEFRAME. I anticipate that for the remainder of the year, our market will be robust. I would advise holding off on making a purchase on CACHF and instead BUY LIMIT AT 0.6832 (50% FIBBONACCI RETRACEMENT) IF YOU ARE NOT YET IN THE TRADE - TAKE AND HOLD!
DISCLAIMER:
Investment advisors or brokers/dealers are not affiliated with The Trading Channel, its proprietor, or any of its staff members. Your individual trading and investment decisions are your responsibility. This is just my prediction about the market's response based on historical data. This is not a place for financial advice.

Cadchf Cadchf is down trend so we just follow de trend and we don't trade against the trend so we look for more sell positions after a retracment
