cadchf buy tradeSure! Here's a bullish technical analysis for the CAD/CHF pair on the 4-hour (H4) chart:
### **Trend Analysis**
- **Current Trend**: The CAD/CHF pair is showing signs of a potential **uptrend**. Recent price action indicates higher lows and higher highs².
- **Support and Resistance**: Key support levels are around **0.6600** and **0.6550**, while resistance levels are near **0.6700** and **0.6750**².
### **Technical Indicators**
- **Moving Averages**: The 50-period moving average is starting to slope upwards, and the price is trading above both the 50-period and 200-period moving averages, indicating bullish momentum².
- **Relative Strength Index (RSI)**: The RSI is currently around **60**, suggesting that the pair has room to move higher before becoming overbought².
- **MACD**: The MACD line is above the signal line, and both are above the zero line, which is a bullish signal².
### **Chart Patterns**
- **Bullish Divergence**: A bullish divergence has formed on the MACD, indicating potential upward movement².
- **Ascending Triangle**: The pair is forming an ascending triangle pattern, which is a bullish continuation pattern.
### **Outlook**
- **Bullish Bias**: Given the current indicators and chart patterns, the outlook for CAD/CHF on the H4 chart is bullish.
CADCHF trade ideas

CADCHF SELLlooking at the chart we made a high swept the high then made a low we enter off the breaker cus we have displacement IMB FVG we target the closest liquidity or 1:2RRR stops at the third candle of the FVG lets see what happens

CAD/CHF FOR BUY
CAD/CHF analysis
1- An ascending trend line and full respect for the line
2- The emergence of strong demand areas
3- The appearance of divergence
⚠️ This analysis is without any responsibility on us and you enter at your own risk ⚠️


Cadchf selling areaOur last week cadchf buying idea already running 200 pips
More expected till supply zone and downtrend area
Overall trend still bearish but we will wait for selling confirmation

Cadchf, look for buys.The buys happening now is a pullbck on the weekly timeframe. S.L and TP have been indicated.


CADCHF-SHORTCadchf is trading in a bearish trend,on daily timefram it is almost completing its retracement,price is in between 0.618 and 0.5 fib levels so we will take a sell trade from here

CADCHF Bullish The Price is supporting the upper trend line and now looks to be side ways and the trend can be bullish with Fibonacci 50 % .

CADCHF FOR BUYPrice broke out of the weekly support, wait for retest and bullish candlestick pattern on the zone.

CADCHF Bearish H&S 4HR Chart still a fair way a way!CADCHF_2024-08-16_01-03-42_72725.png
CADCHF is very weak on Daily & Weekly timeframes price is well below 200ema & 50ema so very bearish on longer t/f's although price is trying to jump from its very low lows yearly.
Head n Shoulders setup to watch on 4hr t/f & is still about 1% further drop to neckline. May play out later this afternoon in New York session.
Cheers
Chris

CADCHF SWING SETUPDue to the risks associated with conflict and recession rumours in the US, investors turn to safe-haven currencies like the Euro and Swiss franc, leading to their appreciation. However, the CHF is currently adhering to a downtrend line, suggesting a potential for bullish movement.
TP and SL are marked.
Swing Setup might require to hold to weeks or months
Risk no more than 1%
Check our other swing setups

CADCHF-LEADER IN CHF WICK FILL9/10YR:Tested and Rejected the Support,
1YR Formed 1-2 RTM , and expecting current 1 year bar to close bulling,
On small timeframe, needs Double top to complete, forming a Divergence to start the Bullish Movement

CADCHF ShortGot to the system now to find another sweet selling opportunity on this pair, my bias stuck to selling because of the chart pattern i am currently seeing on the pair (head and shoulders) which could possibly result to the crash of this particular instrument.
PS: Scroll a little downward you will realized i already posted about this pair for a short opportunity which i was unable to find my entry for that day, but now the opportunity has presented itself. 😍😍😍
NB: This does not means the trade will surely win, 😂 that is the funny thing about forex.

FvgWe see market had made a left shoulder then made a high then the dropped leaving imbalance, then came to fill in the fvg now continuing with the short


Easy +50 Pips On CAD/CHF , Did You Enter ? Here Is our first +50 Pips From this trade , if we can stay below this Res For Today and tomorrow , the price will go down hard
This Is An Educational + Analytic Content That Will Teach Why And How To Enter A Trade
Make Sure You Watch The Price Action Closely In Each Analysis As This Is A Very Important Part Of Our Method
Disclaimer : This Analysis Can Change At Anytime Without Notice And It Is Only For The Purpose Of Assisting Traders To Make Independent Investments Decisions.

$CADCHF | Buy Trade | Market Exec |Technical Confluences:
- Price action is close to the 50% Fibo extension from the beginning of time
- Price action is bouncing off a strong Demand Zone to prevent a new all-time low
Fundamental Confluences:
- Higher interest rate environment compared to CHF will induce re-opening of carry trade positioning
- Canada being an oil commodity nation, will have the strength of oil to keep their GDP sustainable
- Even if the global economy weakens, oil will likely maintain it's pricing with OPEC and OPEC+ holding back supply
________________________________
Putting on a Long position in OANDA:CADCHF (1st Entry)
________________________________
Boosts 🚀, Follows ✌️, Shares 🙌 & Comments ✍️ are much appreciated!
If you have any ideas or charts, do share them in the 'Comments' section below and we can discuss our perspectives to improve or strengthen our strategies.
If you want something analyzed, do drop me a DM. :D
________________________________
Disclaimer: The above suggestion is an personal opinion in general and does not constitute as investment advice. Any decisions taken based on the above suggestion is purely your own risks. DYOR.

Best Place To Short CAD/CHF To Get 200 Pips ! Ready For It ?The Price At Very Important Res Area That Was A Great Support For This Pair For Long Time So I Think It Will Push The Price To DOWNSIDE Very Hard In The Next Few Days If We Can Close Below It Today And Tomorrow .
This Is An Educational + Analytic Content That Will Teach Why And How To Enter A Trade
Make Sure You Watch The Price Action Closely In Each Analysis As This Is A Very Important Part Of Our Method
Disclaimer : This Analysis Can Change At Anytime Without Notice And It Is Only For The Purpose Of Assisting Traders To Make Independent Investments Decisions.

CADCHF - Finding Support in a Bullish ChannelCADCHF has appeared to reverse after a recent downtrend and is finding support on the previous down trendline.
It may continue to walk back down along the trendline but this is more likely a retracement in an uptrend.

CADCHF bullish ideaIt is based onn the trend, channel, weekly chart, T/P Daily S/R, Bullish Flag on Daily

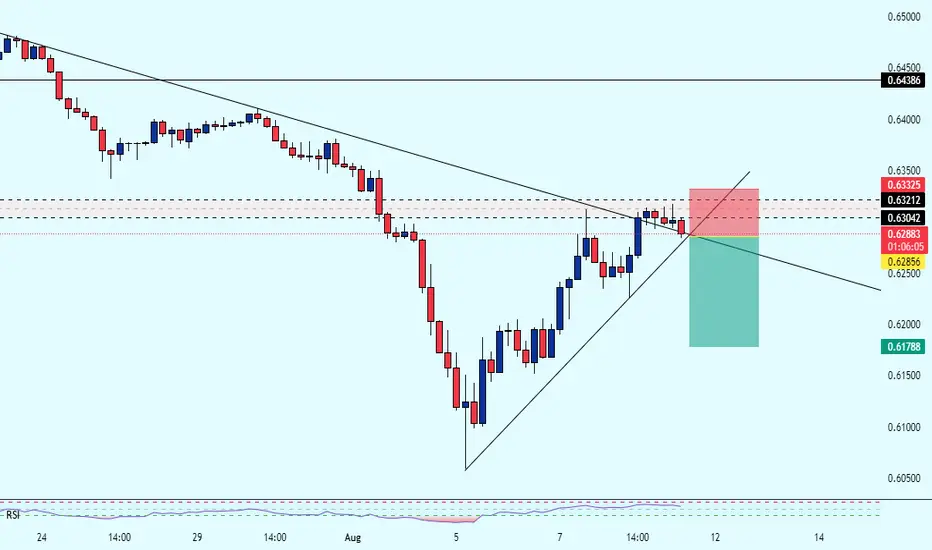
CAD_CHF BEARISH BIAS|SHORT|
✅CAD_CHF price grew again
To retest the resistance of 0.6327
But it is a strong key level
So I think that there is a high chance
That we will see a bearish move down
SHORT🔥
✅Like and subscribe to never miss a new idea!✅

CADCHF ShortAfternoon from this side guys, here is my take on this pair. i am looking to go short on this particular instrument because of where the market is at, and in confluence to my level i can see a pattern of double top being printed by the candles. so currently i am waiting for the current candle to signal my entry in the next few hours.