CADCHF in bullish trend CADCHF in bullish trend potentially printing a walling channel, entry with a sell limit, RR 1:1
CADCHF trade ideas

CAD/CHF Technical Analysis – Bullish Reversal from Key Support CAD/CHF Technical Analysis – Bullish Reversal from Key Support Zone 🟢📈
📅 Date: June 1, 2025
📊 Pair: CAD/CHF
🕰️ Timeframe: Daily (D1)
📌 Key Observations:
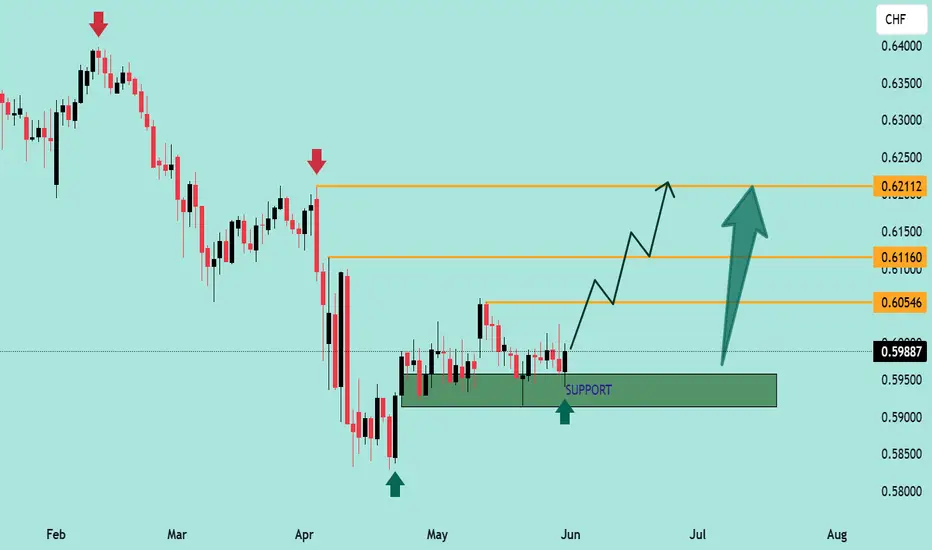
🟩 Strong Support Zone (0.5900 - 0.5950):
Price has consistently respected this demand zone since early May.
Multiple bullish rejections (green arrows) indicate strong buying interest.
📉 Previous Downtrend:
The market was in a clear bearish trend from February through April, forming lower highs and lower lows (red arrows mark swing highs).
🔁 Consolidation Phase:
Price has been ranging sideways for several weeks around the 0.5950 area, forming a base of accumulation.
📈 Bullish Scenario & Target Zones:
💥 A bullish breakout appears likely from the consolidation zone.
🚀 Upside Targets:
0.60546 – First minor resistance & potential take-profit level 🟠
0.61160 – Intermediate resistance and previous structural level 🟠
0.62112 – Major resistance and final bullish target for this swing 🟠
📈 Projection Path: The chart outlines a stair-step bullish structure with higher highs and higher lows, showing a probable path to 0.62112.
🧠 Conclusion:
CAD/CHF is showing signs of bullish reversal from a well-defined support zone. As long as price holds above 0.5950, we expect progressive upward movement toward the 0.6210 zone. Traders should monitor for bullish breakouts and potential confirmations with volume or candlestick patterns. 🔍📊
📌 Risk Management Tip:
Always use stop-loss below the support zone (~0.5900) and adjust positions as targets are reached.
Cadchf June 1We are currently in a sideway market on the daily timeframe so we have to see break out of the zone either to the upward side or downward side.

CAD-CHF Bearish Wedge! Sell!
Hello,Traders!
CAD-CHF formed a bearish
Wedge pattern and now we
Are seeing a powerful breakout
Which is confirmed so we are
Locally bearish biased and
We will be expecting a
Further bearish move down
Sell!
Comment and subscribe to help us grow!
Check out other forecasts below too!
Disclosure: I am part of Trade Nation's Influencer program and receive a monthly fee for using their TradingView charts in my analysis.

AUD/NZD💰Symbol: { AUD/NZD }
🟩Price: { 0.60080 & 0.60000 }
🟥Stop: { 0.60375 }
1️⃣profit: { 0.59650 }
2️⃣profit: { 0.59370 }
3️⃣profit: { 0.59090 }
4️⃣profit: { 0.58700 }
5️⃣profit: { 0.58350 }
📊Check your chart before entering.
🚨Check before use to make sure there is no important news.🚨

CADHCHFCADCHF
Buy. Market Execution. trade 1:2. risk 0.25%
We entered Buy because the market is respecting the Buyers' zone.

Price action Cadchf done swiping liquidity aiming for the low as the candle close above liquidity as back to the downside

CADCHF 27/05/2025Weekly:
-Liqudity sweep.
-Unmitigated FVG above.
Daily:
-Bullish M pattern.
-Inverse H&S pattern.
4H:
-Bullish M pattern.
-Inverse H&S pattern.
-IC.

CADCHF Will Go Higher! Long!
Take a look at our analysis for CADCHF.
Time Frame: 9h
Current Trend: Bullish
Sentiment: Oversold (based on 7-period RSI)
Forecast: Bullish
The market is on a crucial zone of demand 0.599.
The oversold market condition in a combination with key structure gives us a relatively strong bullish signal with goal 0.605 level.
P.S
The term oversold refers to a condition where an asset has traded lower in price and has the potential for a price bounce.
Overbought refers to market scenarios where the instrument is traded considerably higher than its fair value. Overvaluation is caused by market sentiments when there is positive news.
Disclosure: I am part of Trade Nation's Influencer program and receive a monthly fee for using their TradingView charts in my analysis.
Like and subscribe and comment my ideas if you enjoy them!

CADCHF BUY OPPORTUNITY IS STILL VALIDI anticipate a buy opportunity in CAD/CHF from the current market price. CAD is likely to grow in strength over CHF as price recently found support at 0.58427 a buy opportunity is envisaged.

CADCHF Set To Fall! SELL!
My dear followers,
This is my opinion on the CADCHF next move:
The asset is approaching an important pivot point 0.6003
Bias - Bearish
Technical Indicators: Supper Trend generates a clear short signal while Pivot Point HL is currently determining the overall Bearish trend of the market.
Goal - 0.5968
About Used Indicators:
For more efficient signals, super-trend is used in combination with other indicators like Pivot Points.
Disclosure: I am part of Trade Nation's Influencer program and receive a monthly fee for using their TradingView charts in my analysis.
———————————
WISH YOU ALL LUCK

Potential Long Opportunity on CADCHFReasons I think this pair will rise:
- Confirmed Trend line printed a higher low
- Confirmed trend line means harder break out
- Bullish divergence on H4
- RSI over sold on H4
What do you think?

CAD/CHF Ready to Explode – Smart Money is Loading Up
CAD/CHF is showing clear signs of a bullish reversal.
Last week, the price broke below the previous support level — a classic liquidity grab. Retail traders got trapped in shorts, but price quickly snapped back, confirming it was a fakeout.
This type of move is a smart money play — liquidate weak hands, then reverse with force.
We are now at the turning point.
The structure on the daily and weekly timeframes is bullish. The higher low is confirmed. From my perspective, this pair is ready to rally.
🎯 Target:
0.60600 — the previous swing high.
That’s the minimum target. On the long-term chart, this pair could go even higher.
Stop loss:
0.59290 - leaving room for fake movements. structure invalidation.
🧭 What to Watch:
Trump trade deal updates and geopolitical news that could spike CHF volatility.
Possible continuation patterns early next week on the 4H chart.

CAD/CHF "Loonie vs Swiss" Forex Bank Heist Plan (Scalping/Day)🌟Hi! Hola! Ola! Bonjour! Hallo! Marhaba!🌟
Dear Money Makers & Robbers, 🤑 💰💸✈️
Based on 🔥Thief Trading style technical and fundamental analysis🔥, here is our master plan to heist the CAD/CHF "Loonie vs Swiss" Forex market. Please adhere to the strategy I've outlined in the chart, which emphasizes long entry. Our aim is the high-risk MA Zone. Risky level, overbought market, consolidation, trend reversal, trap at the level where traders and bearish robbers are stronger. 🏆💸"Take profit and treat yourself, traders. You deserve it!💪🏆🎉
Entry 📈 : "The vault is wide open! Swipe the Bullish loot at any price - the heist is on!
however I advise to Place buy limit orders within a 15 or 30 minute timeframe nearest or swing low or high level for pullback entries.
Stop Loss 🛑:
📍 Thief SL placed at the recent/swing low level Using the 1H timeframe (0.58600) Day/Scalping trade basis.
📍 SL is based on your risk of the trade, lot size and how many multiple orders you have to take.
Target 🎯: 0.61100
💰💵💸CAD/CHF "Loonie vs Swiss" Forex Bank Heist Plan (Scalping/Day) is currently experiencing a bullishness,., driven by several key factors. ☝☝☝
📰🗞️Get & Read the Fundamental, Macro, COT Report, Quantitative Analysis, Sentimental Outlook, Intermarket Analysis, Future trend targets and Overall outlook score..., go ahead to check 👉👉👉🔗
⚠️Trading Alert : News Releases and Position Management 📰 🗞️ 🚫🚏
As a reminder, news releases can have a significant impact on market prices and volatility. To minimize potential losses and protect your running positions,
we recommend the following:
Avoid taking new trades during news releases
Use trailing stop-loss orders to protect your running positions and lock in profits
📌Keep in mind that these factors can change rapidly, and it's essential to stay up-to-date with market developments and adjust your analysis accordingly.
💖Supporting our robbery plan 💥Hit the Boost Button💥 will enable us to effortlessly make and steal money 💰💵. Boost the strength of our robbery team. Every day in this market make money with ease by using the Thief Trading Style.🏆💪🤝❤️🎉🚀
I'll see you soon with another heist plan, so stay tuned 🤑🐱👤🤗🤩

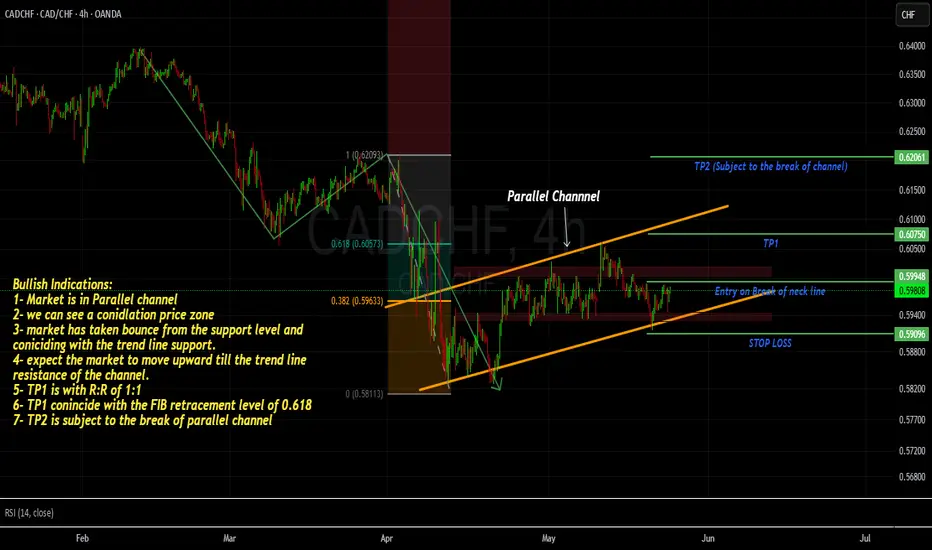
CADCHF - Holistic View of Bullish RUN ! As you can see market has beautifully played a HH and HL formation in bigger picture. Now market is moving in a parallel channel and it seems like, market is taking a correction move of the LEG AB uptil FIb level of 0.618 before again continuing in a bearish run.
Trade plan is to look for the buy opportunity. we can plan trade with a entry on break of neck line as mentioned, once the entry is triggered we can plan TP with 1:1 and stop loss below HL / trendline / support level.
if the channel is broken, we can set TP2 as defined in the chart.
CadchfWe are going down normally but the yellow bar is currently holding it.so after the break of that yellow bar we sell upon retest with good candlestick patterns

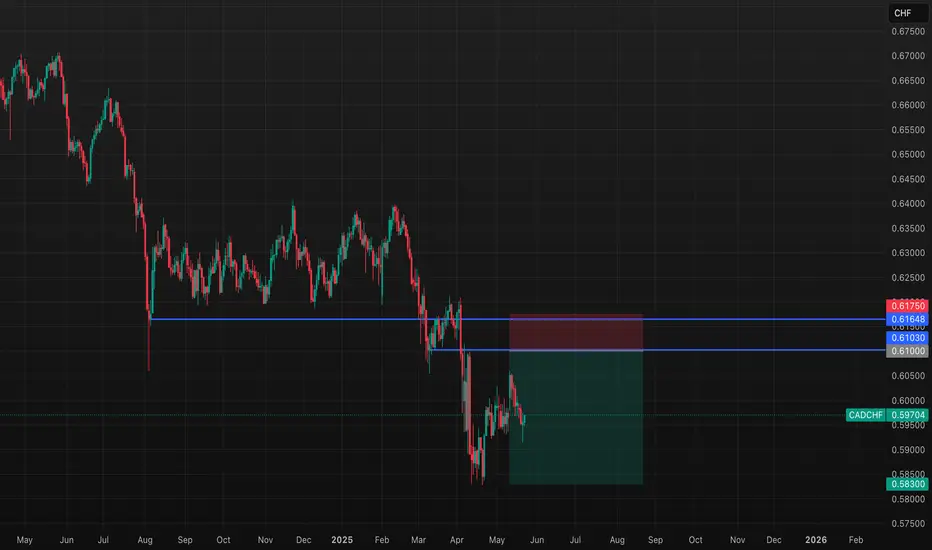
Bearish Rejection Zone in CAD/CHF with High Reward Potential Tow✅ Technical Confirmations Based on D1 & H4 Charts
Sell Zone: Between 0.61030 and 0.61648, previously acting as strong support and now serving as key resistance.
Bearish Structure: Clearly visible on both timeframes with a consistent pattern of lower highs and lower lows.
Current Consolidation: A forming triangle or sideways box suggests a potential accumulation before the next bearish leg.
Favorable Risk/Reward: The broader structure supports a more aggressive target, with technical room for price to reach the 0.57000s if the bearish momentum continues.
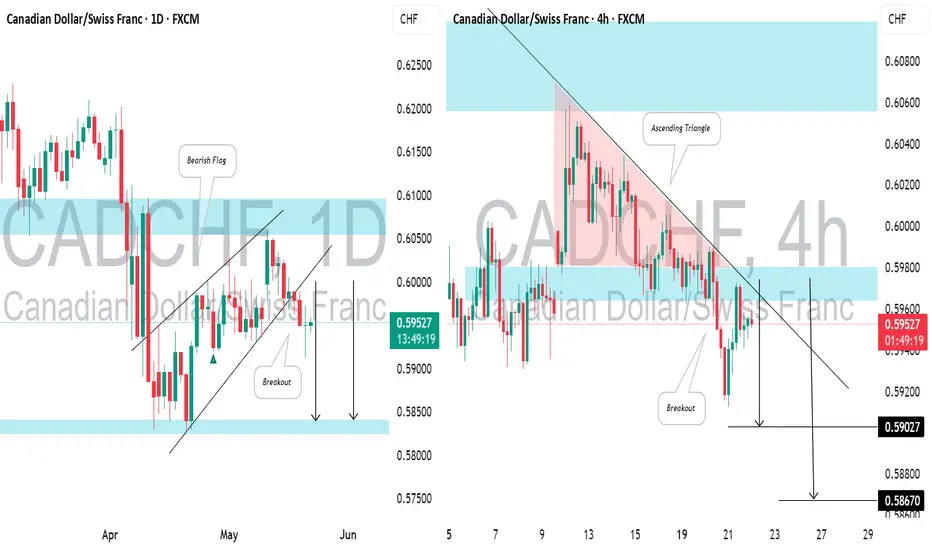
CADCHF: Bearish Continuation After BreakoutCADCHF appears to be in a bearish trend following a retest of a recently breached daily key horizontal support, along with a confirmed breakout of a support line of a bearish flag pattern.
On the 4-hour chart, a descending triangle pattern was formed, and the neckline has been broken.
There is a strong likelihood that the price will continue to decline, potentially reaching at least 0.5902 before hitting the support level.
CADCHF- Another way to Look at BULLISH BIAS - 5 Strong Reasons Strong confluences on 1D time frame for the Bullish BIAS on this pair.
1- RSI divergence
2- Formation of HH and HL
3- Bullish Trend Line
4- Hammer Candle stick pattern formation
5- Double Bottom
we anticipate the market to remain in Bull phase.
Entry point is market with TP1 and TP2 as R:R of 1:1 and 1:2 respectively. Keep you Stop loss slightly below the Double Bottom (Support line)
CADCHF - Potential Buy (Day Trading)Hi Traders,
My view on BUYING CMCMARKETS:CADCHF
Price Action Analysis:
On the 4-hour timeframe, the market is currently in a clear downtrend. At this stage, there is no sign of buyers stepping in — price is still pushing lower without slowing down.
On the lower timeframes, there is no shift in momentum or structure break that would suggest buying pressure. As such, it's too early to consider a buy. We'll need to see price slow down, consolidate, or show a rejection from key support before any buy scenario becomes valid.
Good Luck

CADCHF update!!Good day traders, I’m back with yet another update on CadChf and if I can remember well I mentioned the first time I posted this setup that this one is special because it offer us opportunities to learn and get to see if what ICT(Micheal.J) says about his concepts true or not, for me they work!!
The first setup I posted here and the second one will both be tagged in the description below just to support my ideology and how I came about this setup. On the first setup there was a large wick that i stated should be considered as a Gap and we saw price close above it to balance that gap. And you move one TF higher on your weekly there you’ll see that price has failed multiple times to balance that weekly VI, back on our daily TF we can see that price did not fully trade through that 1st.PFVG and we want to see it come back to fully trade through the gap.
Overall bias is BUYSIDE LIQUIDITY!!

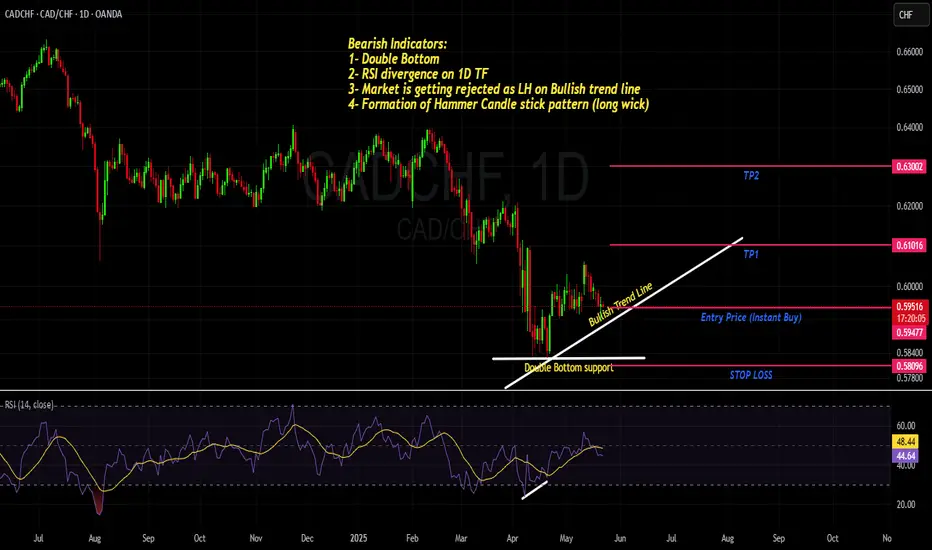
CADCHF - Sell Short - Trendline and Candle stick confluences. Market is making a series of LH and LLs- Market has rejected from trend line resistance. Bearish Engulfing candle formation is a strong confluence of market bearish trend.
we can instant enter in the market, SL would be slightly above Last confirmed LH and TPs would be with R:R of 1:1 and 1:2 respectively.

CADCHF: Pullback From Support 🇨🇦🇨🇭
There is a high chance to see a pullback from the underlined
daily horizontal support on CADCHF.
A formation of a high momentum bullish candle
after its test and a consolidation on an hourly time frame confirms
the strength of the buyers.
Goal - 0.595
❤️Please, support my work with like, thank you!❤️
I am part of Trade Nation's Influencer program and receive a monthly fee for using their TradingView charts in my analysis.
