EURCAD Buyers In Panic! SELL!
My dear friends,
My technical analysis for EURCAD is below:
The market is trading on 1.6005 pivot level.
Bias - Bearish
Technical Indicators: Both Super Trend & Pivot HL indicate a highly probable Bearish continuation.
Target - 1.5956
About Used Indicators:
A pivot point is a technical analysis indicator, or calculations, used to determine the overall trend of the market over different time frames.
Disclosure: I am part of Trade Nation's Influencer program and receive a monthly fee for using their TradingView charts in my analysis.
———————————
WISH YOU ALL LUCK
CADEUR trade ideas

EURCAD: Expecting Bearish Continuation! Here is Why
Balance of buyers and sellers on the EURCAD pair, that is best felt when all the timeframes are analyzed properly is shifting in favor of the sellers, therefore is it only natural that we go short on the pair.
Disclosure: I am part of Trade Nation's Influencer program and receive a monthly fee for using their TradingView charts in my analysis.
❤️ Please, support our work with like & comment! ❤️

EUR-CAD Bullish Wedge! Buy!
Hello,Traders!
EUR-CAD is trading in an
Uptrend and the pair formed
A bullish wedge pattern and
Now we are seeing a bullish
Breakout from the wedge so
We are bullish biased and we
Will be expecting a further
Bullish move up
Buy!
Comment and subscribe to help us grow!
Check out other forecasts below too!
Disclosure: I am part of Trade Nation's Influencer program and receive a monthly fee for using their TradingView charts in my analysis.

EURCAD (SMC BASED)TRADE SETUP EXPLANATION (SMC BASED):
PAIR: EURCAD
TIMEFRAME: 2H Chart (Entry Confirmation on 15M / 5M)
SETUP LOGIC (SMC STRATEGY):
BOS (Break of Structure) Confirmed — market is in bullish structure.
Price is retracing towards:
IMB (Imbalance zone)
POI 1H (Point of Interest - Demand Zone)
Liquidity (LIQ-$$$$) Sweep Expected Before Reaction.
TRIGGER CONDITION FOR ENTRY:
✅ After price enters the POI 1H Demand Zone, wait for:
→ CHoCH (Change of Character) confirmation on 15 min or 5 min timeframe.
→ CHoCH indicates buyers taking control after sweep and mitigation.
ENTRY PLAN:
🔹 Enter BUY trade after 15M / 5M CHoCH.
🔹 Stop Loss (SL) below POI zone.
🔹 Target previous high marked near 1.60296.
RISK-REWARD:
🎯 Aim for minimum 1:3 RR as visible on the chart.
KEY NOTES:
No entry directly at POI.
Entry only after confirmation (CHoCH) in lower timeframe.
Trade respects Smart Money Concepts (SMC) rules of BOS, Liquidity sweep, and POI reaction.

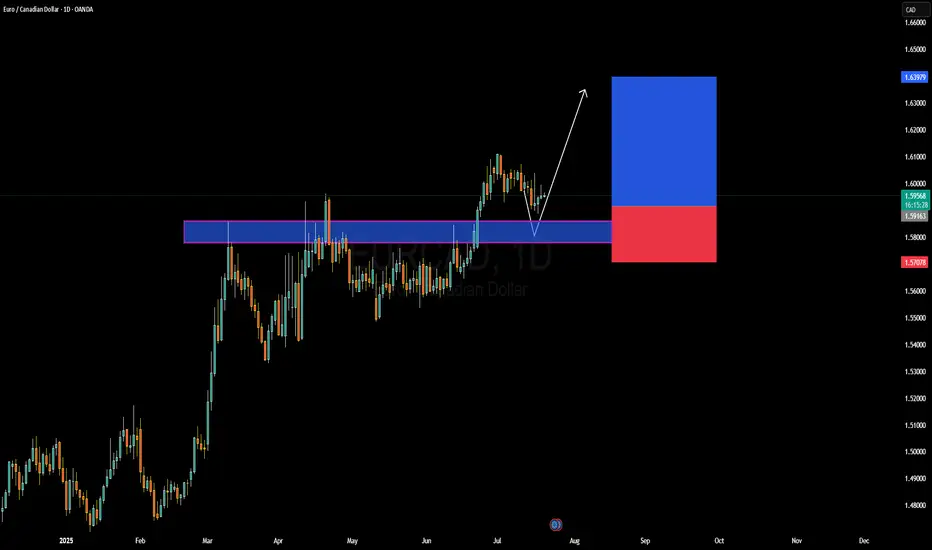
EURCAD Forming Bullish ContinuationEURCAD has recently respected a key demand zone and is now beginning to show early signs of bullish continuation. After a clean breakout above the 1.5900 resistance level earlier this month, price retested this structure and held strongly, creating a textbook bullish rejection wick. This price behavior suggests the pair is gearing up for another impulsive leg to the upside. I'm watching for follow-through momentum targeting the 1.6390–1.6400 zone in the coming weeks, aligning with the risk-to-reward setup visible on the chart.
From a fundamental perspective, the euro remains relatively supported following recent ECB comments signaling a more patient stance on future rate cuts. While inflation in the Eurozone has shown some signs of easing, policymakers remain cautious, especially with energy prices fluctuating again. On the other side, the Canadian dollar has been under pressure due to weaker-than-expected domestic growth and the Bank of Canada’s more dovish tone. Crude oil, which typically supports CAD, has been consolidating with no strong bullish drive lately, limiting CAD’s upside potential.
Technically, the current structure favors bullish continuation. The clean rejection from the previous resistance-turned-support, combined with bullish price action forming a higher low, reinforces the bullish setup. As long as the 1.5900 zone holds, this remains a high-probability long trade setup with potential to deliver strong profits in alignment with the trend.
Watch for daily closures above 1.6000 to confirm the next leg higher. Momentum indicators are flattening, and with liquidity sweeping both sides recently, it’s primed for a move. EURCAD remains on my radar for a swing buy opportunity, with the setup offering excellent technical confluence and favorable fundamental backing.
Sell eurcadStrong sell expected in next few weeks
Already too overbought in monthly and weekly time frame
Buy trend Already breaks and retested again
Strong selling area

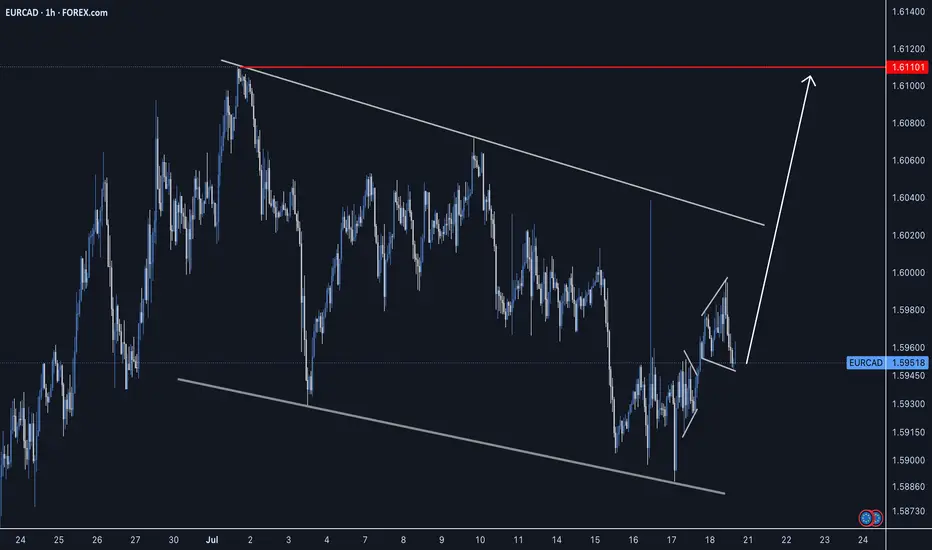
EURCAD looks great for buysOn the monthly timeframe, price recently broke and closed above a key resistance level, showing clear bullish direction in the bigger picture. The weekly chart confirms this bullish bias with a clean rejection of a strong Fibonacci support zone and weekly pivot area, highlighting solid buyer interest.
On the 4-hour chart, the pair broke out from a descending channel pattern, retested the breakout zone around the weekly pivot area, and bounced strongly. This re-test confirms buyer interest. Additionally, price is trading above both the 50 and 200 SMAs, indicating a strong bullish sentiment on lower timeframes.

BUY EURCAD now for 4h time frame bullish trend continuationBUY EURCAD now for 4h time frame bullish trend continuation ...............
STOP LOSS: 1.5933
This buy trade setup is based on hidden bullish divergence trend continuation trading pattern ...
Always remember, the trend is your friend, so whenever you can get a signal that the trend will continue, then good for you to be part of it
TAKE PROFIT : take profit will be when the trend comes to an end, feel from to send me a direct DM if you have any question about take profit or anything...
Remember to risk only what you are comfortable with... trading with the trend, patient and good risk management is the key to success here


EUR/CAD a potential leg up formingEUR/CAD trend line seems to be holding. look for a entry signal up after pull back. 14 ema and 34 ema may offer resistance on 15 min chart. monitor volume decrease on pull back and spike for upward force and continuation

EUR/CAD ADDED TO WATCHLISTLike the other Euro markets this one is falling hard, we are watching for a possible reversal pattern to show up. Momentum is very low so we could see a rubber band effect here. Keep watching.


Daily outlook 7-28-25Daily outlook 7-28-25 - in this outlook i will tel my friend what i am gonna trade for today.

EURCAD LONG SETUP H4: 28 JULY - 1 AUGUST 2025✅ EUR/CAD Trade Plan (4H Timeframe)
🔍 Bias: Bullish
🧠 Why Buy EUR/CAD?
Reason Details
📊 COT Data
Institutions are 66.9% long EUR and 80.19% short CAD
👥 Retail Sentiment
87% of retail traders are short (contrarian signal = bullish)
📈 Technical Setup
Breakout + retest of descending trendline and resistance = bullish continuation setup
🔍 Technical Analysis Summary
✅ Trend & Price Action
The pair broke out of a descending trendline, indicating a shift from a short-term downtrend to a potential uptrend.
📊 Key Levels
1. Resistance / Take Profit (TP) Target Zone:
Around 1.61500 – 1.62000
Marked in red as the TP TARGET, this is a supply zone.
The market may face selling pressure at this point.
2. Current Price Levels:
Price is trading around 1.6088, slightly below the local resistance at 1.6108.
3. Support / Buy Zone:
Between 1.60701 – 1.60884
This zone has previously acted as resistance and may now serve as support, aligning with the breakout retest.
4. Lower Support Levels:
1.59218 and 1.58883 are marked as potential deeper support if the breakout fails.
📈 Indicators and Patterns
Trendline Breakout: The descending black trendline has been broken, suggesting bullish momentum.
Pivot Levels (R1, R2, S1, etc.) are overlaid, providing additional confirmation of key support/resistance zones.
---
📌 Trading Plan (as per the chart)
Bullish Bias: The breakout and retest imply a long entry from the BUY ZONE (1.607 – 1.6088).
TP Target: Around 1.615 – 1.620
Invalidation Level: A break below 1.6070, or especially below 1.5921, may invalidate the setup and turn bias bearish.
📊 COT Data Analysis
EUR (Euro):
Long Positions: 66.9%
Short Positions: 33.1%
Δ Weekly: -1.11% (net longs reduced slightly)
🔎 Interpretation:
Institutions are still heavily long on the Euro, showing confidence in its strength.
However, there's a slight weekly decrease, possibly a bit of profit-taking or caution ahead of upcoming data.
---
CAD (Canadian Dollar):
Long Positions: 19.81%
Short Positions: 80.19%
Δ Weekly: +1.22% (shorts increased further)
🔎 Interpretation:
Institutions are extremely bearish on the Canadian Dollar.
The increase in short positions shows growing conviction that CAD will weaken.
🧮 Institutional Bias:
Bullish on EUR/CAD: Institutions are net long EUR and net short CAD, meaning they expect EUR/CAD to rise.
---
👥 Retail Sentiment (EUR/CAD):
Long: 13%
Short: 87%
🔎 Interpretation:
Retail traders are massively short on EUR/CAD.
This is a contrarian signal: retail traders are often on the wrong side of the market.
Smart money likely sees upside if retail is heavily short.
📌 Conclusion
All signals — COT, retail sentiment, and technical structure — point toward a bullish EUR/CAD outlook.
Institutions are buying EUR and shorting CAD, while retail traders are mostly short, potentially fueling a short squeeze if price rallies. Technically, the breakout and retest also support a bullish trade idea.

EURCAD--LONG--27_07_25--multi-timerfame bullish sentiment(Monthly,Weekly,Daily)
--TP1 is around 1.615, TP2 is upper side of ascending channel

EURCAD BUYS!Both entries still very much valid, we are bullish on the daily , first entry pushes to the upside to take out liquidity , then we target the imbalance in the market at the bottom, which then pushes the market to break our last daily high.

EUR_CAD LOCAL SHORT|
✅EUR_CAD is going up to retest
A horizontal resistance of 1.6110
Which makes me locally bearish biased
And I think that we will see a pullback
And a move down from the level
Towards the target below at 1.6077
SHORT🔥
✅Like and subscribe to never miss a new idea!✅
Disclosure: I am part of Trade Nation's Influencer program and receive a monthly fee for using their TradingView charts in my analysis.

EUR/CAD BULLISH BIAS RIGHT NOW| LONG
Hello, Friends!
Previous week’s red candle means that for us the EUR/CAD pair is in the downtrend. And the current movement leg was also down but the support line will be hit soon and lower BB band proximity will signal an oversold condition so we will go for a counter-trend long trade with the target being at 1.600.
Disclosure: I am part of Trade Nation's Influencer program and receive a monthly fee for using their TradingView charts in my analysis.
✅LIKE AND COMMENT MY IDEAS✅

Eurcad buyEurcad is looking like testing my dynamic support zone and a possible push back up is looming to next level upwards. 1.60407 for the next retest of resistance.

EUR/CAD make a fakeout and will soon decide its next trend.EURCAD recently made a faekout at the marked candle.
The candlestick pattern we can see is a Shooting Star. Yes, it does have a small wick at the bottom, but more or less looks like a Shooting Star.
After that, it fell right back into the channel. It's good to see that the channel is being respected.
Now, there's two possibilities that we're looking at for a trade.
Firstly, if we look at the Top Red trendline and the Green Trendline, we can see that there is a triangle formation. The price will decide if it wants to stay in the channel or not depending on how it reacts at the end of that triangle.
Next thing we look at is (assuming price respects the channel and continues down) that the price will start respect the big channel (Top Red trendline and Bottom Red Trendline) as it has been doing for a while now...
It's time to wait now and understand where price is going. In both possibilities, we have a trade which can be taken, but we must ensure that we have our rules and confluences in check before taking the trade.

Trade idea for EURCADThe sell-side liquidity at 1.58972 was purged, and now we target the buy-side liquidity at 1.60384. The potential entry zone is from CMP at 1.60016 with a stop loss at 1.59922. The 5-minute entry was taken based on the CISD strategy. Note the 1.59973 level; if this level is swept and not run through, then we can add more positions and maintain the same stop loss for larger rewards.

"EUR/CAD Price Pirate Mode: Long Entries Loading!"🔥🚨 "EUR/CAD BANK HEIST: The Ultimate Bullish Loot Grab! (Thief Trading Style) 🚨🔥
🌟 Greetings, Market Pirates & Profit Raiders! 🌟
(Hola! Oi! Bonjour! Hallo! Marhaba!)
The EUR/CAD "Euro vs Loonie" vault is WIDE OPEN—time to execute the Thief Trading Heist Plan! 🏦💰 Based on 🔥 high-probability technicals & stealthy fundamental analysis 🔥, here’s how we SWIPE THE LOOT before the bears catch on!
🎯 TRADE SETUP (Scalping/Day Heist)
📈 Entry (Bullish Raid):
"The vault door is cracked—enter anywhere!"
Pro Thief Move: Use buy limit orders near swing lows (15M/30M) for sneaky pullback entries.
Advanced Raid Tactics: Layer entries (DCA-style) for maximum loot efficiency.
🛑 Stop Loss (Escape Route):
Swing Low (4H) = 1.58800 (Adjust based on your risk tolerance & lot size!)
Thieves’ Golden Rule: "No heist is worth a jail sentence!" 🚔💨
🎯 Take Profit (Escape Before the Cops Arrive!):
Primary Target: 1.62300 (or exit early if resistance gets too hot!)
⚠️ Danger Zone: High-voltage resistance = Bear Trap Territory! ⚡🐻
💡 WHY THIS HEIST WILL WORK:
✅ Bullish Momentum Intact (Price structure favors buyers)
✅ Weak CAD Fundamentals (Loonie under pressure)
✅ Smart Money Algos Likely Pushing Higher (COT data hints at institutional bias)
📰 NEWS ALERT (Avoid the Market Police!)
🚨 Upcoming High-Impact Events?
Avoid new trades during news spikes!
Trailing stops = Your getaway car! 🚗💨
💥 BOOST THIS HEIST! (Let’s Get RICH Together!)
🔥 Hit the 👍 LIKE & 🚀 BOOST button to strengthen our robbery squad!
💬 Comment your entry & TP—let’s track the loot!
🔔 Follow for DAILY HEIST PLANS!
⚠️ DISCLAIMER (Stay Out of Jail!):
This is NOT financial advice—just a pirate’s treasure map! 🗺️
Manage risk like a pro thief—don’t blow your capital!
🚀 Ready to RAID? Let’s STEAL those pips! 🏴☠️💸

EURCAD - Long Setup - Impulse, Correction, ImpulsePrice action has been setting up for the next impulse phase as we can the bullish continuation is completing to indicate price has further growth. Looking for a long entry this upcoming week.
Good Luck