SHORT ON EUR/CADEUR/CAD has given us a nice CHOC (change of character) to the downside followed by a nice retest to supply.
I expect price to push up a little more into supply before dropping to the next support/demand level.
Looking to Catch 300-400 pips over the next few days.
CADEUR trade ideas

18.07.25 Morning ForecastPairs on Watch -
FX:GBPAUD
FX:EURAUD
FX:EURNZD
FX:EURCAD
A short overview of the instruments I am looking at for today, multi-timeframe analysis down to what I will be looking at for an entry. Enjoy!

HEAD & SHOULDER PATTERN SPOTTED IN EUR/CADHead & Shoulder Pattern Spotted in EUR/CAD – Bearish Trend Expected
The EUR/CAD pair has recently formed a Head & Shoulder (H&S) pattern, a classic reversal signal that often indicates a shift from an uptrend to a downtrend. This pattern, combined with the formation of lower lows, suggests increasing bearish momentum in the market.
Current Market Structure
Price action has been moving within a secondary (corrective) trend, which appears to be nearing its end. Once this phase completes, sellers are expected to regain control, pushing the pair downward. The recent lower lows reinforce the weakening bullish sentiment, increasing the likelihood of a bearish continuation.
Key Levels to Watch
- Resistance Level (1.61100): This level is critical for sellers. If price approaches this zone and gets rejected, it could confirm the bearish outlook and trigger a downward move.
- Support/Target (1.58000): If the bearish momentum strengthens, the pair could decline toward 1.58000, aligning with the measured move of the H&S pattern.
Conclusion
With the Head & Shoulder pattern and lower lows in place, EUR/CAD is showing signs of an impending bearish move. Traders should watch 1.61100 for resistance and 1.58000 as a potential downside target. A confirmed breakdown could present a strong selling opportunity in the coming sessions.

EURCAD: Long Signal with Entry/SL/TP
EURCAD
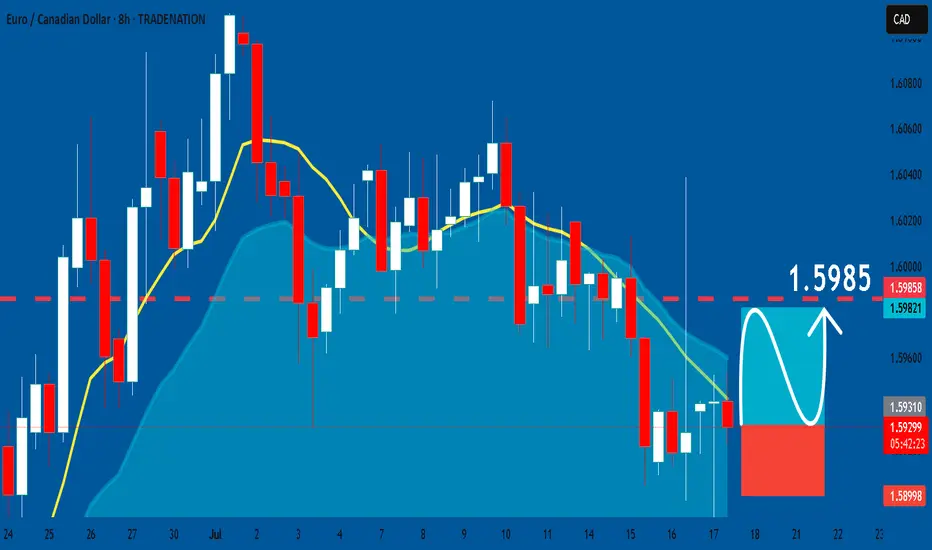
- Classic bullish pattern
- Our team expects retracement
SUGGESTED TRADE:
Swing Trade
Buy EURCAD
Entry - 1.5929
Stop - 1.5899
Take - 1.5985
Our Risk - 1%
Start protection of your profits from lower levels
Disclosure: I am part of Trade Nation's Influencer program and receive a monthly fee for using their TradingView charts in my analysis.
❤️ Please, support our work with like & comment! ❤️

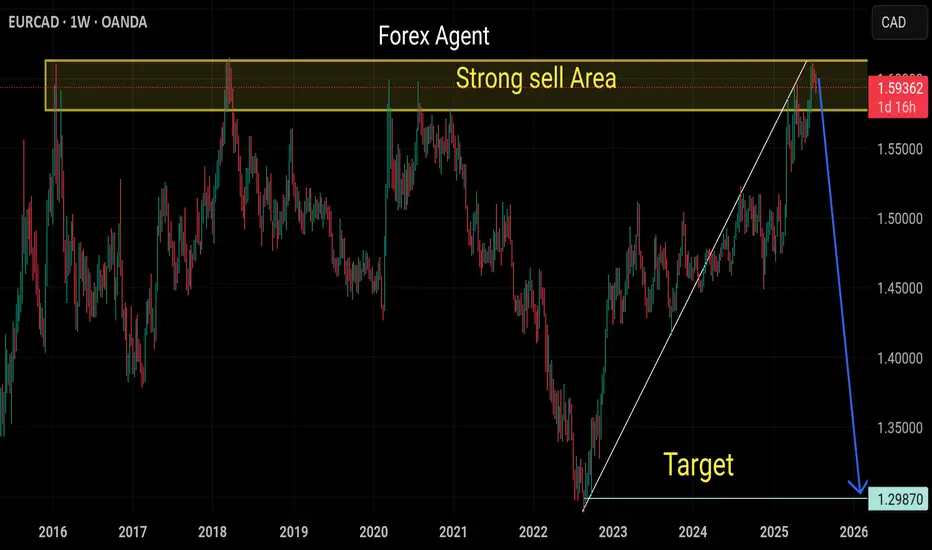
Sell eurcadStrongly sell expected from this marked area
Monthly and weekly overbought pair
Ready for the bearish correction now
Daily and weekly trend breaks and retested
EURCAD Short Trade OANDA:EURCAD Short trade, with my back testing of this strategy, it hits multiple possible take profits, manage your position accordingly.
This is good trade, don't overload your risk like greedy, be disciplined trader, this is good trade.
Use proper risk management
Looks like good trade.
Lets monitor.
Use proper risk management.
Disclaimer: only idea, not advice

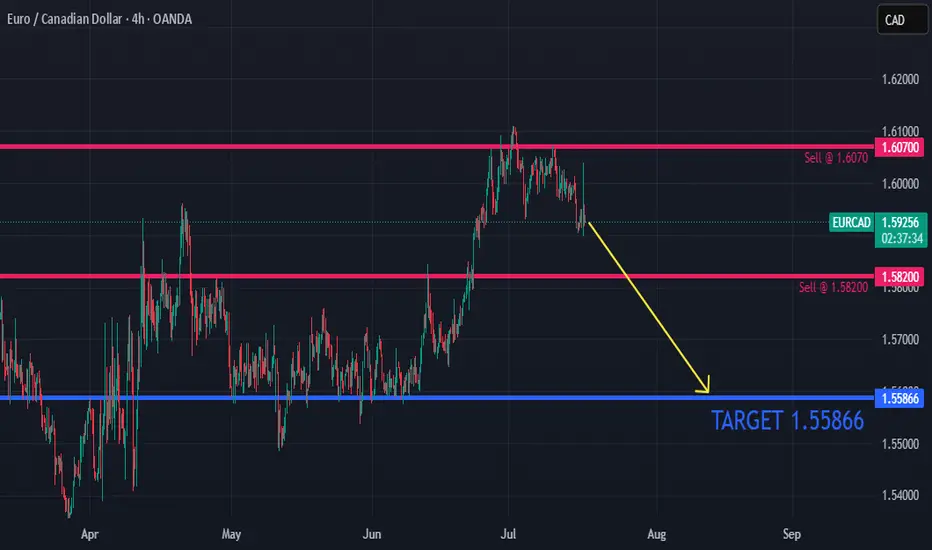
EURCAD – Two Key Levels, One Solid PlanOn this pair, we have two important levels:
🟡 The first level might act as a trap (stop hunting).
So don’t rush to buy — wait for confirmation.
🟢 The second level offers a safer buy opportunity.
As always, our plan stays firm —
we don’t tell the market what to do, we follow it.
🔻 If a clean break and valid pullback occurs on the first level,
a short trade toward the lower level is possible.
⚠️ This pullback short scenario is only valid until price reaches the lower level.
If price hits the lower level and starts moving up,
any short position becomes much riskier.
Discipline > Prediction.

EURCADWEEKLY is bullish, I'm expecting the continuation if price breaks above the bearish candles and gives us a bullish OB. Then we can buy back to the weekly high. confirmation is waiting for the 4h bullish OB to form.

EurCAD LongWe are at key area. At the support. We are looking to buy to the level as shown. We hope to get1:2 Return

YOU MUST BE A CONFLUENCE FINDER, let me explain.......All the information you need to find a high probability trade are in front of you on the charts so build your trading decisions on 'the facts' of the chart NOT what you think or what you want to happen or even what you heard will happen. If you have enough facts telling you to trade in a certain direction and therefore enough confluence to take a trade, then this is how you will gain consistency in you trading and build confidence. Check out my trade idea!!
www.tradingview.com

Trends Report#1:Learn How To See Bullish Chart Patterns It's been a wild week.As I am strategy building.
So far I have about 3 solid trading strategies.
Then I have two more pending to learn more.
My dream as a man has always been to learn how to make money.
Staying in the financial markets because I went to college to study information and technology.
In my academic studies there was nothing close to what I learned on trading.
Financial technology software development is what I have decided to study as an academic pursue.
The education system is broken.
Look at this chart.
☝️The price is above the 50 EMA
☝️The price is above the 200 EMA
☝️The price has reversed on a Bullish Harami Candlestick pattern .
This reversal is confirmed by both the positive volume + volume oscillating tool.
To learn more 🚀 Boost This Content
Disclaimer ⚠️ Trading is risky please learn Risk Management And Profit Taking Strategies.Also feel free to use a simulation trading account before you use real money.

EURCAD ShortEURCAD is now net short on the regression break.
I am considering my options on this pair. (EA with limited risk)
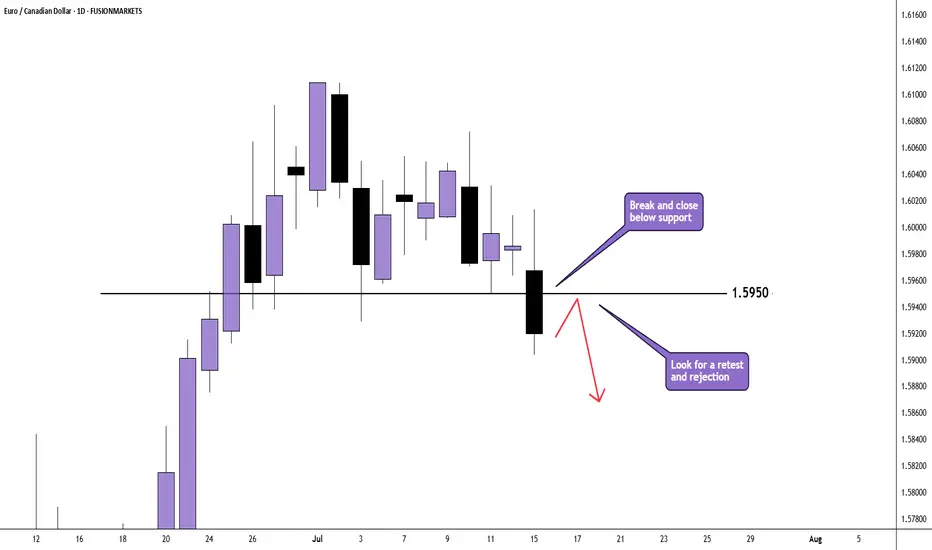
EUR/CAD Daily AnalysisPrice has broken and closed below 1.5950 which was support over the last few days. Look for a pullback, retest and rejection.
If you agree with this analysis, look for a trade that meets your strategy rules.
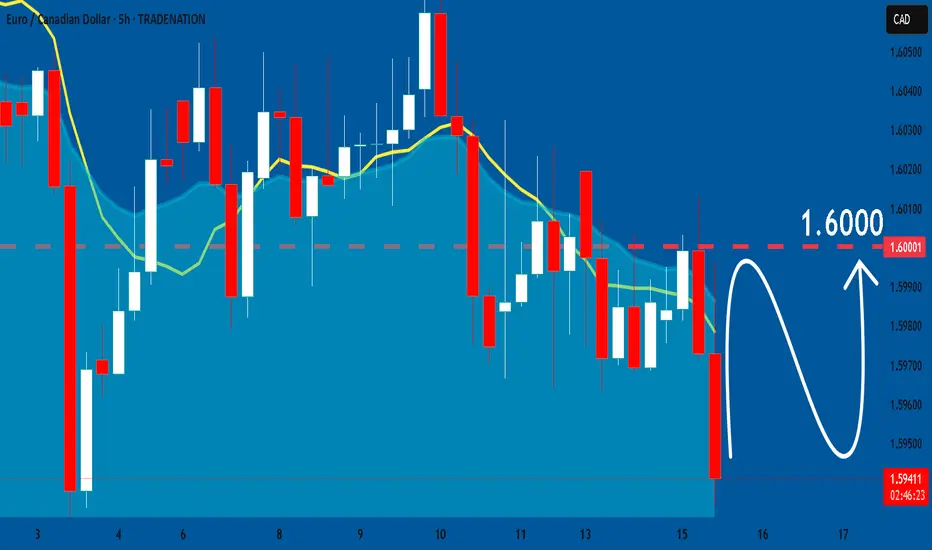
EURCAD: Bullish Forecast & Bullish Scenario
The price of EURCAD will most likely increase soon enough, due to the demand beginning to exceed supply which we can see by looking at the chart of the pair.
Disclosure: I am part of Trade Nation's Influencer program and receive a monthly fee for using their TradingView charts in my analysis.
❤️ Please, support our work with like & comment! ❤️

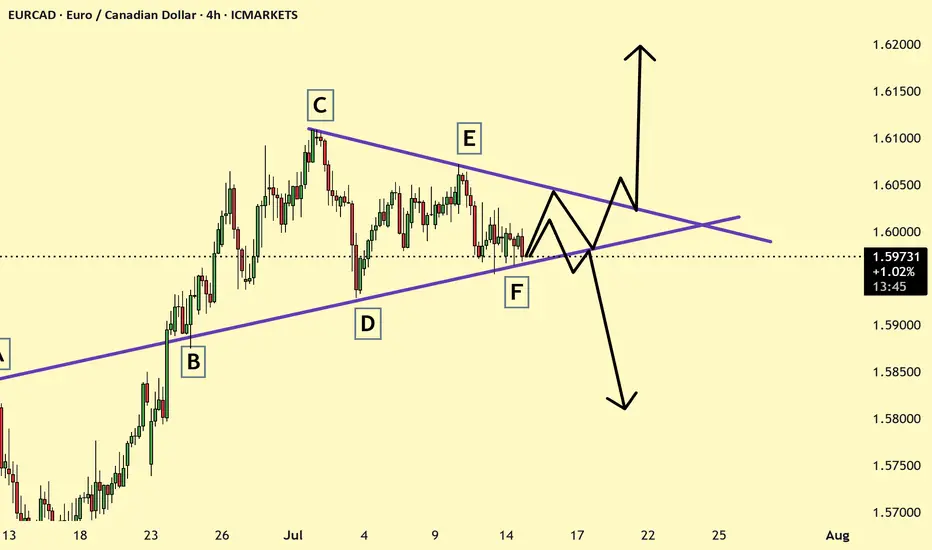
EURCAD possible ScenarioEURCAD is trading in triangle channel pattern and is at the support and wait for possible breakdown or barkeout? and trade accordingly.
EUR/CAD: Quant-Verified ReversalThe fundamental catalyst has been triggered. The anticipated strong Canadian CPI data was released as expected, confirming the primary driver for this trade thesis. Now, the focus shifts to the technical structure, where price is showing clear exhaustion at a generational resistance wall. 🧱
Our core thesis is that the confirmed fundamental strength of the CAD will now fuel the technically-indicated bearish reversal from this critical price ceiling.
The Data-Driven Case 📊
This trade is supported by a confluence of technical, fundamental, and quantitative data points.
Primary Technical Structure: The pair is being aggressively rejected from a multi-year resistance zone (1.6000 - 1.6100). This price action is supported by a clear bearish divergence on the 4H chart's Relative Strength Index (RSI), a classic signal that indicates buying momentum is fading despite higher prices.
Internal Momentum Models: Our internal trend and momentum models have flagged a definitive bearish shift. Specifically, the MACD indicator has crossed below its signal line into negative territory, confirming that short-term momentum is now bearish. This is layered with a crossover in our moving average module, where the short-term SMA has fallen below the long-term SMA, indicating the prevailing trend structure is now downward.
Quantitative Probability & Volatility Analysis: To quantify the potential outcome of this setup, we ran a Monte Carlo simulation projecting several thousand potential price paths. The simulation returned a 79.13% probability of the trade reaching our Take Profit target before hitting the Stop Loss. Furthermore, our GARCH volatility model forecasts that the expected price fluctuations are well-contained within our defined risk parameters, reinforcing the asymmetric risk-reward profile of this trade.
The Execution Plan ✅
Based on the synthesis of all data, here is the actionable trade plan:
📉 Trade: Sell (Short) EUR/CAD
👉 Entry: 1.6030
⛔️ Stop Loss: 1.6125
🎯 Take Profit: 1.5850
The data has spoken, and the setup is active. Trade with discipline.


BUY EURCADTemporary move against the bearish trend on EURCAD. I am expecting price to move up to 1,60100 before declining. Price action is forming a bearish flag so expect a bearish reversal right after this move

EURCAD Breakdown and Retest , All Eyes on SellingHello Traders
In This Chart EURCAD HOURLY Forex Forecast By FOREX PLANET
today EURCAD analysis 👆
🟢This Chart includes_ (EURCAD market update)
🟢What is The Next Opportunity on EURCAD Market
🟢how to Enter to the Valid Entry With Assurance Profit
This CHART is For Trader's that Want to Improve Their Technical Analysis Skills and Their Trading By Understanding How To Analyze The Market Using Multiple Timeframes and Understanding The Bigger Picture on the Charts

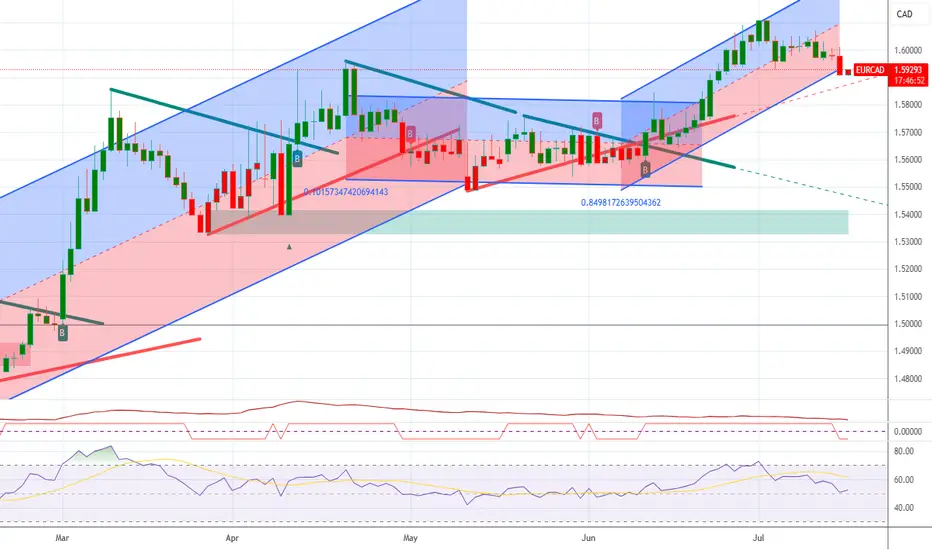
EURCAD - Weekly Resistance Might Shift The Momentum!Hello TradingView Family / Fellow Traders. This is Richard, also known as theSignalyst.
📈EURCAD has been overall bullish trading within the rising channel marked in blue. However, it is currently approaching the upper bound of the channel.
Moreover, the red zone is a strong weekly resistance.
🏹 Thus, the highlighted red circle is a strong area to look for sell setups as it is the intersection of the upper blue trendline and resistance.
📚 As per my trading style:
As #EURCAD approaches the red circle zone, I will be looking for bearish reversal setups (like a double top pattern, trendline break , and so on...)
📚 Always follow your trading plan regarding entry, risk management, and trade management.
Good luck!
All Strategies Are Good; If Managed Properly!
~Rich
Disclosure: I am part of Trade Nation's Influencer program and receive a monthly fee for using their TradingView charts in my analysis.
