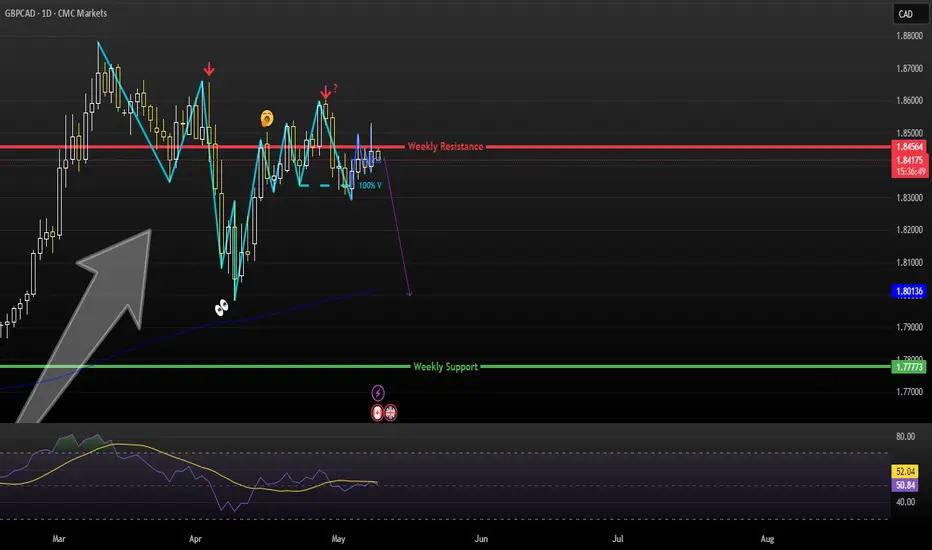
GBP-CAD Local Correction Ahead! Sell!
Hello,Traders!
GBP-CAD keeps growing
And the pair is locally overbought
So despite our local bullish bias
We will be expecting a pullback
And a move down after the
Pair hits the horizontal resistance
Around the 1.8600 area
Sell!
Comment and subscribe to help us grow!
Check out other forecasts below too!
Disclosure: I am part of Trade Nation's Influencer program and receive a monthly fee for using their TradingView charts in my analysis.
CADGBP trade ideas

GBPCAD continue deeper the retracementWeekly we are having the retracement from bull run, but I see potential on sells because of multiple rejection from AOI W formed, and beautiful Head&shoulders pattern formed on Daily timeframe. I excpect the wick of Weekly in this zone and with engulfing confirmation we can enter to sell to continue the push deeper to HL Weekly
DISCLAIMER! The information and publications are not meant to be, and do not constitute, financial, investment, trading, or other types of advice or recommendations supplied or endorsed by me

GBPCAD - Potential SellCMCMARKETS:GBPCAD
Hi Traders, here is my view on this pair.
BIAS: SELL
Logical Analysis:
Since the end of 2022, the demand for this pair has been very
high. As a trader, this strong demand leads me to favor trading
it to the upside. However, it's important to remember that
buying cannot happen without selling, which makes me believe
that a potential discount may currently be taking place.
We initially saw an aggressive discount from the 0.8700 level,
bringing the price down to 0.8000, where buyers clearly
stepped in. Since then, we've been following the momentum of
the buyers. However, based on recent price action, it appears
that buying interest is starting to weaken—or that buyers are no
longer finding value in the trade—around the 0.8400 level.
Technical Analysis:
Key Levels
Resistance (Sell Zone): 1.8420–1.8470
This area has acted as a ceiling multiple times.
Price has failed to break and close above this level
convincingly.
Target (Support Zone): 1.8000
A well-established support area, also near the 200 EMA, which
acts as a dynamic support.
Timed Entry: Up to you :)
Good Luck
Oh, I forgot to mentionOh, I forgot to mention — the chart had a nice Head and Shoulders pattern too.
But honestly? Forget it. In my opinion, Bitcoin is just a toy controlled by propaganda machines. Stay away from it — it’ll eventually crush you.
The real problem is, you won’t find a legit mentor who’s serious and doesn’t trade crypto. In my own experience, after all this time, I’ve realized that almost all the channels — whether paid or free — are nonsense and mostly scams.
Even those who give free signals “for the people” are usually just faking it to build trust. Their real plan is to scam people once they’ve built up enough followers. It’s all a game.

GBP/CAD BEARISH BIAS RIGHT NOW| SHORT
Hello, Friends!
Previous week’s green candle means that for us the GBP/CAD pair is in the uptrend. And the current movement leg was also up but the resistance line will be hit soon and upper BB band proximity will signal an overbought condition so we will go for a counter-trend short trade with the target being at 1.841.
Disclosure: I am part of Trade Nation's Influencer program and receive a monthly fee for using their TradingView charts in my analysis.
✅LIKE AND COMMENT MY IDEAS✅

GBPCAD: Weak Market & Bearish Continuation
Our strategy, polished by years of trial and error has helped us identify what seems to be a great trading opportunity and we are here to share it with you as the time is ripe for us to sell GBPCAD.
Disclosure: I am part of Trade Nation's Influencer program and receive a monthly fee for using their TradingView charts in my analysis.
❤️ Please, support our work with like & comment! ❤️

GBPCAD INTRADAY key trading level at 1.8532The GBPCAD pair is exhibiting a bearish sentiment, reinforced by the ongoing downtrend. The key trading level to watch is at 1.8532 which represents the current intraday swing high.
In the short term, an oversold rally from current levels, followed by a bearish rejection at the 1.8532 resistance, could lead to a downside move targeting support at 1.8280 with further potential declines to 1.8150 and 1.8040 over a longer timeframe.
On the other hand, a confirmed breakout above the 1.8532 resistance level and a daily close above that mark would invalidate the bearish outlook. This scenario could pave the way for a continuation of the rally, aiming to retest the 1.8590 resistance, with a potential extension to 1.8650 levels.
Conclusion:
Currently, the GBPCAD sentiment remains bearish, with the 1.8530 level acting as a pivotal resistance. Traders should watch for either a bearish rejection at this level or a breakout and daily close above it to determine the next directional move. Caution is advised until the price action confirms a clear break or rejection.
This communication is for informational purposes only and should not be viewed as any form of recommendation as to a particular course of action or as investment advice. It is not intended as an offer or solicitation for the purchase or sale of any financial instrument or as an official confirmation of any transaction. Opinions, estimates and assumptions expressed herein are made as of the date of this communication and are subject to change without notice. This communication has been prepared based upon information, including market prices, data and other information, believed to be reliable; however, Trade Nation does not warrant its completeness or accuracy. All market prices and market data contained in or attached to this communication are indicative and subject to change without notice.

gbpcad buy tradeThe Relative Strength Index (RSI) is showing an upward trend, indicating increasing momentum. Additionally, the Moving Average Convergence Divergence (MACD) is showing a bullish crossover, further supporting the potential for an upward move.

Potential Bullish Shark on GBPCADI will drop the images of the analysis. (let the image do the talking) I will be waiting for the structure shift and further confirmation immediately price gets to PRZ to know who controls buyers or sellers.
WEEKLY
DAILY:
SET UP: BULLISH SHARK ON H4
30MINS:
I WILL wait for shift before entering the trade
when the set up completes

GBPCAD: 700+ pips swing move in making; what you think? FX:GBPCAD
After looking at the daily timeframe, we have identified the price pattern with this particular pair, we pointed out the upcoming big move based on similar move that this pair has made. Currently price has been rebounding from the strong buying zone where we expect a large volume to kick in the market. First our main aim will be to see how price react at the downtrend trendline and if price successfully breakthrough the region. We can then enter more entries with this pairs targeting long term 700+ pips. Good luck and trade safe.

NZDCAD: Last Idea Running 300+ Pips, Next Big Opportunity OTW! Dear Traders,
Our last idea hit 340+ pips successfully, and we expect price to continue rising up, after touching our imbalance zone. That area remain a strong possible buying area for buyers. Once rejected at the area we can see strong rebound from our buying zone. 400-500 pips move is expected.
Good Luck and Trade Safe
**If you like our idea then please do like, comment and follow for more**

GBPCAD Will Go Lower! Short!
Please, check our technical outlook for GBPCAD.
Time Frame: 9h
Current Trend: Bearish
Sentiment: Overbought (based on 7-period RSI)
Forecast: Bearish
The price is testing a key resistance 1.851.
Taking into consideration the current market trend & overbought RSI, chances will be high to see a bearish movement to the downside at least to 1.834 level.
P.S
The term oversold refers to a condition where an asset has traded lower in price and has the potential for a price bounce.
Overbought refers to market scenarios where the instrument is traded considerably higher than its fair value. Overvaluation is caused by market sentiments when there is positive news.
Disclosure: I am part of Trade Nation's Influencer program and receive a monthly fee for using their TradingView charts in my analysis.
Like and subscribe and comment my ideas if you enjoy them!

GBPCAD 06/05/2025Weekly:
-Bullish M pattern.
-PWL taken.
Daily:
-Inverse H&S pattern.
-IC.
4H:
-Bullish M pattern.
-IC.

GBPCAD Trade against TrendWe will try to catch the correction wave on the GBPCAD before the huge move to the down side
Buy around 1.8340
Stoploss 1.8295
Target 1.8480
with RR 1:3

2 out of 2? gBPcAd..iT’s tIMe yET?1D- Daily timeframe we saw price break structure lower but after the break price did not move lower in fact we saw it retracing.
4H- Here price agreed with the daily by breaking structure higher to go take the liquidity(Internal) resting higher, if we take a closer look at the leg that broke structure higher we can than identify imbalances in price and as ICT mentions price looks for two things 1. liquidity and 2. Imbalances. Right now our focus is price balancing before going for the buyside.

GBPCAD SellWeekly rejection candlestick. Daily Bearish structure. Price is at a strong area of interest. Lets see how this goes

Mon 5th May 2025 GBP/CAD Daily Forex Chart Sell SetupGood morning fellow traders. On my Daily Forex charts using the High Probability & Divergence trading methods from my books, I have identified a new trade setup this morning. As usual, you can read my notes on the chart for my thoughts on this setup. The trade being a GBP/CAD Sell. Enjoy the day all. Cheers. Jim

GBP/CAD Weekly AnalysisLast weeks bearish engulfing candle could signal the start of a correction back to the trendline.
Look for a break of the low and a sell setup that meets your trading rules.
This is an idea of what MAY happen. Always trade with a profitable strategy and good risk management.

GBPCAD TRADE SETUPWait for retest the entry level and bearish momentum then take a trade for Sell otherwise skip this setup

GBPCAD - longHi Team ,
For WK19 we have this GC long
Patience is the key guys , nobody will give you 100% a month remember earning just 1% a month beats 99% of retail community
Thank you !

GBPCAD - W bottom - 4hr - 100 pip moveFirst post and a complete novice so here goes!
Strong movement down on the 4 hour chart.
Tested 1.83205.
Pulled back and currently retesting the same area.
RSI went below 30 showing its overbought but it is showing bullish divergence which I expect a 100pip move up to complete the W bottom pattern.
What's your thoughts?

Potential Sell Opportunity on GBPCADReasons I think this pair will drop:
- On the daily chart price gave us a lower high on a confirmed trend line. Simple market structure.
Thoughts?

GBPCAD Potential PullbackHi there,
On GBPCAD, a bullish pullback is anticipated, with a potential bullish level of interest at 1.84988, targeting two price levels: 1.87001 and 1.88069.
Currently, the price movement is bearish, seemingly aiming for the 1.84235 low. It may act against bullish orders, so there should be some caution around the 1.83199 level as it has the potential to drop even lower.
Happy Trading,
K.
It is not trading advice.
