GBP/CAD "Pound vs Loonie" Forex Bank Money Heist (Bullish)🌟Hi! Hola! Ola! Bonjour! Hallo! Marhaba!🌟
Dear Money Makers & Robbers, 🤑 💰💸✈️
Based on 🔥Thief Trading style technical and fundamental analysis🔥, here is our master plan to heist the NZD/JPY "Kiwi vs Yen" Forex Bank Heist. Please adhere to the strategy I've outlined in the chart, which emphasizes long entry. Our aim is to escape near the high-risk Danger Resistance Zone. It's a Risky level, overbought market, consolidation, trend reversal, trap at the level where traders and bearish robbers are stronger. 🏆💸"Take profit and treat yourself, traders. You deserve it!💪🏆🎉
Entry 📈 : "The heist is on! Wait for the Crossing previous high (1.86800) then make your move - Bullish profits await!"
however I advise to Place Buy stop orders above the Moving average (or) Place buy limit orders within a 15 or 30 minute timeframe most recent or swing, low or high level for Pullback entries.
📌I strongly advise you to set an "alert (Alarm)" on your chart so you can see when the breakout entry occurs.
Stop Loss 🛑: "🔊 Yo, listen up! 🗣️ If you're lookin' to get in on a buy stop order, don't even think about settin' that stop loss till after the breakout 🚀. You feel me? Now, if you're smart, you'll place that stop loss where I told you to 📍, but if you're a rebel, you can put it wherever you like 🤪 - just don't say I didn't warn you ⚠️. You're playin' with fire 🔥, and it's your risk, not mine 👊."
📍 Thief SL placed at the nearest/swing low level Using the 5H timeframe (1.8400) Day trade basis.
📍 SL is based on your risk of the trade, lot size and how many multiple orders you have to take.
🏴☠️Target 🎯: 1.90000
🧲Scalpers, take note 👀 : only scalp on the Long side. If you have a lot of money, you can go straight away; if not, you can join swing traders and carry out the robbery plan. Use trailing SL to safeguard your money 💰.
💰💵💸GBP/CAD "Pound vs Loonie" Forex Bank Money Heist is currently experiencing a bullishness,., driven by several key factors. .☝☝☝
📰🗞️Get & Read the Fundamental, Macro Economics, COT Report, Quantitative Analysis, Sentimental Outlook, Intermarket Analysis, Future trend targets with overall score... go ahead to check 👉👉👉🔗🔗🔗
⚠️Trading Alert : News Releases and Position Management 📰🗞️🚫🚏
As a reminder, news releases can have a significant impact on market prices and volatility. To minimize potential losses and protect your running positions,
we recommend the following:
Avoid taking new trades during news releases
Use trailing stop-loss orders to protect your running positions and lock in profits
💖Supporting our robbery plan 💥Hit the Boost Button💥 will enable us to effortlessly make and steal money 💰💵. Boost the strength of our robbery team. Every day in this market make money with ease by using the Thief Trading Style.🏆💪🤝❤️🎉🚀
I'll see you soon with another heist plan, so stay tuned 🤑🐱👤🤗🤩
CADGBP trade ideas

GBPCAD - BULLISH MOVEHello Traders !
The GBPCAD broke the resistance level (1.83706 - 1.84150).
This key level becomes new support!
So, I expect a bullish move🚀
Let's wait for a retest...
____________
TARGET: 1.85720🎯

GBPCAD UPDATEOn the 4 hour timeframe i see that i am on a resistance trandline to actually push the price lower. At this moment i am waiting for a clear push down and a small correction or a pattern to take the trade.

GBP/CAD For Bullishwait for pull-back near by entry point and then go long
general trend is up trend
have fun :)

Pound Cad analysis In this analysis I started from weekly time frame identifying the directional bias. I then marked my previous weekly highs and previous weekly low. After identifying that I then looked at the structure to see if we are in an impulsive wave or a correction wave. I then concluded that I am in a correction phase. But I can see that the high took the previous one and retraced back into the structure giving us a clear push down and now I am in a correction phase expecting the graph to do what it did previously since it has taken the high I don't expect it to be continuing further. I then went to the daily time frame to refine my trendlines and to see the structure clearly. After that I went to the 4 hour to confirm the structure but now I am neutral as I expect the price to turn over on the third touch or go further to give me a double top within a weekly double top. As for now I want to see where the price react at then I will take decision thereby preventing unnecessary loss.

GBPCAD Bullish Move to 1.90 - 1.91 Level GbpCad my most Recent Trade right now, looking at the GbpCad we can see price Broke the Mayor Level 1.80 and came back to retest the level, giving us a nice set up to the upside, as you can see not only priced retest the Mayor Level 1.80 but also bounced off the Bullish Trendline, indicating is price wants to continue pushing up, what i really saw is price created a nice support area at 1.81 where we got a nice Break of Structure, Break of the Counter Trendline and a Lower High after the break, that's enough for me to enter because overall i don't see anything more price has to do in order to push, there's no more bearish insights to take a look at, and with all the momentum and confluences i do believe price will start pushing anytime soon, of course if you look at my charts you can find more confluences like the inverted H&S Pattern, the Break above of the EMA's, EMA's crossing over, etc. Imma hold this trade until price tells me otherwise.

GBPCAD: this week be patient B tradeA page from my trading journal. Please take it with a grain of salt, as I’m still learning and growing 🌟
last week TP1 very close but didn't reach, my moved SL got hit, $40+ but yeah that's the market play.
this week still good structure, resistance respected multiple times. Needs strong signal bar or double top micro wedge to short.

GBP/CAD Bullish Setup:Targeting 1.86500 from Demand Zone SupportTrendline ➡️
Price is respecting an upward trendline 📈 connecting higher lows 🔵 (marked by dots).
Channel ➡️
Price is moving inside an ascending channel 🚀 (controlled bullish movement).
EMA (70) ➡️
The red curve ➰ is the 70 EMA. Price is near it — showing indecision but still respecting it ⚖️.
Demand Zone ➡️
A strong demand zone 🔵 is marked between 1.8400–1.8440 where buyers jump in 🛒 whenever price touches it.
Support Zone ➡️
A nearby support zone 🛡️ is around 1.8480–1.8500. It's acting like a stepping stone 🧗♂️ for price to climb.
Target ➡️
The target 🎯 is clearly marked at 1.86500 — aiming for a nice breakout! 🚀📈
Summary
🔵 Stay above the demand zone ➡️ good for buys!
🛡️ Watch the support ➡️ could be a retest and bounce!
❌ If price breaks below demand zone, the setup is invalid ⚠️.
Simple Trading Plan:
✅ Buy near 🔵 demand or 🛡️ support.
✅ Target 🎯 1.86500.
❌ Stop Loss below 🔵 1.8390 area.

[GBPCAD] Trade ideaNot the best setup to enter but still a short position for me on this one.
We can still wait for more confirmation to enter heavier.
Great Trade !


GBP/CAD Approaches Major Resistance – Potential Short OpportunitGBP/CAD is currently testing a resistance and round psychological zone 1.84996 - 1.85000, which has acted as a strong supply area in previous attempts. The pair has repeatedly failed to break above this zone, showing clear signs of bearish rejection via wicks and bearish engulfing candles.
Key Confluences for a Sell Setup:
• Resistance Zone: Price is consolidating below the H1 supply zone, forming multiple rejections.
• 50 EMA (Daily): Price is currently hovering around the 50 EMA, suggesting potential for downward momentum if it holds as resistance.
• Bearish Structure: The pair made a lower high recently, and failure to break the current resistance could confirm a bearish continuation pattern.
• Bearish Wick Rejections: Candles are leaving long upper wicks near the resistance, indicating strong seller presence.
Sell Zones:
• Entry Zone: 1.8500 – 1.85249 (ideal for entries with bearish confirmation)
• Stop Loss Zone: Above 1.85500 (to cover liquidity grabs)
Target Zones:
• TP1: 1.83478 – 1.83240 (first reaction zone near recent structure and EMA support)
• TP2: 1.80926 (previous demand zone and daily structure support)
Bias: Bearish below 1.85249. Watch for confirmation signals like bearish engulfing, pin bars, or break of minor support levels on lower timeframes.

GBP/CAD For Bullishyou can go long now
or
wait for pull-back near by entry point and then go long
general trend is up trend
have fun :)

GBPCAD INTRADAY downtrend capped at 1.8532The GBPCAD pair is exhibiting a bearish sentiment, reinforced by the ongoing downtrend. The key trading level to watch is at 1.8532 which represents the current intraday swing high.
In the short term, an oversold rally from current levels, followed by a bearish rejection at the 1.8532 resistance, could lead to a downside move targeting support at 1.8280 with further potential declines to 1.8150 and 1.8040 over a longer timeframe.
On the other hand, a confirmed breakout above the 1.8532 resistance level and a daily close above that mark would invalidate the bearish outlook. This scenario could pave the way for a continuation of the rally, aiming to retest the 1.8590 resistance, with a potential extension to 1.8650 levels.
Conclusion:
Currently, the GBPCAD sentiment remains bearish, with the 1.8530 level acting as a pivotal resistance. Traders should watch for either a bearish rejection at this level or a breakout and daily close above it to determine the next directional move. Caution is advised until the price action confirms a clear break or rejection.
This communication is for informational purposes only and should not be viewed as any form of recommendation as to a particular course of action or as investment advice. It is not intended as an offer or solicitation for the purchase or sale of any financial instrument or as an official confirmation of any transaction. Opinions, estimates and assumptions expressed herein are made as of the date of this communication and are subject to change without notice. This communication has been prepared based upon information, including market prices, data and other information, believed to be reliable; however, Trade Nation does not warrant its completeness or accuracy. All market prices and market data contained in or attached to this communication are indicative and subject to change without notice.

GBP/CADGBP/CAD is moving towards collective move against the motive wave up.the pair could go lower down to the Fibonacci zone of grey coloured

GBPCAD The Target Is DOWN! SELL!
My dear followers,
This is my opinion on the GBPCAD next move:
The asset is approaching an important pivot point 1.8481
Bias - Bearish
Safe Stop Loss - 1.8552
Technical Indicators: Supper Trend generates a clear short signal while Pivot Point HL is currently determining the overall Bearish trend of the market.
Goal - 1.8357
About Used Indicators:
For more efficient signals, super-trend is used in combination with other indicators like Pivot Points.
———————————
WISH YOU ALL LUCK

A SNAPSHOT OF GBPCADWe could spot an immediate up trend on GBPCAD on the H4 time frame, the overall bullish dominance is conspicuous with the formation of HHs and HLs.
However, prices were resisted around 1.8527 levels which happened to be three weeks high.
Price is currently resting above EMA 50 which serves as support and likely adds credence to the bullish trend. From technical perspective, analysts expect another throw to take out the preceding high of 1.8527, with potential target around 1.8638 for the uptrend to continue. On the flipside, if the support level of 1.8315 is taken out, that would validate a reversal of the trend with potential target around 1.8243 and 1.8115. Break out of these levels are not ruled out as per analyst.
UPCOMING CATALYST:
From the radar, Bank of England Governor Andrew Bailey is scheduled to speak today, April 23rd, 2025, at 9:15 PM GMT+4 at institute of international Finance in Washington DC.
Meanwhile, on the 16th of April, inflation rate in the UK dropped to 2.6% y/y, lowest since October and as such, this increased expectations for lowering rate and analyst has projected about four rates cut in the year 2025 if inflation continue to decline. The next rate meeting scheduled for May 8th might likely be ushering in another rate cut according to analysts.
Furthermore, Retail sales data for both economies would be on the wire on Friday, the 25th. These data points could trigger market volatility, offering both risks and potential trading opportunities.

The GBPCAD is Unstoppable due to Strong Up TrendGBPCAD H4 Analysis 📈
NZD AND AUD are linked with each other not directly but indirectly.
That's why if AUD weak then NZD is also weak and now as you can see these 4 pairs are going up without any retracement.
The pair is moving in a similar way like GBPAUD.
The red zone is a support zone a and last the the market was pumped from the same zone.
If The markets holds on the red zone or holds above the red zone , it will be a confirmation of buy .
If the markets breaks the red zone in the downside direction then but setup is no more valid.
The pair is looking to retest its higher resistance points according to the Weekly time frame.

GBPCAD: Short Trading Opportunity
GBPCAD
- Classic bearish setup
- Our team expects bearish continuation
SUGGESTED TRADE:
Swing Trade
Short GBPCAD
Entry Point - 1.8517
Stop Loss - 1.8601
Take Profit - 1.8348
Our Risk - 1%
Start protection of your profits from lower levels
Disclosure: I am part of Trade Nation's Influencer program and receive a monthly fee for using their TradingView charts in my analysis.
❤️ Please, support our work with like & comment! ❤️

Bullish rise?GBP/CAD is reacting off the pivot and could rise to the pullback resistance that lines up with the 78.6% Fibonacci projection.
Pivot: 1.8469
1st Support: 1.8316
1st Resistance: 1.8741
Risk Warning:
Trading Forex and CFDs carries a high level of risk to your capital and you should only trade with money you can afford to lose. Trading Forex and CFDs may not be suitable for all investors, so please ensure that you fully understand the risks involved and seek independent advice if necessary.
Disclaimer:
The above opinions given constitute general market commentary, and do not constitute the opinion or advice of IC Markets or any form of personal or investment advice.
Any opinions, news, research, analyses, prices, other information, or links to third-party sites contained on this website are provided on an "as-is" basis, are intended only to be informative, is not an advice nor a recommendation, nor research, or a record of our trading prices, or an offer of, or solicitation for a transaction in any financial instrument and thus should not be treated as such. The information provided does not involve any specific investment objectives, financial situation and needs of any specific person who may receive it. Please be aware, that past performance is not a reliable indicator of future performance and/or results. Past Performance or Forward-looking scenarios based upon the reasonable beliefs of the third-party provider are not a guarantee of future performance. Actual results may differ materially from those anticipated in forward-looking or past performance statements. IC Markets makes no representation or warranty and assumes no liability as to the accuracy or completeness of the information provided, nor any loss arising from any investment based on a recommendation, forecast or any information supplied by any third-party.

GBPCAD LongGBPCAD is now net long on the regression break.
I am considering my EA options on this pair.

GBPCAD MARKET OVERVIEWGBPCAD appears has Bullish pattern due to the recent dormition for a support now price will hitting the strong resistance zone could continue move up the main driver suturing is coming bank of Canada interest rate diction market will expect BOC to hold rates at 2.75% but 25 bps cut to 2.5% is still a possibility.
Resistance level 1.84500 / 1.85500
Support Levels 1.83700 / 1.8300
Ps Support with like and comments for more analysis share your opinion in comments Ill be glad.

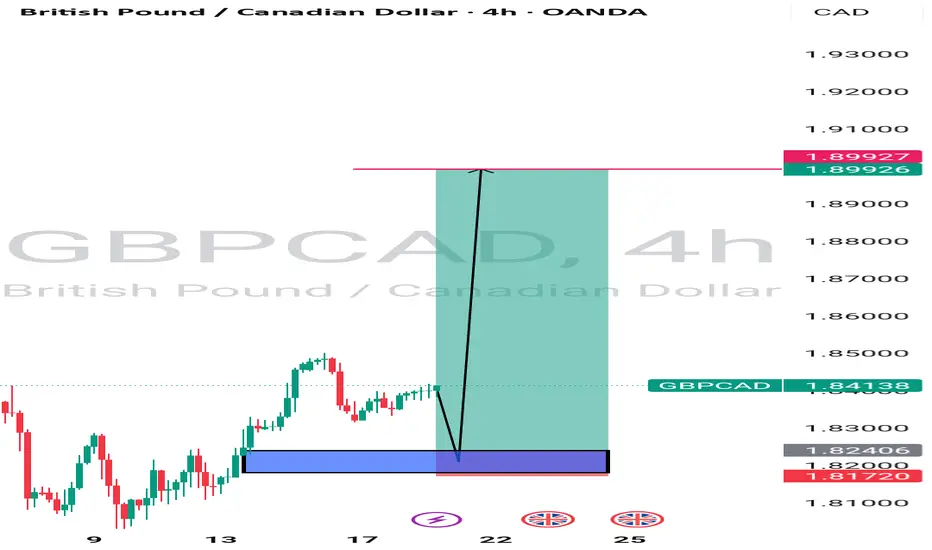
GBPCAD IS BULLISH OR BEARISH DETAILED ANALYSISGBPCAD is currently presenting a high-probability bullish setup after a textbook inverse head and shoulders formation on the 12H chart. Price is now hovering around 1.8457 and has just broken out above the descending trendline acting as neckline resistance. This structural shift, combined with clean bullish price action, signals the potential beginning of a fresh upward leg toward the 1.8976 region, a prior key supply zone and the projected target based on the measured move technique from the pattern.
From a fundamental standpoint, the British Pound is supported by hawkish BoE rhetoric and stronger-than-expected UK inflation data. Sticky core CPI and a robust labor market are keeping interest rate expectations elevated, which strengthens GBP across the board. In contrast, the Canadian Dollar remains under pressure due to softer oil prices and the Bank of Canada's dovish stance as it flirts with rate cuts in upcoming meetings. This macro divergence is fueling the momentum in GBPCAD’s favor, making it a favored pair for swing longs.
Technically, the pair is forming higher lows with increasing volume, which adds confidence to the breakout. The risk is well defined below 1.8198, making this an attractive trade with a solid 1:2+ reward-to-risk profile. As price continues to respect bullish market structure, any pullback toward the neckline could offer a prime re-entry zone for continuation traders.
This setup aligns with highly searched price action strategies such as “inverse head and shoulders breakout,” “neckline retest,” and “GBP strength vs CAD weakness.” With both technical and fundamental confluence pointing in the same direction, GBPCAD is set up for a potentially profitable swing opportunity heading into May.

GBPCAD BULLISH Here is my technical analysis on this pair. GBPCAD looks bullish after it retest to the support level.