#GBPCAD:Last Idea +400 Pips Up! Here is second entryIn our last analysis, the GBPCAD currency pair showed a smooth move. The price hit support levels, which means it might keep going up. We think it’ll go up by about 600 pips and might reach the 1.90 area.
Since there aren’t many places to stop for this trade, it’s important to set take profit levels based on your risk management plan.
We hope you’re doing well with your trading. If you find our ideas helpful, please let us know by liking, commenting, or sharing them.
Thanks for being a great supporter!
Team Setupsfx
CADGBP trade ideas

The Market closed bullishSo I will be expecting for the market to create a bottom wick and continue up.

GBPCAD Will Move Lower! Short!
Here is our detailed technical review for GBPCAD.
Time Frame: 6h
Current Trend: Bearish
Sentiment: Overbought (based on 7-period RSI)
Forecast: Bearish
The market is approaching a significant resistance area 1.835.
Due to the fact that we see a positive bearish reaction from the underlined area, I strongly believe that sellers will manage to push the price all the way down to 1.820 level.
P.S
Overbought describes a period of time where there has been a significant and consistent upward move in price over a period of time without much pullback.
Disclosure: I am part of Trade Nation's Influencer program and receive a monthly fee for using their TradingView charts in my analysis.
Like and subscribe and comment my ideas if you enjoy them!

#GBPCAD:800+ Pips Swing Buy With Two Targets! GBPCAD, since CAD has been extremely bullish lately, the price has dropped significantly, reaching a crucial buying level. Based on your analysis, you can take entry at two key price points.
Have a great weekend.
Much Love 🧡
Team Setupsfx_

GBPCAD: Short Trade with Entry/SL/TP
GBPCAD
- Classic bearish setup
- Our team expects bearish continuation
SUGGESTED TRADE:
Swing Trade
Short GBPCAD
Entry Point - 0.8358
Stop Loss - 0.8447
Take Profit - 0.8204
Our Risk - 1%
Start protection of your profits from lower levels
Disclosure: I am part of Trade Nation's Influencer program and receive a monthly fee for using their TradingView charts in my analysis.
❤️ Please, support our work with like & comment! ❤️

GBP/CAD "Pound vs Loonie" Forex Bank Heist Plan (Swing/Day)🌟Hi! Hola! Ola! Bonjour! Hallo! Marhaba!🌟
Dear Money Makers & Robbers, 🤑💰✈️
Based on 🔥Thief Trading style technical and fundamental analysis🔥, here is our master plan to heist the GBP/CAD "Pound vs Loonie" Forex Bank. Please adhere to the strategy I've outlined in the chart, which emphasizes long entry and short entry. 🏆💸"Take profit and treat yourself, traders. You deserve it!"💪🏆🎉
Entry 📈 :
"The loot's within reach! Wait for the breakout, then grab your share - whether you're a Bullish thief or a Bearish bandit!"
🏁Buy entry above 1.85100
🏁Sell Entry below 1.83000
📌However, I recommended to place buy stop for bullish side and sell stop for bearish side.
Stop Loss 🛑: "🔊 Yo, listen up! 🗣️ If you're lookin' to get in on a buy (or) sell stop order, don't even think about settin' that stop loss till after the breakout 🚀. You feel me? Now, if you're smart, you'll place that stop loss where I told you to 📍, but if you're a rebel, you can put it wherever you like 🤪 - just don't say I didn't warn you ⚠️. You're playin' with fire 🔥, and it's your risk, not mine 👊."
🚩Thief SL placed at 1.83000 (swing Trade Basis) for Bullish Trade
🚩Thief SL placed at 1.84000 (swing Trade Basis) for Bearish Trade
Using the 3H period, the recent / swing low or high level.
SL is based on your risk of the trade, lot size and how many multiple orders you have to take.
Target 🎯:
🏴☠️Bullish Robbers : TP 1.88500 (or) Escape Before the Target
🏴☠️Bearish Robbers : TP 1.80000 (or) Escape Before the Target
⚒💰GBP/CAD "Pound vs Loonie" Forex Bank Heist Plan is currently experiencing a neutral trend (there is a chance to move Bullishness🐂)... driven by several key factors.... ☝☝☝ 👇👇👇
📰🗞️Get & Read the Fundamental, Macro Economics, COT Report, Quantitative Analysis, Sentimental Outlook, Intermarket Analysis, Future trend targets & Overall Score... go ahead to check 👉👉👉🔗🔗
📌Keep in mind that these factors can change rapidly, and it's essential to stay up-to-date with market developments and adjust your analysis accordingly.
⚠️Trading Alert : News Releases and Position Management 📰 🗞️ 🚫🚏
As a reminder, news releases can have a significant impact on market prices and volatility. To minimize potential losses and protect your running positions,
we recommend the following:
Avoid taking new trades during news releases
Use trailing stop-loss orders to protect your running positions and lock in profits
💖Supporting our robbery plan 💥Hit the Boost Button💥 will enable us to effortlessly make and steal money 💰💵. Boost the strength of our robbery team. Every day in this market make money with ease by using the Thief Trading Style.🏆💪🤝❤️🎉🚀
I'll see you soon with another heist plan, so stay tuned 🤑🐱👤🤗🤩

GBPCAD buyers in control againAfter impulsive movement on Tuesday daily candle, today o H4 chart market is showing buyers are in control again (aligned with daily trend).
I'm start buying at 1.83800 and target it will make higher high.
1.85000 is my target.
good luck &
plan your own risk/reward.

My post analysis on GBPCAD tradeMy post analysis on GBPCAD trade. Actually, I was planning to buy GBPCAD in this New York session. Later i discover the trade has change from 1hr/4hrs trade into 4hrs/Daily. We have a guy given us issues on 15mins/1hr timeframe. So we just have to abandon our buy idea till further notice

GBPCAD trade ideaFX:GBPCAD
Potential short opportunity as price reaches Swap zone and closed with few rejection candles, signaling potential short-term reversal. Price previously respected the HTF Resistance zone, this is an extra confluence that it may continue its bearish order flow towards the downside. For scalping and intraday, we can target the H1 demand zone below and turn trade into breakeven if holding for longer time.


GBPCADGBPCAD has completed bearish harmonic pattern at strong resistance level and sellers took benefit of it. Currently the pair is little bit retracing from last selloff and it looks like sellers may attack again for another smooth selloff.

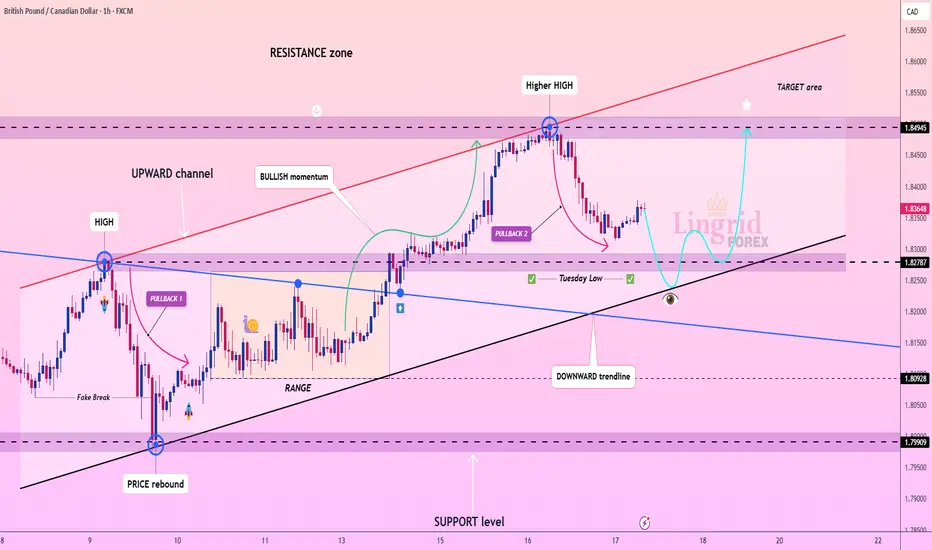
Lingrid | GBPCAD pullback Creating BULLISH Opportunity FX:GBPCAD market is pulling back after making higher highs. On the current timeframe the market is bullish as well as on the daily timeframe. The price is heading toward the psychological level at 1.83000 and possibly lower border of the upward channel. If the price retests the support level and Tuesday's low, this would be the best zone to consider to go long. I think the market will continue pushing to higher levels since the price cleared the area above the previous week's high.
Traders, if you liked this idea or if you have your own opinion about it, write in the comments. I will be glad 👩💻
17.04.25 Morning ForecastPairs on Watch -
FX:GBPCAD
FX:EURAUD
FX:GBPAUD
A short overview of the instruments I am looking at for today, multi-timeframe analysis down to what I will be looking at for an entry. Enjoy!

GBPCAD May Form a Broadening Wedge Ahead of BOC DecisionGBPCAD May Form a Broadening Wedge Ahead of BOC Decision
GBPCAD appears to be shaping into a Descending Broadening Wedge Pattern. The price hit strong resistance near 1.8400 and could continue moving lower, forming the C wave of the pattern.
The main driver for this setup is the upcoming Bank of Canada (BOC) interest rate decision on April 16, 2025. Markets expect BOC to hold rates at 2.75%, but a 25 bps cut to 2.5% is still a possibility.
If BOC does lower rates, they may issue a hawkish statement, which could strengthen CAD—though this scenario won’t be straightforward.
We'll have to wait and see how the market reacts.
You may find more details in the chart!
Thank you and Good Luck!
❤️PS: Please support with a like or comment if you find this analysis useful for your trading day❤️
Disclosure: I am part of Trade Nation's Influencer program and receive a monthly fee for using their TradingView charts in my analysis.

GBP/CAD at a crossroads: this key level could trigger the drop!My visual analysis highlights a strong multi-timeframe resistance zone (weekly and monthly) between 1.8662 and 1.8779, where price has reacted sharply multiple times. This area, marked in dark burgundy, signals a significant supply zone.
Currently, price is trading back in the 1.8350–1.8400 region. Based on my note on the chart ("Looking for a short opportunity on H1"), I’m anticipating a potential short entry from lower timeframes—likely triggered by a structural break or bearish candlestick confirmation.
🔻 Bearish Scenario:
If I get a short confirmation around the current area, I’ll be targeting the 1.7900–1.7677 demand zone (highlighted in deep blue), which has previously shown strong bullish reactions.
The RSI is also showing signs of potential divergence or overextension, adding weight to the bearish thesis.
🟢 Alternative Scenario:
If price decisively breaks above the 1.8780 monthly resistance, we could see an extended bullish move towards levels not currently visible on this chart.
📌 Operational Note:
I’ll be looking for entry confirmations on lower timeframes (like H1), with valid reversal patterns or price action triggers, and will manage the position dynamically depending on how price behaves around the 1.79 zone.

GBPCAD 4H chart
🧠 What We See Now:
• Strong impulse move up from the 1.8120–1.8178 demand zone (you marked that level like a pro).
• Price broke key lower highs around 1.8300, giving us bullish structure confirmation.
• Now we’re seeing a pullback after a clean rally—normal and expected.
• The most recent candle action is showing exhaustion from buyers (likely taking profits), which sets us up for a potential re-entry.
🔍 Is There a Buy Setup?
YES. But not right this second.
You’re in the “wait and strike” phase. Here’s what I’d be watching:
✅ BUY PLAN:
You want to buy the dip back into structure—not chase highs.
📌 Buy Entry Zone:
• Price to watch: 1.8250–1.8200
• Confluence:
• Previous consolidation before the breakout
• Discounted Fib zone (likely between 61.8%–78.6%)
• Imbalance fill on the 4H
• Demand zone revisit
🎯 Targets:
• TP1: 1.8385 (recent high)
• TP2: 1.8500+
• SL: Below 1.8120 to stay safe
⚠️ Should You Sell Here?
Nope. Here’s why:
• You’d be selling into a bullish market structure.
• Price already broke major highs—it’s no longer a downtrend.
• You’re better off waiting for a rejection at 1.8400–1.8450 if you want to scalp a short later, but now isn’t it.
🧠 Bonus Tip:
If you drop to the 1H or 30min and see price form a bullish engulfing or strong rejection wick in the 1.8250–1.8200 zone, that’s your confirmation trigger.
🔥 Final Words:
This is the part where emotions can fool traders into buying too early or selling too fast. But structure is on your side if you stay patient.

GBPCAD → False breakdown, where do we go from here?FX:GBPCAD is forming a false breakdown of trend support. Against the backdrop of the falling dollar, the pound sterling went into the rally phase, which is favorable for the currency pair.
The fundamental situation is in favor of GBP and CAD against the dollar, which continues its rapid decline.
As part of the correction, the currency pair forms a test of support without the opportunity to continue the downward movement. The maneuver ends with a false breakdown and consolidation above the level (inside the channel). The currency pair may continue the uptrend if the bulls hold the defense above 1.8144 - 1.823
Support levels: 1.81500, 1.79788
Resistance levels: 1.8233, 1.83796
Accordingly, based on the fact that we have an uptrend, a strong currency pair (on the background of a weak dollar) and a false breakdown of support, we can say that the price is not allowed down and it is worth considering an attempt to continue the uptrend.
Regards R. Linda!

Bullish bounce off 38.2% Fibonacci support?GBP/CAD is falling towards the support level which is a pullback support that aligns with the 38.2% Fibonacci retracement and could bounce from this level to our take profit.
Entry: 1.8286
Why we like it:
There is a pullback support level that lines up with the 38.2% Fibonacci retracement.
Stop loss: 1.8183
Why we like it:
There is a pullback support level that lines up with the 61.8% Fibonacci retracement.
Take profit: 1.8469
Why we like it:
There is an overlap resistance level.
Enjoying your TradingView experience? Review us!
Please be advised that the information presented on TradingView is provided to Vantage (‘Vantage Global Limited’, ‘we’) by a third-party provider (‘Everest Fortune Group’). Please be reminded that you are solely responsible for the trading decisions on your account. There is a very high degree of risk involved in trading. Any information and/or content is intended entirely for research, educational and informational purposes only and does not constitute investment or consultation advice or investment strategy. The information is not tailored to the investment needs of any specific person and therefore does not involve a consideration of any of the investment objectives, financial situation or needs of any viewer that may receive it. Kindly also note that past performance is not a reliable indicator of future results. Actual results may differ materially from those anticipated in forward-looking or past performance statements. We assume no liability as to the accuracy or completeness of any of the information and/or content provided herein and the Company cannot be held responsible for any omission, mistake nor for any loss or damage including without limitation to any loss of profit which may arise from reliance on any information supplied by Everest Fortune Group.

GBPCAD will Fly , All Confirmations are in the Bullish SideHello Traders
In This Chart GBPCAD HOURLY Forex Forecast By FOREX PLANET
today GBPCAD analysis 👆
🟢This Chart includes_ (GBPCAD market update)
🟢What is The Next Opportunity on GBPCAD Market
🟢how to Enter to the Valid Entry With Assurance Profit
This CHART is For Trader's that Want to Improve Their Technical Analysis Skills and Their Trading By Understanding How To Analyze The Market Using Multiple Timeframes and Understanding The Bigger Picture on the Chart

perfect long term GBPCAD sell setuptheres a divergence in currency indexes as well as a complete WXY on the weekly timeframe

GBP/CAD For Bearishyou can go short now
or
wait for pull-back near by entry point and then go short
general trend is up trend
current phase is pull-back
have fun :)

GBPCAD Tests Bearish Trendline – Focus Shifts to BoC DecisionGBPCAD is currently respecting a well-defined descending trendline, showing multiple rejections and a sustained series of lower highs. The latest retest near 1.8460 was met with selling pressure, aligning with the broader bearish channel.
Key Levels:
Current Price: 1.8458
Resistance Area: 1.8470 – 1.8600 (trendline & previous highs)
Support Targets:
TP1: 1.8120 (key structure)
TP2: 1.7980
TP3: 1.7900 (major support zone)
Bearish Technical Confluence:
✅ Multiple rejections at trendline
✅ Lower highs & lower lows continue
✅ Potential reversal candlestick pattern forming
✅ Bearish breakout could accelerate toward 1.7980
📉 Fundamental Outlook – BoC Rate Decision in Focus (April 16)
Market Sentiment Split:
Initially, economists leaned toward a BoC hold, as recent data and trade optimism gave the central bank room to pause.
However, March CPI undershot expectations, triggering increased speculation of a rate cut.
Key Data Highlights:
Headline CPI fell to 2.3% YoY vs 2.6% previously, well below the 2.7% forecast.
Drop mainly due to gasoline and transport costs, which BoC may look through.
Core inflation (median 2.9%, trimmed 2.8%) remains elevated, supporting arguments for a hold.
Analyst Viewpoint:
“We still marginally favor a BoC hold given the proximity to elections and resilience in core inflation, but our conviction is lower after the CPI miss.” – Knightley & Pesole, ING
Market Reaction:
Loonie sold off post-CPI, but analysts believe the sell-off may be short-lived if BoC surprises with a hawkish hold.
Swap market odds of a cut rose to 45%, up from 33% pre-CPI.
🎯 Combined Technical + Fundamental Setup
If BoC holds rates, expect CAD strength → GBPCAD could accelerate downward toward 1.8120 → 1.7900.
If BoC cuts, GBPCAD may spike temporarily toward 1.8600, but downside pressure may resume unless accompanied by dovish forward guidance.
🛠️ Trade Plan:
Sell Bias Below: 1.8470
Entry Trigger: Bearish confirmation or post-BoC rejection
TP1: 1.8120
TP2: 1.7980
TP3: 1.7900
Invalidation Zone: Break and close above 1.8600

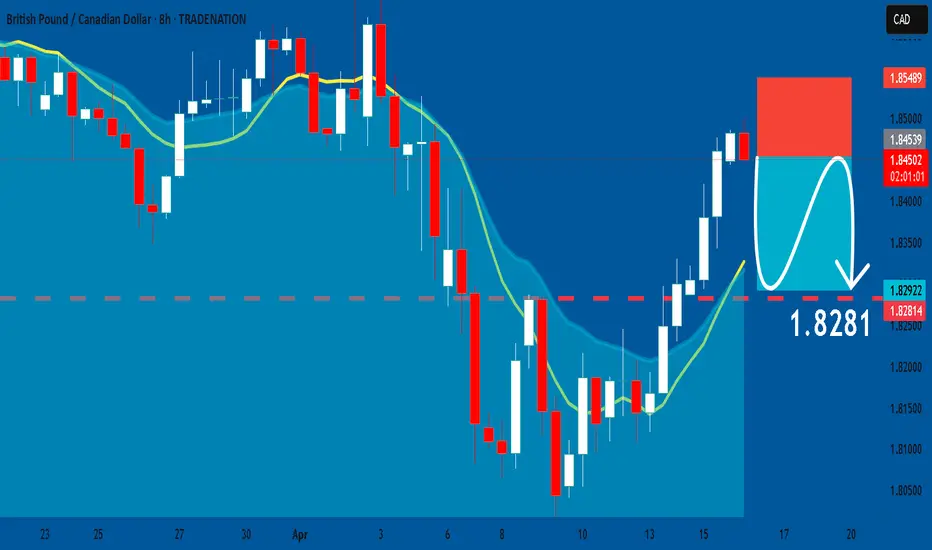
GBPCAD: Bearish Continuation & Short Trade
GBPCAD
- Classic bearish pattern
- Our team expects retracement
SUGGESTED TRADE:
Swing Trade
Sell GBPCAD
Entry - 1.8453
Stop - 1.8548
Take - 1.8281
Our Risk - 1%
Start protection of your profits from lower levels
Disclosure: I am part of Trade Nation's Influencer program and receive a monthly fee for using their TradingView charts in my analysis.
❤️ Please, support our work with like & comment! ❤️