CADGBP trade ideas

descending channel break outBearish butterfly on D1 has been invalidated, but a slight pullback before a bullish continuation, the overall trend is bullish, a descending channel on H4 has been broken and is being retested, bearish divergence to 1.845, as demand zone 1.840 holds.

GBP/CAD bullish sideways consolidation supported at 1.8470The GBP/CAD currency pair maintains a bullish sentiment, supported by the prevailing uptrend. Recent intraday price action shows a corrective pullback toward the previous consolidation zone and the support trendline area.
Bullish Scenario:
The key trading level to monitor is 1.8470, which represents the previous consolidation range. A successful bullish bounce from this level could trigger an upside move toward the 1.8750 resistance. Sustained bullish momentum could then target the next resistance levels at 1.8900 and 1.9020 over the longer timeframe.
Bearish Scenario:
Conversely, a decisive break below 1.8470, with a daily close below this level, would invalidate the bullish outlook. This could open the way for a deeper retracement toward 1.8350, with further downside potential targeting 1.8200.
Conclusion:
The overall sentiment remains bullish as long as 1.8470 holds as support. Traders should look for bullish confirmation at this level to sustain upward momentum. A break below 1.8470 would indicate a potential trend reversal, signaling further downside risk.
This communication is for informational purposes only and should not be viewed as any form of recommendation as to a particular course of action or as investment advice. It is not intended as an offer or solicitation for the purchase or sale of any financial instrument or as an official confirmation of any transaction. Opinions, estimates and assumptions expressed herein are made as of the date of this communication and are subject to change without notice. This communication has been prepared based upon information, including market prices, data and other information, believed to be reliable; however, Trade Nation does not warrant its completeness or accuracy. All market prices and market data contained in or attached to this communication are indicative and subject to change without notice.

SELLGod First
Minimum Risk Maximum Reward
Action Backed Believe
# faith, strategy, and execution all in one #

Trade Idea - Long $Gbpcad 📡 LONG Gbp/Cad
Entry 1 - 1.85404
Tp 1 - 1.86416
Tp 2 - 1.87785
🛑 SL - 1.84864
✌🏼use preferred confirmation for entry at POI
✌🏼apply proper risk management

GBPCAD: Bullish Price ActionThe 📈GBPCAD pair retested a horizontal structure that was previously broken on the 4-hour chart.
Following this retest, the price formed an inverse head and shoulders pattern and broke above a resistance line of a bullish flag pattern.
This suggests potential upward movement in the near future.
The next resistance level to watch is at 1.8692.

GBPCAD-NEUTRAL BUY strategy 3 hourly chart - KAGIWe are slightly on the upside for the moment for the pair. The pressure is upwards, and overcoming 18648 GANN resistance is likely to happen, is my personal view. The Fisher Form is positive, but others are yet to confirm the move.
Strategy (if wished for) BUY current 1.8615-1.8635 and take profit near 1.8725 for now.
Personally, would prefer to sit it out, and wait for SELL opportunity later on.

Buy GBPCAD Surely GBP have a Strong strength base Daily VS Cad have a weak strength base Daily then after a discount now its opportunity for a Buy
Only for Education


GBCAD-SELL strategy 9m hourly chart Line Break (2)The pair is in negative mode, and indicators support to see likely lower levels. FIB retracement 1.8342 should attract is my personal view.
Strategy SELL or ADD @ 1.8560-1.8590 range and take profit near 1.8357 for now.

GBPCAD BUY/LONG TM 2HBy utilizing Fibonacci retracement levels, historical patterns, , we can formulate a hypothesis that the market might follow a similar trajectory if bullish sentiment prevails.

SELLGod First
Minimum Risk Maximum Reward
Action Backed Believe
# faith, strategy, and execution all in one #

ABOUT GBPCADMy option about gbpcad Is more bearish so that zone is good and strong restanice if the price comes to that zone it can pullback


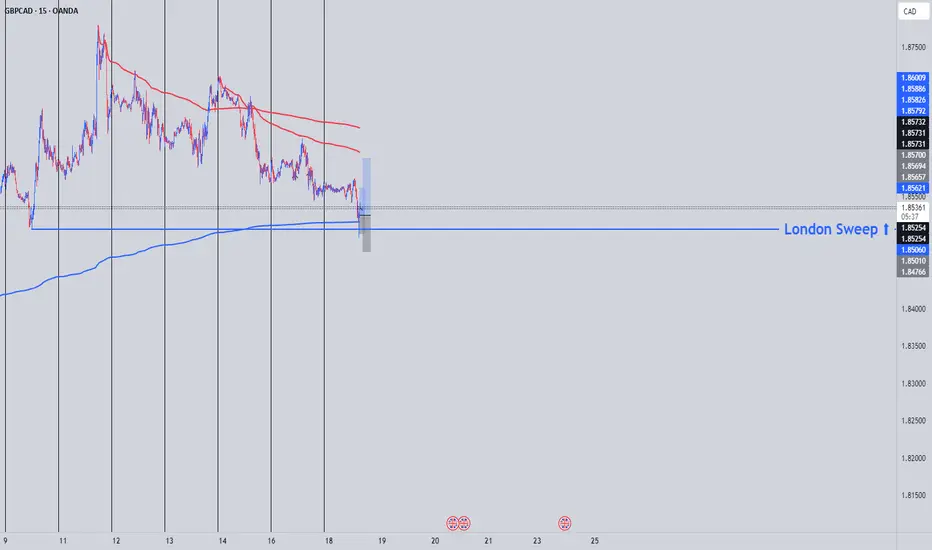
VWAP Setup on GBP/CAD with London SweepGBP/CAD has shown a strong reaction at VWAP support, with aggressive momentum and precise institutional buy-ins. Price has also swept a key London session low, which could act as a liquidity grab before a potential move higher.
Key Points:
VWAP Holding as Support – Price bounced off the two-day anchored VWAP with strong momentum.
London Low Sweep – A clear liquidity grab below a key session low before reversing.
Major Levels in Play – Some key levels have been broken, adding to the setup’s validity.
Fundamentals:
Neutral Bias – No strong fundamental drivers pushing GBP/CAD in either direction. This setup is mainly technical.
A clean VWAP setup with strong price action—worth keeping an eye on.
Buying opportunity on GBPCAD!From a technical perspective, the pair shows a bullish outlook, suggesting a continuation of the upward trend. A potential buying opportunity has been identified at the 1.85500 level, with price targets set at 1.86268 and 1.87109.

GBPCAD: Overbought Market, & Correctional MovementI believe the 📉GBPCAD pair is showing signs of being overbought.
On the 4-hour chart, there is a descending triangle pattern with the neckline being broken and a 4H candle closing below it.
This could indicate a correctional movement coming soon.
Targets for this correctional movement are at 1.8506 and 1.8446.

GBPCAD - Bear ??hi everyone...
i just share a chartpattern here.
its work or not, lets us see
disclaimer
this is not a signal

gbpcad sell tradeThe Relative Strength Index (RSI) is showing a downward trend, indicating weakening momentum. Additionally, the Moving Average Convergence Divergence (MACD) is showing a bearish crossover, further supporting the potential for a downward move

GBPCAD sells possibly. Looking to sell GBPCAD around 1.858 area. Looks like a solid reversal pattern/double divergence

GBPCAD Price ActionHello Traders,
As you can see, I've marked the Demand Zone, based on the 2-hour timeframe. Additionally, I've highlighted Liquidity Levels, clearly distinguishing between those already swept and the valid ones remaining.
On the 15M timeframe, you'll notice I've marked the Breakout Block, also identified as the Supply Zone. If the price breaks this Supply Zone, you should set a pending order. There are two effective ways to enter this market: either through an FVG (Fair Value Gap) or a Breaker Block entry.
Your trade can be held for up to one day, with the stop-loss positioned at the recent swing low. Remember, it's crucial to manage your risk responsibly and avoid greed. This structure repeats itself consistently.
Wishing you the best and happy trading!
Thank you.

GBPCAD BUY PROJECTION As we could see price broke out of a strong supply zone, now becoming a demand zone...some call it flip zone. So price takes out liquidity and then hit our orderblock before going long
Mon 17th Mar 2025 GBP/CAD Daily Forex Chart Sell SetupGood morning fellow traders. On my Daily Forex charts using the High Probability & Divergence trading methods from my books, I have identified a new trade setup this morning. As usual, you can read my notes on the chart for my thoughts on this setup. The trade being a GBP/CAD Sell. Enjoy the day all. Cheers. Jim
