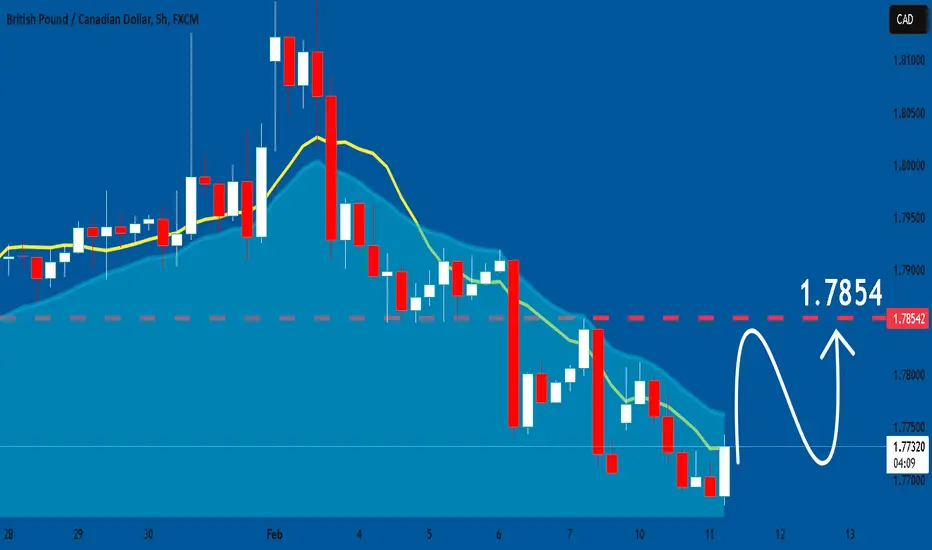
GBP_CAD APPROACHING RESISTANCE|SHORT|
✅GBP_CAD is going up to retest a horizontal resistance of 178.720
Which makes me locally bearish biased
And I think that we will see a pullback
And a move down from the level
Towards the target below at 177.290
SHORT🔥
✅Like and subscribe to never miss a new idea!✅
CADGBP trade ideas

Bearish reversal?GBP/CAD is rising towards the pivot and could drop to the 1st support which is a pullback support.
Pivot: 1.7854
1st Support: 1.7661
1st Resistance: 1.7926
Risk Warning:
Trading Forex and CFDs carries a high level of risk to your capital and you should only trade with money you can afford to lose. Trading Forex and CFDs may not be suitable for all investors, so please ensure that you fully understand the risks involved and seek independent advice if necessary.
Disclaimer:
The above opinions given constitute general market commentary, and do not constitute the opinion or advice of IC Markets or any form of personal or investment advice.
Any opinions, news, research, analyses, prices, other information, or links to third-party sites contained on this website are provided on an "as-is" basis, are intended only to be informative, is not an advice nor a recommendation, nor research, or a record of our trading prices, or an offer of, or solicitation for a transaction in any financial instrument and thus should not be treated as such. The information provided does not involve any specific investment objectives, financial situation and needs of any specific person who may receive it. Please be aware, that past performance is not a reliable indicator of future performance and/or results. Past Performance or Forward-looking scenarios based upon the reasonable beliefs of the third-party provider are not a guarantee of future performance. Actual results may differ materially from those anticipated in forward-looking or past performance statements. IC Markets makes no representation or warranty and assumes no liability as to the accuracy or completeness of the information provided, nor any loss arising from any investment based on a recommendation, forecast or any information supplied by any third-party.

GBPCAD: Bullish Continuation
It is essential that we apply multitimeframe technical analysis and there is no better example of why that is the case than the current GBPCAD chart which, if analyzed properly, clearly points in the upward direction.
❤️ Please, support our work with like & comment! ❤️
Institutional Demand: GBP/CAD longsHey,
Besides the JPY pairs, this one is shaping up as well.
Price is already in value, just need the 4-hour confirmation.
Would be nice if we get it today.
Kind regards,
Max Nieveld

+350 pips Advanced BUY/HOLD GBPCAD XABCD swing trade setup BULLS🔸Hello traders, let's review the 4 hour chart for GBPCAD. Speculative XABCD in progress, with PRZ/D set at 8360, so expecting more losses in GBPCAD before reversal from point C.
🔸XABCD structure is defined by point X at 8200, point A at 7510, point B
at 8080, point C at 7630, point D/PRZ at 8360, currently most points validated, point C/PRZ still pending, so traders should wait until we hit C before buying.
🔸Recommended strategy for GBPCAD traders: wait for pullback/correction
to complete at point C near 7630, buy/hold, SL 75 pips, TP1 +350 pips TP2
+700 pips. BUY/HOLD at point C/PRZ at 7630. swing trade setup. good luck!
🎁Please hit the like button and
🎁Leave a comment to support our team!
RISK DISCLAIMER:
Trading Futures , Forex, CFDs and Stocks involves a risk of loss.
Please consider carefully if such trading is appropriate for you.
Past performance is not indicative of future results.
Always limit your leverage and use tight stop loss.

Bullish bounce off 78.6% Fibonacci support?GBP/CAD is falling towards the pivot and could bounce to the pullback resistance/
Pivot: 1.7632
1st Support: 1.7516
1st Resistance: 1.7787
Risk Warning:
Trading Forex and CFDs carries a high level of risk to your capital and you should only trade with money you can afford to lose. Trading Forex and CFDs may not be suitable for all investors, so please ensure that you fully understand the risks involved and seek independent advice if necessary.
Disclaimer:
The above opinions given constitute general market commentary, and do not constitute the opinion or advice of IC Markets or any form of personal or investment advice.
Any opinions, news, research, analyses, prices, other information, or links to third-party sites contained on this website are provided on an "as-is" basis, are intended only to be informative, is not an advice nor a recommendation, nor research, or a record of our trading prices, or an offer of, or solicitation for a transaction in any financial instrument and thus should not be treated as such. The information provided does not involve any specific investment objectives, financial situation and needs of any specific person who may receive it. Please be aware, that past performance is not a reliable indicator of future performance and/or results. Past Performance or Forward-looking scenarios based upon the reasonable beliefs of the third-party provider are not a guarantee of future performance. Actual results may differ materially from those anticipated in forward-looking or past performance statements. IC Markets makes no representation or warranty and assumes no liability as to the accuracy or completeness of the information provided, nor any loss arising from any investment based on a recommendation, forecast or any information supplied by any third-party.

GBP/CAD NEXT MOVESell after bearish candle stick pattern, buy after bullish candle stick pattern....
Best bullish pattern , engulfing candle or green hammer
Best bearish pattern , engulfing candle or red shooting star
NOTE: IF YOU CAN'T SEE ANY OF TOP PATTERN IN ZONE DO NOT ENTER
Stop lost before pattern
R/R 1/3
Trade in 5 Min Timeframe, use signal for scalping

Trend lineit going down probable till where the horizontal line is at, I'm definitely entering again.

GBP/CAD "Pound vs Canadian" Forex Market Bullish Heist Plan🌟Hi! Hola! Ola! Bonjour! Hallo!🌟
Dear Money Makers & Thieves, 🤑 💰🐱👤
Based on 🔥Thief Trading style technical and fundamental analysis🔥, here is our master plan to heist the GBP/CAD "Pound vs Canadian" Forex market. Please adhere to the strategy I've outlined in the chart, which emphasizes long entry. Our aim is the high-risk Red Zone. Risky level, overbought market, consolidation, trend reversal, trap at the level where traders and bearish robbers are stronger. 🏆💸Be wealthy and safe trade.💪🏆🎉
Entry 📈 : "The vault is wide open! Swipe the Bullish loot at any price - the heist is on!
however I advise placing Buy Stop Orders above the breakout MA or Place Buy limit orders within a 15 or 30 minute timeframe. Entry from the most re cent or closest low or high level should be in retest.
Stop Loss 🛑: Thief SL placed at the recent / nearest low level Using the 4H timeframe,
SL is based on your risk of the trade, lot size and how many multiple orders you have to take.
Target 🎯: 1.85000 (or) Escape Before the Target
Scalpers, take note 👀 : only scalp on the Long side. If you have a lot of money, you can go straight away; if not, you can join swing traders and carry out the robbery plan. Use trailing SL to safeguard your money 💰.
📰🗞️Fundamental, Macro, COT, Sentimental Outlook:
GBP/CAD "Pound vs Canadian" Forex Market is currently experiencing a Bullish trend., driven by several key factors.
🟡Fundamental Analysis:
The UK's economic growth has been slow, but the Bank of England's interest rate decisions may provide support for the pound. Canada's economy has been affected by the decline in oil prices, which may impact the Canadian dollar.
🔴Macroeconomic Factors:
UK Inflation: 2.5% (August), expected to remain low
Canada Inflation: 2.1% (July), expected to rise
UK Unemployment: 3.9% (July), expected to remain low
Canada Unemployment: 5.7% (July), expected to rise
UK GDP Growth: 1.0% (Q2), expected to slow down
Canada GDP Growth: 1.3% (Q2), expected to slow down
🟤COT Report:
The Commitment of Traders (COT) report shows that institutional traders are net long on the GBP/CAD pair, indicating a bullish sentiment.
🟣Market Sentiment:
Bullish: 65%
Bearish: 35%
Neutral: 0%
Retail Trader Sentiment:
Long: 70%
Short: 30%
Institutional Trader Sentiment:
Long: 60%
Short: 40%
🟢Overall Outlook:
The GBP/CAD pair is likely to continue its bullish trend, driven by the UK's economic growth prospects and the Bank of England's interest rate decisions. A strong break above the resistance level could confirm the uptrend.
⚠️Trading Alert : News Releases and Position Management 📰 🗞️ 🚫🚏
As a reminder, news releases can have a significant impact on market prices and volatility. To minimize potential losses and protect your running positions,
we recommend the following:
Avoid taking new trades during news releases
Use trailing stop-loss orders to protect your running positions and lock in profits
📌Please note that this is a general analysis and not personalized investment advice. It's essential to consider your own risk tolerance and market analysis before making any investment decisions.
📌Keep in mind that these factors can change rapidly, and it's essential to stay up-to-date with market developments and adjust your analysis accordingly.
💖Supporting our robbery plan will enable us to effortlessly make and steal money 💰💵 Tell your friends, Colleagues and family to follow, like, and share. Boost the strength of our robbery team. Every day in this market make money with ease by using the Thief Trading Style.🏆💪🤝❤️🎉🚀
I'll see you soon with another heist plan, so stay tuned 🤑🐱👤🤗🤩

GBP/CAD "Pound vs Canadian" Forex Market Bearish Heist Plan🌟Hi! Hola! Ola! Bonjour! Hallo!🌟
Dear Money Makers & Thieves, 🤑 💰🐱👤
Based on 🔥Thief Trading style technical and fundamental analysis🔥, here is our master plan to heist the GBP/CAD "Pound vs Canadian" Forex market. Please adhere to the strategy I've outlined in the chart, which emphasizes long entry. Our aim is the high-risk Red Zone. Risky level, overbought market, consolidation, trend reversal, trap at the level where traders and bearish robbers are stronger. 🏆💸Be wealthy and safe trade.💪🏆🎉
Entry 📈 : "The vault is wide open! Swipe the Bullish loot at any price - the heist is on!
however I advise placing Buy Stop Orders above the breakout MA or Place Buy limit orders within a 15 or 30 minute timeframe. Entry from the most re cent or closest low or high level should be in retest.
Stop Loss 🛑: Thief SL placed at the recent / nearest low level Using the 4H timeframe,
SL is based on your risk of the trade, lot size and how many multiple orders you have to take.
Target 🎯: 1.85000 (or) Escape Before the Target
Scalpers, take note 👀 : only scalp on the Long side. If you have a lot of money, you can go straight away; if not, you can join swing traders and carry out the robbery plan. Use trailing SL to safeguard your money 💰.
📰🗞️Fundamental, Macro, COT, Sentimental Outlook:
GBP/CAD "Pound vs Canadian" Forex Market is currently experiencing a Bullish trend., driven by several key factors.
🟡Fundamental Analysis:
The UK's economic growth has been slow, but the Bank of England's interest rate decisions may provide support for the pound. Canada's economy has been affected by the decline in oil prices, which may impact the Canadian dollar.
🔴Macroeconomic Factors:
UK Inflation: 2.5% (August), expected to remain low
Canada Inflation: 2.1% (July), expected to rise
UK Unemployment: 3.9% (July), expected to remain low
Canada Unemployment: 5.7% (July), expected to rise
UK GDP Growth: 1.0% (Q2), expected to slow down
Canada GDP Growth: 1.3% (Q2), expected to slow down
🟤COT Report:
The Commitment of Traders (COT) report shows that institutional traders are net long on the GBP/CAD pair, indicating a bullish sentiment.
🟣Market Sentiment:
Bullish: 65%
Bearish: 35%
Neutral: 0%
Retail Trader Sentiment:
Long: 70%
Short: 30%
Institutional Trader Sentiment:
Long: 60%
Short: 40%
🟢Overall Outlook:
The GBP/CAD pair is likely to continue its bullish trend, driven by the UK's economic growth prospects and the Bank of England's interest rate decisions. A strong break above the resistance level could confirm the uptrend.
⚠️Trading Alert : News Releases and Position Management 📰 🗞️ 🚫🚏
As a reminder, news releases can have a significant impact on market prices and volatility. To minimize potential losses and protect your running positions,
we recommend the following:
Avoid taking new trades during news releases
Use trailing stop-loss orders to protect your running positions and lock in profits
📌Please note that this is a general analysis and not personalized investment advice. It's essential to consider your own risk tolerance and market analysis before making any investment decisions.
📌Keep in mind that these factors can change rapidly, and it's essential to stay up-to-date with market developments and adjust your analysis accordingly.
💖Supporting our robbery plan will enable us to effortlessly make and steal money 💰💵 Tell your friends, Colleagues and family to follow, like, and share. Boost the strength of our robbery team. Every day in this market make money with ease by using the Thief Trading Style.🏆💪🤝❤️🎉🚀
I'll see you soon with another heist plan, so stay tuned 🤑🐱👤🤗🤩

GBP/CAD BEST PLACE TO SELL FROM|SHORT
Hello, Friends!
GBP/CAD pair is in the uptrend because previous week’s candle is green, while the price is obviously rising on the 1H timeframe. And after the retest of the resistance line above I believe we will see a move down towards the target below at 1.774 because the pair overbought due to its proximity to the upper BB band and a bearish correction is likely.
✅LIKE AND COMMENT MY IDEAS✅

SELL GBPCAD - A 'Top Down Approach' to tradingTrader Tom, a technical analyst with over 16 years’ experience, explains his trade idea using price action and a top down approach. This is one of many trades so if you would like to see more then please follow us and hit the boost button.
We are proud to be an OFFICIAL Trading View partner so please support the channel by using the link below and unleash the power of trading view today!
www.tradingview.com

GBPCAD REVERSAL Technically:
GBPCAD printing bullish divergence
GBPCAD is trading at golden pocket fib 0.5 to 0.6
Fundamentally:
According to COT data
BXY is bullish
CXY is bearish


Buy gbpcadIf the channel break then straight sell towards our mention target
But mostly chance to buy recently, trading in buy channel and failed many times to break higher low
Now on month time frmae long term buy opportunity wait for low time frmae confirmation
Trade with caution

GBPCAD My buy projection for coming weeks. Entry, stoploss and profit target as specified on the chart. Wait for it

GBPCADOn February 6, 2025, the Canadian dollar rejected a supply roof on 4hrs after January employment reports from both Canada tested positive the Canadian dollar
The actual Canadian jobs data, released on February 7, showed that the Canadian economy added 76,000 jobs in January, significantly exceeding market expectations of 25,000. Canada's unemployment rate also edged down to 6.6%, which was better than the forecast of 6.8%
The Canadian dollar gained 0.2% following the release of the jobs data and GBPCAD took a 4hr rejection at 1.78715 to close the day in gain.. This positive jobs report shrunk the currency swap market bets for a rate cut of 25 basis points in March to 58% from 72% earlier.
Tiff Macklem the Governor of the Bank of Canada will need to learn from the bank of japan (boj)governor Kazuo Ueda on how he managed to change trade directional bias with strong economic policies.

GBPCAD: Long Signal with Entry/SL/TP
GBPCAD
- Classic bullish formation
- Our team expects pullback
SUGGESTED TRADE:
Swing Trade
Long GBPCAD
Entry - 1.7706
Sl - 1.7598
Tp - 1.7900
Our Risk - 1%
Start protection of your profits from lower levels
❤️ Please, support our work with like & comment! ❤️

GBPCAD High-Probability Trade: SHORT SETUP (Trend Continuation)🔹 Trade Type: Swing Trade / Trend Continuation
🔹 Entry Type: Limit Order (Pending Short Entry)
🔹 Confidence Level: High (80%+)
📉 SHORT ENTRY (SELL)
Sell Entry: 1.78450 – 1.78550 (Unmitigated Order Block)
Stop Loss: 1.79400 (Above Previous High & Unmitigated OB)
Take Profit Targets:
TP1: 1.77500 (First Major Liquidity Level)
TP2: 1.77000 (Key Structural Target & Liquidity Pool)
TP3: 1.76500 (Final Bearish Target)
Risk: Reward Ratio: 5R+ (High-Probability Trade)
Reasoning for Short Setup:
✅ HTF Bearish Confirmation (Daily BOS)
✅ 4H Order Block & FVG Resistance (1.78500 – 1.79000)
✅ Liquidity Grab at 1.81000 Before Drop (Smart Money Manipulation)
✅ Bearish Momentum & Trend Confirmation on All Timeframes
✅ Wyckoff Distribution in Play → Downtrend Continuation
✅ Strong Confluence Between Order Flow, Liquidity, and Market Structure

GBPCADhe canadian data Statistics shows that Employment Change in The Canadian economy added 76,000 jobs in January
Unemployment Rate: The unemployment rate edged down to 6.6%368.
Comparison to Forecasts and Previous Data:
The actual Employment Change of 76,000 significantly exceeded the forecast of 25.5K and was lower than the previous figure of 90.9K
The Unemployment Rate of 6.6% was better than the forecast of 6.8% and a notch below the previous month's 6.7%
Broader Context and Analysis:
December 2024 saw an increase of 91,000 in employment, with the unemployment rate easing to 6.7%
The December numbers were firmer than expected, although the unemployment rate was still up almost a percentage point from a year prior.
In January 2025, the unemployment rate dropped again to 6.6%3.
we take a bat canadian econmy and GBPCAD went in favour of CAD.

GBPCADTiff Macklem is the Governor of the Bank of Canada
Bank of Canada Governor's comments on economic challenges:
Macklem has stated that central banks face increasing challenges due to potential U.S. tariffs, technological disruptions, extreme weather, and global political upheaval.
He acknowledges that while monetary policy can help with the short-term impacts of tariffs, it cannot solve every economic challenge.
Macklem also mentioned the world is increasingly vulnerable to shocks amid higher long-term interest rates, slower economic growth, war and rising trade protectionism, as well as the rise of artificial intelligence technology and more frequent catastrophic weather events.
The threat of new tariffs is causing major uncertainty.
Potential Impact of Employment Data on CAD:
Given that the Canadian dollar fell by 0.3 percent after the Bank of Canada's recent interest rate cut5, today's employment data could influence the CAD depending on whether the actual figures align with or deviate from the forecasts.
Employment Change: If the actual Employment Change is significantly higher than the forecast of 25.5K, it could be seen as a positive sign for the Canadian economy, potentially leading to an increase in the value of the CAD. A lower figure could weaken the CAD.
Unemployment Rate: If the Unemployment Rate remains stable or decreases, it could also support the CAD. However, an increase above the forecasted 6.8% might negatively impact the currency.
Broader context: The Bank of Canada has been cutting its key interest rate since the middle of last year to spur spending and boost the economy.
Trade tensions: The central bank's dilemma lies in the fact that US tariffs could potentially increase inflation—suggesting the need for higher interest rates—while simultaneously hindering growth, which could, in theory, necessitate more stimulus through lower rates.

GBPCAD - Bearish ReversalGBPCAD has broken trendline and last HL after forming a bearish divergence on 4H timeframe.
