#011: Long Investment Opportunity on GBP/CAD
After weeks of compression, GBP/CAD is showing clear signs of institutional accumulation. The price recently released a false bearish breakout below 1.8400, followed by a reabsorption and spike with decreasing volumes: a typical "retail flush" structure.
Added to this are clear macro elements:
The pound is supported by a still-tight monetary policy, with the BoE maintaining a hawkish tone.
The Canadian dollar is suffering from declining oil expectations and the risk of a more rapid rate cut by the BoE.
📉 What happened?
The market attempted to "clear" the 1.838–1.840 zone with a rapid, unfollow-through bearish move. This behavior, combined with the Open Interest reading and retail positioning, suggests an institutional entry intention in the area between 1.8375 and 1.8365.
📈 Positioning
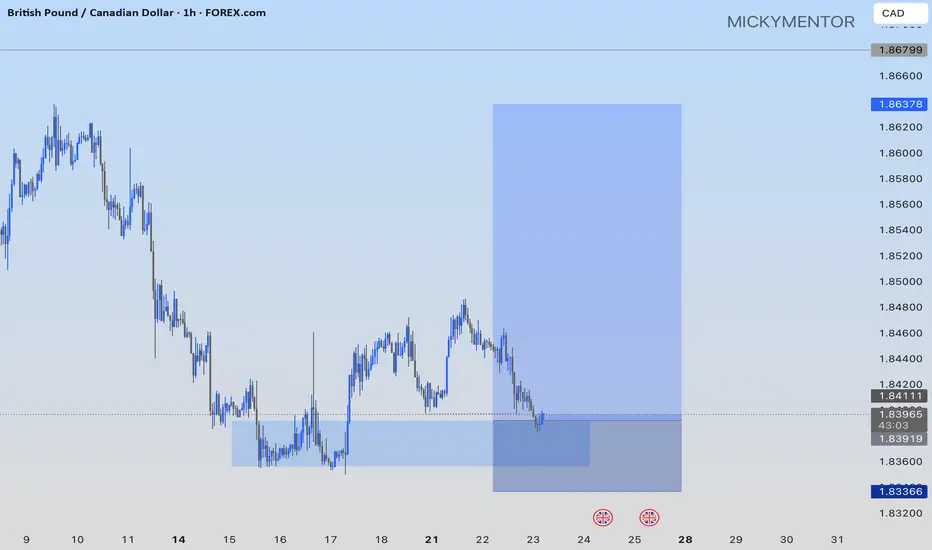
A Buy Limit was placed at 1.83740, with a wide Stop Loss at 1.82890, outside any visible hunting zone, and a Take Profit at 1.86280, where profit-taking has historically occurred on similar patterns.
🎯 Main motivations for long
Accumulation visible with stop-hunt below support at 1.8400
Net long GBP futures position
Retail short above 70%, a typical reversal signal
No significant volume obstacles until 1.8620
Psychological resistance already tested (1.846, 1.850)
⏳ Estimated timeframe
The setup could develop over several days, with the first movement as early as today (Friday) and completion by mid-next week. The intention is to follow the banking flow, without anticipating or reacting to emotional price movements.
CADGBP trade ideas

GBP_CAD RISKY SETUP|LONG|
✅GBP_CAD is going down to retest
A horizontal support of 1.8320
Which makes me locally bullish biased
And I think that we will see a rebound
And a move up from the level
Towards the target above at 1.8380
LONG🚀
✅Like and subscribe to never miss a new idea!✅
Disclosure: I am part of Trade Nation's Influencer program and receive a monthly fee for using their TradingView charts in my analysis.

GBPCAD - Long-Term Long!Hello TradingView Family / Fellow Traders. This is Richard, also known as theSignalyst.
📈GBPCAD has been overall bullish trading within the rising wedge pattern marked in blue.
This week, GBPCAD has been retesting the lower bound of the wedge.
Moreover, the red zone is a strong weekly structure.
🏹 Thus, the highlighted blue circle is a strong area to look for buy setups as it is the intersection of the lower blue trendline and red structure.
📚 As per my trading style:
As #GBPCAD approaches the blue circle zone, I will be looking for trend-following bullish reversal setups (like a double bottom pattern, trendline break , and so on...)
📚 Always follow your trading plan regarding entry, risk management, and trade management.
Good luck!
All Strategies Are Good; If Managed Properly!
~Rich
Disclosure: I am part of Trade Nation's Influencer program and receive a monthly fee for using their TradingView charts in my analysis.

GBPCAD | One Kiss at 1.8390, and I’m All In!The big picture of GBPCAD is BUY possible up to 1.8550
See the H4 BUY range?
It slid love note to BUY into my DMs since 17/JulY. I didn't fall blindly since H4 SELL range came in like a jealous ex.
So I flipped to SELL and I shared my love signal with you here. (check my last week GBPCAD signal).
See that bottom black line at 1.8370?
It got a gentle kiss from the Daily candle (REJECTION).
Then 15m already whispered, "a sweet breakout"!
📌LONG STORY SHORT, I'M BUY AT 1.8390
If H4 comes and kisses 1.8390 (just a touch and wick), I’m BUYING — no more playing hard to get. 😘
TP? 1.8490 — that’s a sweet 100-pips date night!
But if it cuddles (closes by body) That’s it — my heart will be broken. 💔
WISH ME LUCK...or TISSUES! 😂!!!

GBPCAD 15M SHORT BUY THEN BIG SELL15m range turn SELL
Note: The 15 SELL is inside BUY range.
So we need to BUY first
WAIT for confirmation around 1.8425. Once done price will bull up to 1.8466-1.8480 before SELL to 1.8380

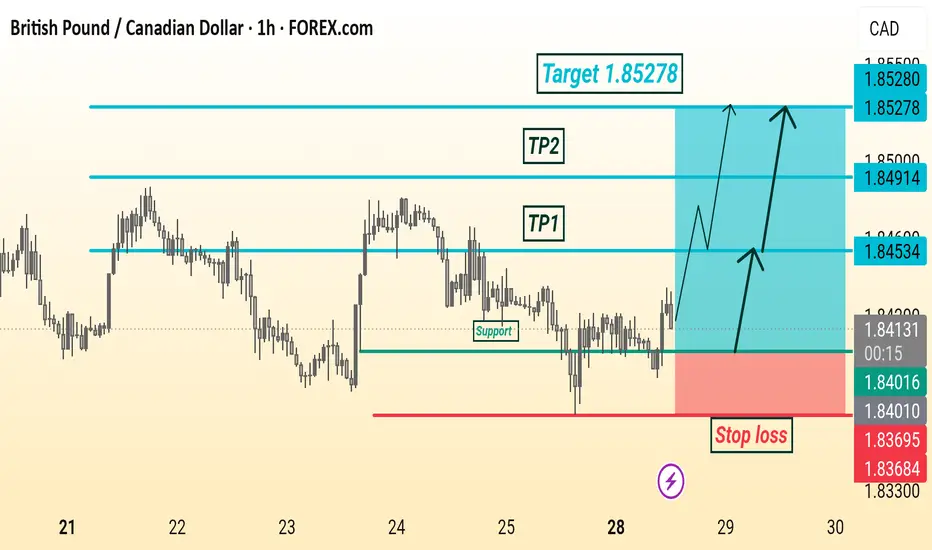
GBP/CAD Analysis Is Ready Move Will Be FlyThis is a bullish trade setup for GBP/CAD on the 1-hour chart. Price is expected to rise from the current level (1.84177) after bouncing from a support zone. The chart shows two potential take profit levels:
TP1 at 1.84534
TP2 at 1.84914
Final target is 1.85278, with a stop loss placed below support at 1.83684. Arrows suggest possible upward price movements
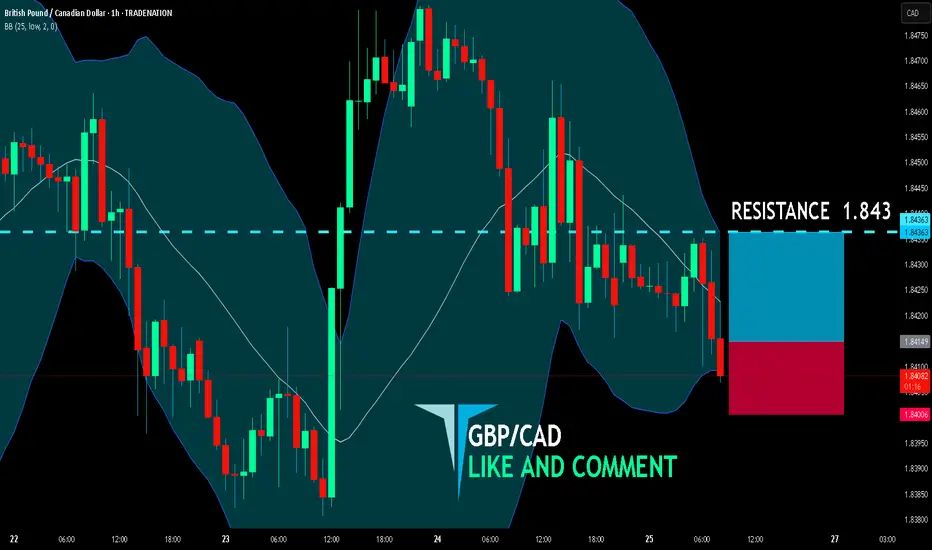
GBP/CAD 4H Setup – Bearish Rejection at Key ZonePrice retested the 1.8420–1.8437 supply zone and showed a clear rejection, aligning with the previous trendline break. We're now seeing lower highs forming with bearish momentum.
🔻 Entry: Around 1.8410 – 1.8400
🎯 Target: 1.8313 (previous demand zone)
🛑 Stop Loss: 1.8437 (above structure)
Bias: Bearish below 1.8437 zone
If momentum continues, price could drop toward the 1.8310 support zone. Structure shows clean bearish control unless a breakout occurs back above the supply area.

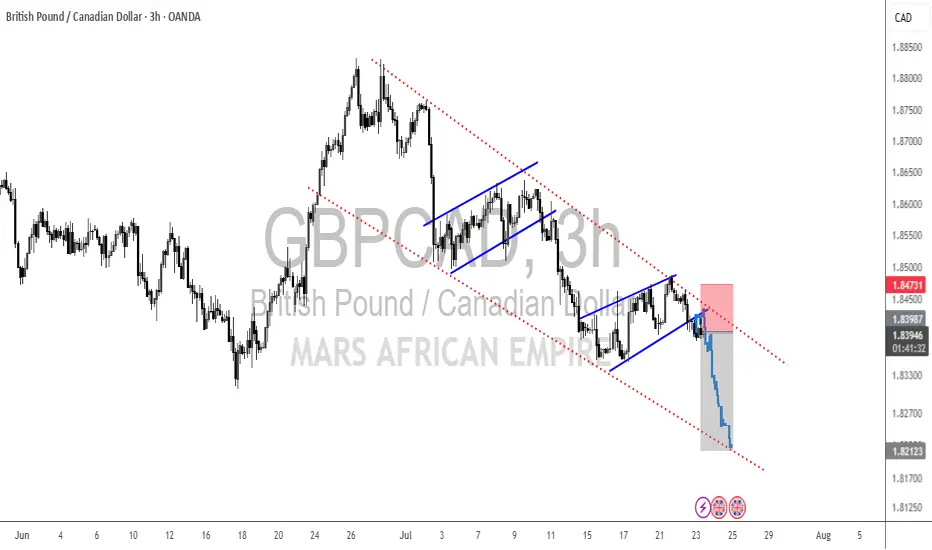
GBPCAD a short-term long trade into a HTF short area.GBPCAD presents a potential LTF long trade into a HTF short area. I am overall still bearish biased, but considering we have gaps to the top of the structure we might get an opportunity for a short-term counter long trade to finish the consolidation before we see the next bigger move to the downside.
📈 Simplified Trading Rules:
> Follow a Valid Sequence
> Wait for Continuation
> Confirm Entry (valid candlestick pattern)
> Know When to Exit (SL placement)
Remember, technical analysis is subjective; develop your own approach. I use this format primarily to hold myself accountable and to share my personal market views.
⚠ Ensure you have your own risk management in place and always stick to your trading plan.

GBPCAD: Growth & Bullish Continuation
The price of GBPCAD will most likely increase soon enough, due to the demand beginning to exceed supply which we can see by looking at the chart of the pair.
Disclosure: I am part of Trade Nation's Influencer program and receive a monthly fee for using their TradingView charts in my analysis.
❤️ Please, support our work with like & comment! ❤️

GBP/CAD BUYERS WILL DOMINATE THE MARKET|LONG
GBP/CAD SIGNAL
Trade Direction: long
Entry Level: 1.841
Target Level: 1.843
Stop Loss: 1.840
RISK PROFILE
Risk level: medium
Suggested risk: 1%
Timeframe: 1h
Disclosure: I am part of Trade Nation's Influencer program and receive a monthly fee for using their TradingView charts in my analysis.
✅LIKE AND COMMENT MY IDEAS✅
BUY GBPCADHere is an opportunity to reenter buy positions on GBPCAD. The bullish trend has officially began.

GBPCAD SHORTMarket structure bearish on HTFs DW
Entry at both Weekly and Daily AOi
Weekly Rejection at AOi
Previous Weekly Structure Point
Daily Rejection at AOi
Daily EMA retest
Around Psychological Level 1.85000
H4 Candlestick rejection
Levels 5.3
Entry 90%
REMEMBER : Trading is a Game Of Probability
: Manage Your Risk
: Be Patient
: Every Moment Is Unique
: Rinse, Wash, Repeat!
: Christ is King.

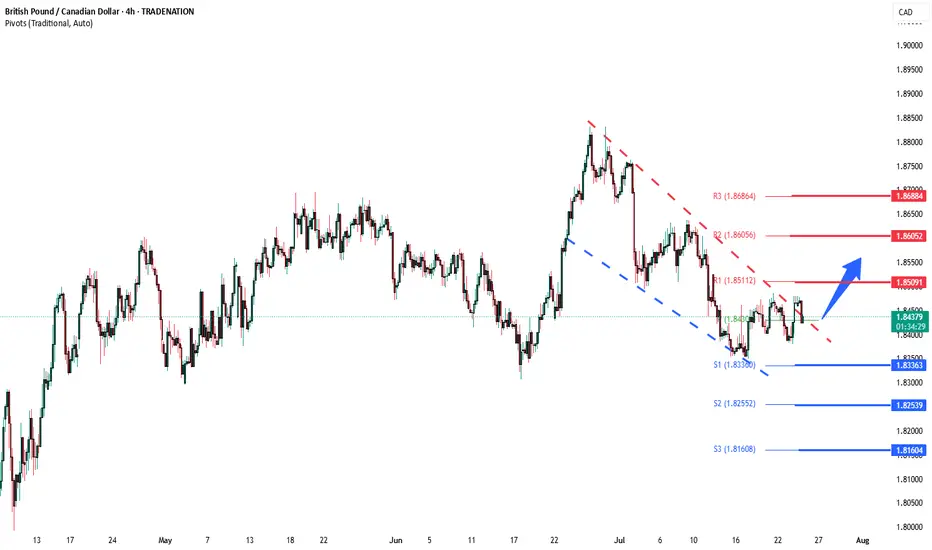
GBPCAD Bullish breakout supported at 1.8336The GBPCAD remains in a bullish trend, with recent price action showing signs of a corrective pullback within the broader uptrend.
Support Zone: 1.8336 – a key level from previous consolidation. Price is currently testing or approaching this level.
A bullish rebound from 1.8336 would confirm ongoing upside momentum, with potential targets at:
1.8510 – initial resistance
1.8600 – psychological and structural level
1.8690 – extended resistance on the longer-term chart
Bearish Scenario:
A confirmed break and daily close below 1.8336 would weaken the bullish outlook and suggest deeper downside risk toward:
1.8254 – minor support
1.8160 – stronger support and potential demand zone
Outlook:
Bullish bias remains intact while the GBPCAD holds above 1.8336. A sustained break below this level could shift momentum to the downside in the short term.
This communication is for informational purposes only and should not be viewed as any form of recommendation as to a particular course of action or as investment advice. It is not intended as an offer or solicitation for the purchase or sale of any financial instrument or as an official confirmation of any transaction. Opinions, estimates and assumptions expressed herein are made as of the date of this communication and are subject to change without notice. This communication has been prepared based upon information, including market prices, data and other information, believed to be reliable; however, Trade Nation does not warrant its completeness or accuracy. All market prices and market data contained in or attached to this communication are indicative and subject to change without notice.
GBPCAD Q3 | D24 | W30 | Y25📊GBPCAD Q3 | D24 | W30 | Y25
Daily Forecast🔍📅
Here’s a short diagnosis of the current chart setup 🧠📈
Higher time frame order blocks have been identified — these are our patient points of interest 🎯🧭.
It’s crucial to wait for a confirmed break of structure 🧱✅ before forming a directional bias.
This keeps us disciplined and aligned with what price action is truly telling us.
📈 Risk Management Protocols
🔑 Core principles:
Max 1% risk per trade
Only execute at pre-identified levels
Use alerts, not emotion
Stick to your RR plan — minimum 1:2
🧠 You’re not paid for how many trades you take, you’re paid for how well you manage risk.
🧠 Weekly FRGNT Insight
"Trade what the market gives, not what your ego wants."
Stay mechanical. Stay focused. Let the probabilities work.
FRGNT

GBPCAD--BUY4h timeframe
--break of descending line (orange line)
--BUY at level around 1.84350
--TP is at upper line of ascending channel

GBPCAD H4 TIMEFRAME. BIG MOVE IS EXPECTED!From the H4 timeframe, price aggressively pushed to the support level of 1.83460 we’re waiting for the next update on price to either see a rebound around the support level or a break below the level. We keep a close watch.

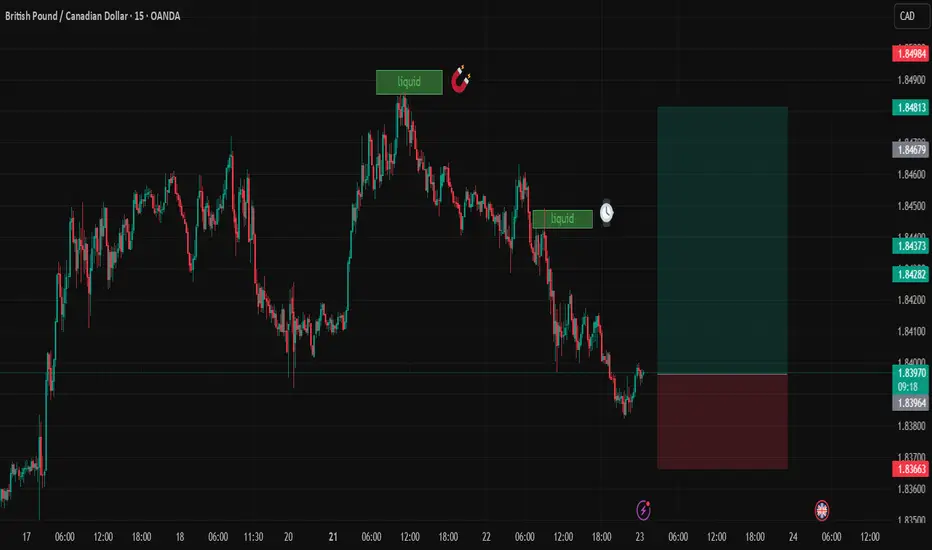
GBPCADDate:
July 23,2025
Session:
Tokyo and London session
Pair:
GBPCAD
Bias:
Long
2 liquidity pools that are waiting to be swept this week. Looks like price is gonna be magnetized towards these levels during London and Tokyo. The trade may even stretch into NYC.
Entry: 1.83970
Stop Loss: 1.83674
Target: 1.84811
RR: 2.82
GBPCAD Moving UpAs per our previous analysis GBPCAD has taken off. We can expect a reversal to breakeven point, do not hesitate to add more positions.

LONG ON GBP/CADGBP/CAD is now at a major key area/demand zone after completing its pullback phase.
I expect price to now rise to the next level of supply or previous high.
looking to catch 200-400 pips throughout the week.

GBPCAD Is Very Bullish! Buy!
Please, check our technical outlook for GBPCAD.
Time Frame: 4h
Current Trend: Bullish
Sentiment: Oversold (based on 7-period RSI)
Forecast: Bullish
The market is approaching a significant support area 1.841.
The underlined horizontal cluster clearly indicates a highly probable bullish movement with target 1.848 level.
P.S
The term oversold refers to a condition where an asset has traded lower in price and has the potential for a price bounce.
Overbought refers to market scenarios where the instrument is traded considerably higher than its fair value. Overvaluation is caused by market sentiments when there is positive news.
Disclosure: I am part of Trade Nation's Influencer program and receive a monthly fee for using their TradingView charts in my analysis.
Like and subscribe and comment my ideas if you enjoy them!

GBPCAD SELLSH4 double top with broken neckline at a strong daily zone, bearish flag was also formed. Looking at next daily support around 1.81500

GBPCAD: I’M BUYING NOW!!!OANDA:GBPCAD I’m buying at the current market price with my target at 1.86378