CADGBP trade ideas

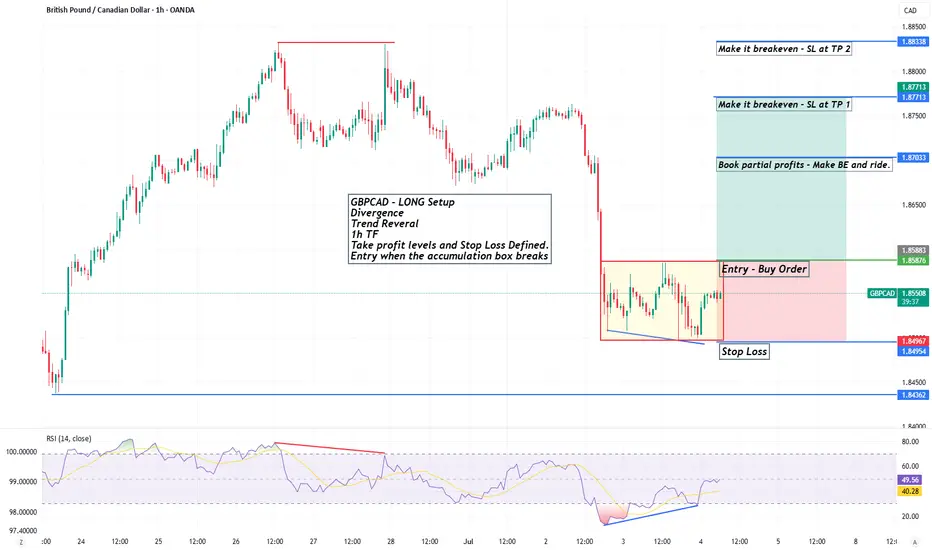
GBPCAD - LONG SetupGBPCAD - LONG Setup
Divergence
Trend Reveral
1h TF
Take profit levels and Stop Loss Defined with suggestion for breakeven and partial profits
Entry when the accumulation box breaks
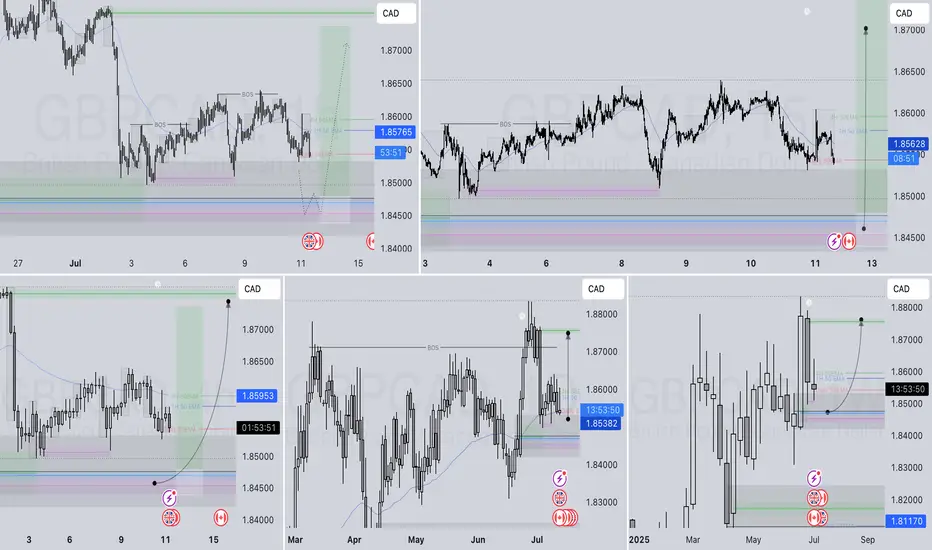
GBPCAD LONG FORECAST Q3 D11 W28 Y25GBPCAD LONG FORECAST Q3 D11 W28 Y25
It’s Fun Coupon Friday! 💸🔥
Professional Risk Managers👋
Welcome back to another FRGNT chart update📈
Diving into some Forex setups using predominantly higher time frame order blocks alongside confirmation breaks of structure.
Let’s see what price action is telling us today! 👀
💡Here are some trade confluences📝
✅Daily Order block identified
✅4H Order Block identified
✅1H Order Block identified
🔑 Remember, to participate in trading comes always with a degree of risk, therefore as professional risk managers it remains vital that we stick to our risk management plan as well as our trading strategies.
📈The rest, we leave to the balance of probabilities.
💡Fail to plan. Plan to fail.
🏆It has always been that simple.
❤️Good luck with your trading journey, I shall see you at the very top.
🎯Trade consistent, FRGNT X
The GBPCAD is Unstoppable due to Strong Up TrendHello Traders
In This Chart GBPCAD HOURLY Forex Forecast By FOREX PLANET
today GBPCAD analysis 👆
🟢This Chart includes_ (GBPCAD market update)
🟢What is The Next Opportunity on GBPCAD Market
🟢how to Enter to the Valid Entry With Assurance Profit
This CHART is For Trader's that Want to Improve Their Technical Analysis Skills and Their Trading By Understanding How To Analyze The Market Using Multiple Timeframes and Understanding The Bigger Picture on the Chart

GBPCAD bearish for expect
OANDA:GBPCAD last 4 ideas on this pair attached, we are have one strong fall, price is make few pushes on sup zone (violet doted), which taking for legal zone, currently price in ASCENDING TRIANGL better visible on 15TF (will make in note), expecting break of same and higher bearish continuation.
SUP zone: 1.85750
RES zone: 1.84500

The GBPCAD is Unstoppable due to Strong Up TrendHello Traders
In This Chart GBPCAD HOURLY Forex Forecast By FOREX PLANET
today GBPCAD analysis 👆
🟢This Chart includes_ (GBPCAD market update)
🟢What is The Next Opportunity on GBPCAD Market
🟢how to Enter to the Valid Entry With Assurance Profit
This CHART is For Trader's that Want to Improve Their Technical Analysis Skills and Their Trading By Understanding How To Analyze The Market Using Multiple Timeframes and Understanding The Bigger Picture on the Chart

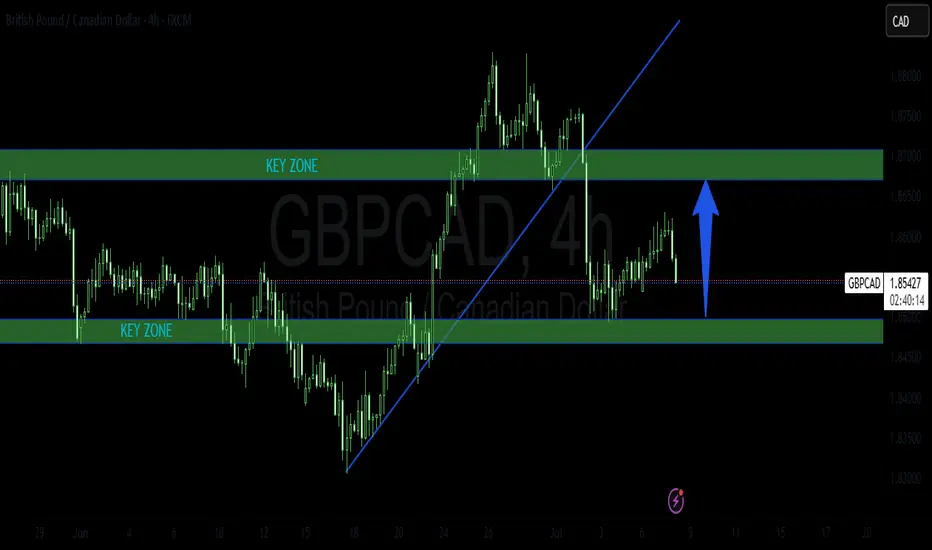
GBPCAD breakout zone retest The GBPCAD currency pair price action sentiment appears Bullish, supported by the current rising trend. The recent intraday price action seems to be a sideways consolidation breakout.
The key trading level is at the 1.8500 level, the previous consolidation price range. A corrective pullback from the current levels and a bullish bounce back from the 1.8500 level could target the upside resistance at 1.8890, followed by the 1.9000 and 1.9090 levels over the longer timeframe.
Alternatively, a confirmed loss of the 1.8500 support and a daily close below that level would negate the bullish outlook, opening the way for a further retracement and a retest of 1.8430 support level, followed by 1.83450 levels.
Conclusion:
As long as 1.8500 holds, the bias remains bullish, favouring continuation toward the 1.8900 zone. A confirmed break below this support would shift momentum, opening the door for a broader corrective decline.
This communication is for informational purposes only and should not be viewed as any form of recommendation as to a particular course of action or as investment advice. It is not intended as an offer or solicitation for the purchase or sale of any financial instrument or as an official confirmation of any transaction. Opinions, estimates and assumptions expressed herein are made as of the date of this communication and are subject to change without notice. This communication has been prepared based upon information, including market prices, data and other information, believed to be reliable; however, Trade Nation does not warrant its completeness or accuracy. All market prices and market data contained in or attached to this communication are indicative and subject to change without notice.

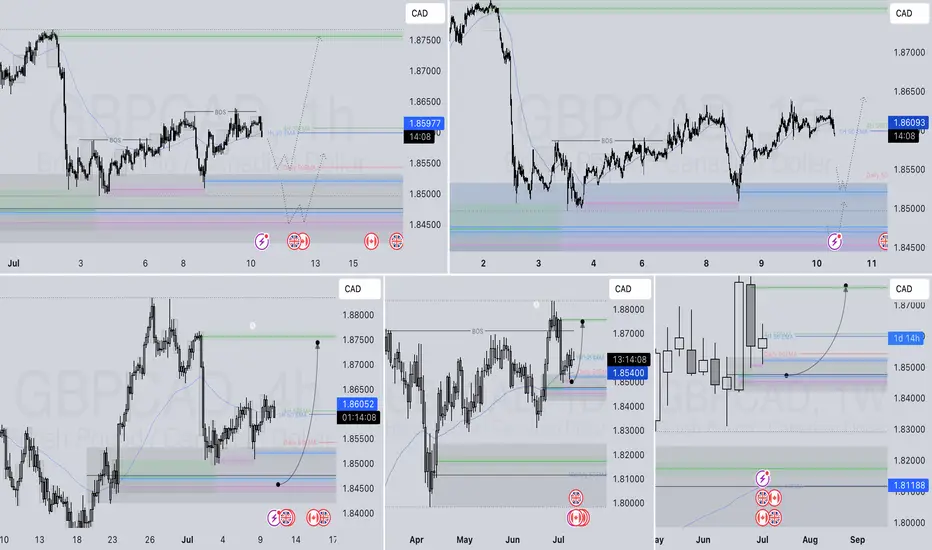
GBPCAD LONG FORECAST Q3 D10 W28 Y25GBPCAD LONG FORECAST Q3 D10 W28 Y25
Professional Risk Managers👋
Welcome back to another FRGNT chart update📈
Diving into some Forex setups using predominantly higher time frame order blocks alongside confirmation breaks of structure.
Let’s see what price action is telling us today! 👀
💡Here are some trade confluences📝
✅Daily Order block identified
✅4H Order Block identified
✅1H Order Block identified
🔑 Remember, to participate in trading comes always with a degree of risk, therefore as professional risk managers it remains vital that we stick to our risk management plan as well as our trading strategies.
📈The rest, we leave to the balance of probabilities.
💡Fail to plan. Plan to fail.
🏆It has always been that simple.
❤️Good luck with your trading journey, I shall see you at the very top.
🎯Trade consistent, FRGNT X
GBPCAD - Looking To Sell Pullbacks In The Short TermH1 - Strong bearish move.
No opposite signs.
Expecting further continuation lower until the two Fibonacci resistance zones hold.
If you enjoy this idea, don’t forget to LIKE 👍, FOLLOW ✅, SHARE 🙌, and COMMENT ✍! Drop your thoughts and charts below to keep the discussion going. Your support helps keep this content free and reach more people! 🚀
--------------------------------------------------------------------------------------------------------------------

GBPCAD TECHNICAL & ORDER FLOW ANALYSISOur analysis is based on a multi-timeframe top-down approach and fundamental analysis.
Based on our assessment, the price is expected to return to the monthly level.
DISCLAIMER: This analysis may change at any time without notice and is solely intended to assist traders in making independent investment decisions. Please note that this is a prediction, and I have no obligation to act on it, nor should you.
Please support our analysis with a boost or comment!

X1: GBPCAD Long Trade OANDA:GBPCAD Long trade, with my back testing of this strategy, it hits multiple possible take profits, manage your position accordingly.
This is good trade, don't overload your risk like greedy, be disciplined trader, this is good trade.
Use proper risk management
Looks like good trade.
Lets monitor.
Use proper risk management.
Disclaimer: only idea, not advice

GBPCAD LONG FORECAST Q3 D8 W28 Y25GBPCAD LONG FORECAST Q3 D8 W28 Y25
Professional Risk Managers👋
Welcome back to another FRGNT chart update📈
Diving into some Forex setups using predominantly higher time frame order blocks alongside confirmation breaks of structure.
Let’s see what price action is telling us today! 👀
💡Here are some trade confluences📝
✅Daily Order block identified
✅4H Order Block identified
✅1H Order Block identified
🔑 Remember, to participate in trading comes always with a degree of risk, therefore as professional risk managers it remains vital that we stick to our risk management plan as well as our trading strategies.
📈The rest, we leave to the balance of probabilities.
💡Fail to plan. Plan to fail.
🏆It has always been that simple.
❤️Good luck with your trading journey, I shall see you at the very top.
🎯Trade consistent, FRGNT X

GBPCAD: Bullish Continuation is Highly Probable! Here is Why:
Remember that we can not, and should not impose our will on the market but rather listen to its whims and make profit by following it. And thus shall be done today on the GBPCAD pair which is likely to be pushed up by the bulls so we will buy!
Disclosure: I am part of Trade Nation's Influencer program and receive a monthly fee for using their TradingView charts in my analysis.
❤️ Please, support our work with like & comment! ❤️

GBPCAD - BEARISH MOVE !Hello Traders !
On the 1h time frame,
The GBPCAD price broke the higher low (change of character).
So, I expect a bearish move📉
______________
TARGET: 1.84580🎯

GBPCAD LONG TRADE PLANThe pair recently broke below the key area and bullish trend line on intraday signal a bearish move. This move nicely respected a strong key zone below and started a correction move. I believe this correction should continue up to the retest of the last key zone.
Please do your own analysis before placing any trades.
Cheers and Happy Trading !!!!
GBPCAD: Bullish Continuation Ahead?! 🇬🇧🇨🇦
One of the pairs that we discussed on the today's live stream
is GBPCAD.
The price nicely respected a key daily/intraday horizontal support.
A double bottom pattern on that and a bullish violation of its neckline
provide strong bullish confirmations.
I expect up move to 1.8666
❤️Please, support my work with like, thank you!❤️
I am part of Trade Nation's Influencer program and receive a monthly fee for using their TradingView charts in my analysis.

GBPCAD Will Grow! Long!
Please, check our technical outlook for GBPCAD.
Time Frame: 2h
Current Trend: Bullish
Sentiment: Oversold (based on 7-period RSI)
Forecast: Bullish
The market is approaching a key horizontal level 1.857.
Considering the today's price action, probabilities will be high to see a movement to 1.865.
P.S
Overbought describes a period of time where there has been a significant and consistent upward move in price over a period of time without much pullback.
Disclosure: I am part of Trade Nation's Influencer program and receive a monthly fee for using their TradingView charts in my analysis.
Like and subscribe and comment my ideas if you enjoy them!

GBPCAD: Classic Pullback Trade for TodayThe GBPCAD pair formed a head and shoulders pattern at a crucial daily/intraday horizontal support level.
The recent breach of its neckline indicates a notable strength of buyers, suggesting a bullish momentum.
Given this technical setup, I anticipate that the pair could rally and potentially reach the 1.8650 level in the near term.

GBPCAD LONG FORECAST Q3 W28 Y25GBPCAD LONG FORECAST Q3 W28 Y25
Professional Risk Managers👋
Welcome back to another FRGNT chart update📈
Diving into some Forex setups using predominantly higher time frame order blocks alongside confirmation breaks of structure.
Let’s see what price action is telling us today! 👀
💡Here are some trade confluences📝
✅Daily Order block identified
✅4H Order Block identified
✅1H Order Block identified
🔑 Remember, to participate in trading comes always with a degree of risk, therefore as professional risk managers it remains vital that we stick to our risk management plan as well as our trading strategies.
📈The rest, we leave to the balance of probabilities.
💡Fail to plan. Plan to fail.
🏆It has always been that simple.
❤️Good luck with your trading journey, I shall see you at the very top.
🎯Trade consistent, FRGNT X

GBP/CAD SELLERS WILL DOMINATE THE MARKET|SHORT
GBP/CAD SIGNAL
Trade Direction: short
Entry Level: 1.872
Target Level: 1.866
Stop Loss: 1.876
RISK PROFILE
Risk level: medium
Suggested risk: 1%
Timeframe: 1h
Disclosure: I am part of Trade Nation's Influencer program and receive a monthly fee for using their TradingView charts in my analysis.
✅LIKE AND COMMENT MY IDEAS✅

GBPCAD 15MCurrency pairs market will be opened in less than few hours, looking forward for gbpcad to respect the trend as we are looking forward for a "Buy".
@MyNigeria1988-FX 📊📊.

H4 STRUCTURAL LOOK OF GBPCADFrom the H4 market outlook. We’re seeing price reacting around a key level 1.85196. If we’d see price break above 1.85854 and lower trend of the emerging downward channel, we’d be going long

WILL GBPCAD SHORT-TERM BULLISH TREND CONTINUE?A lot of speculations about “whether price is likely to continue bullish or not” has been raised after we saw a sharp decline in price following last week price movement.
Technically, we are still having a good probability of seeing more bullish price action on a short term As price hasn’t broken 1.84198.
