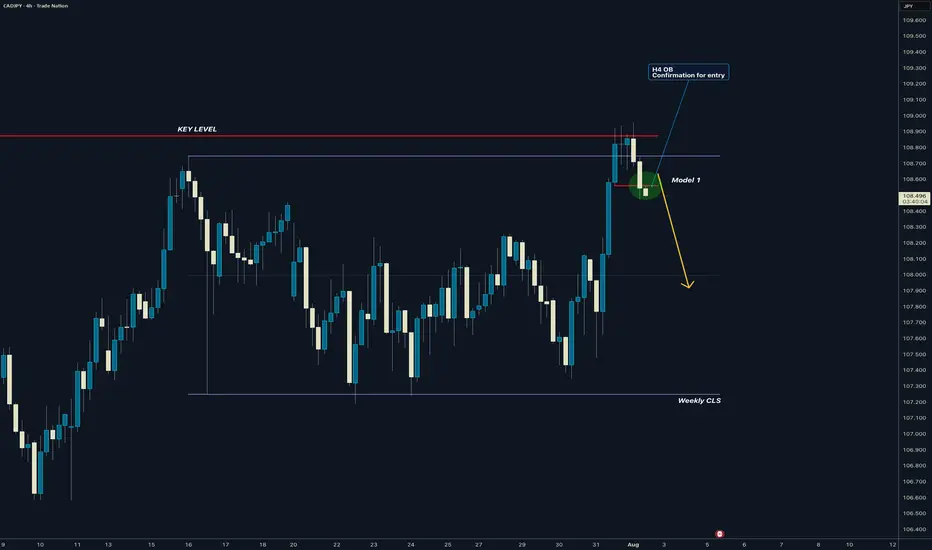
CADJPY I Weekly CLS Range I Model 1 I H4 entry ConfirmedYo Market Warriors ⚔️
Fresh outlook drop — if you’ve been riding with me, you already know:
🎯My system is 100% mechanical. No emotions. No trend lines. No subjective guessing. Just precision, structure, and sniper entries.
🧠 What’s CLS?
It’s the real smart money. The invisible hand behind $7T/day — banks, algos, central players.
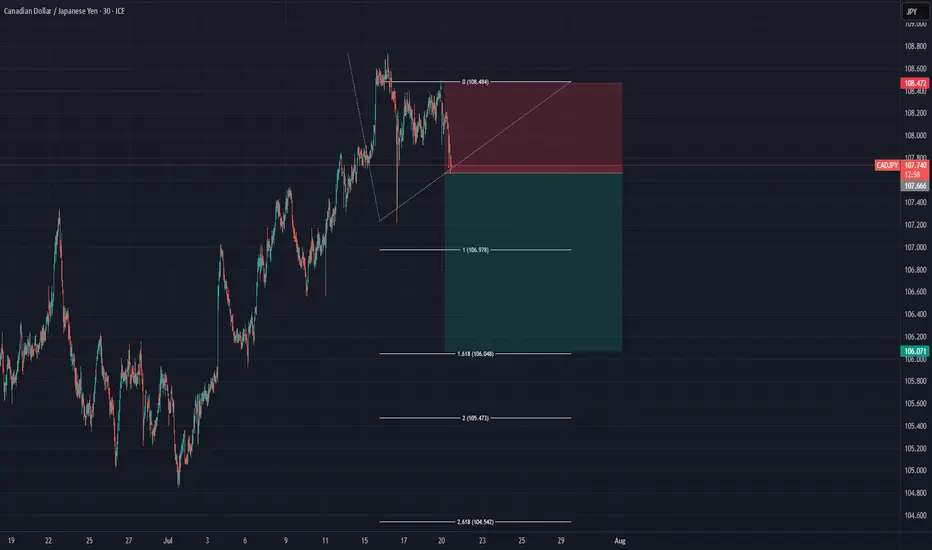
📍Model 1:
HTF bias based on the daily and weekly candles closes,
Wait for CLS candle to be created and manipulated. Switch to correct LTF and spot CIOD. Enter and target 50% of the CLS candle.
For high probability include Dealing Ranges, Weekly Profiles and CLS Timing.
Analysis done on the Tradenation Charts
Disclosure: I am part of Trade Nation's Influencer program and receive a monthly fee for using their TradingView charts in my analysis.
Trading is like a sport. If you consistently practice you can learn it.
“Adapt what is useful. Reject whats useless and add whats is specifically yours.”
David Perk aka Dave FX Hunter
💬 Don't hesitate to ask any questions or share your opinions
CADJPY trade ideas
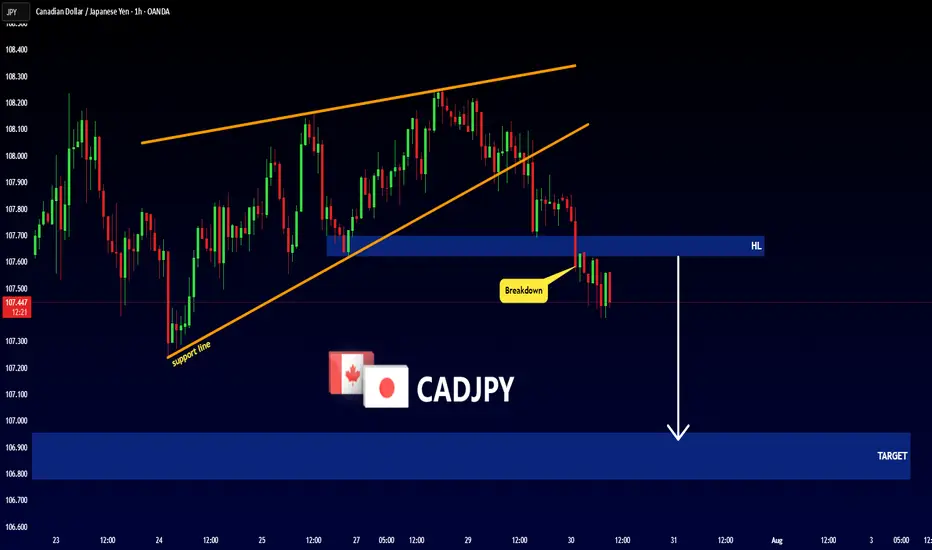
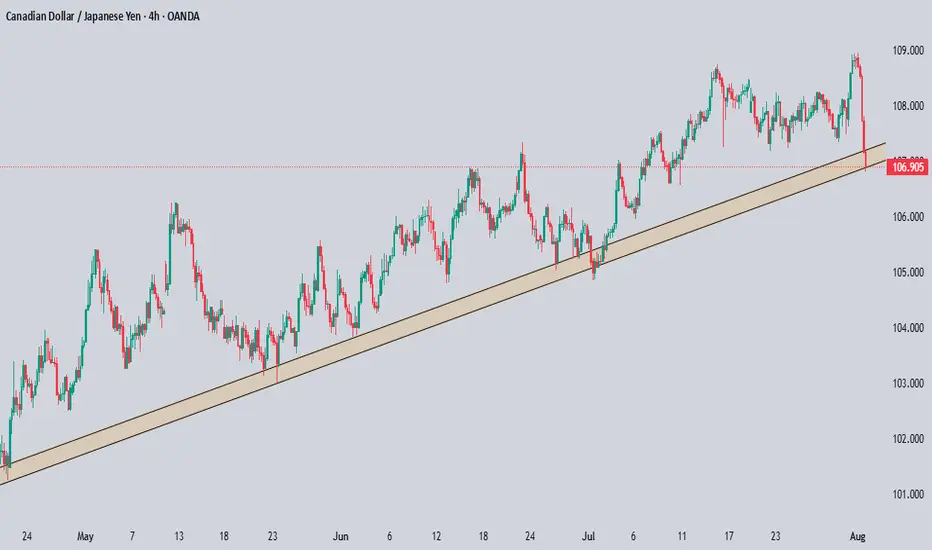
CADJPY - Bearish Rising WedgeHello Traders !
The CADJPY price formed a rising wedge pattern.
Currently, The support line is broken!
So, I expect a bearish move📉
_______________
TARGET: 106.955🎯
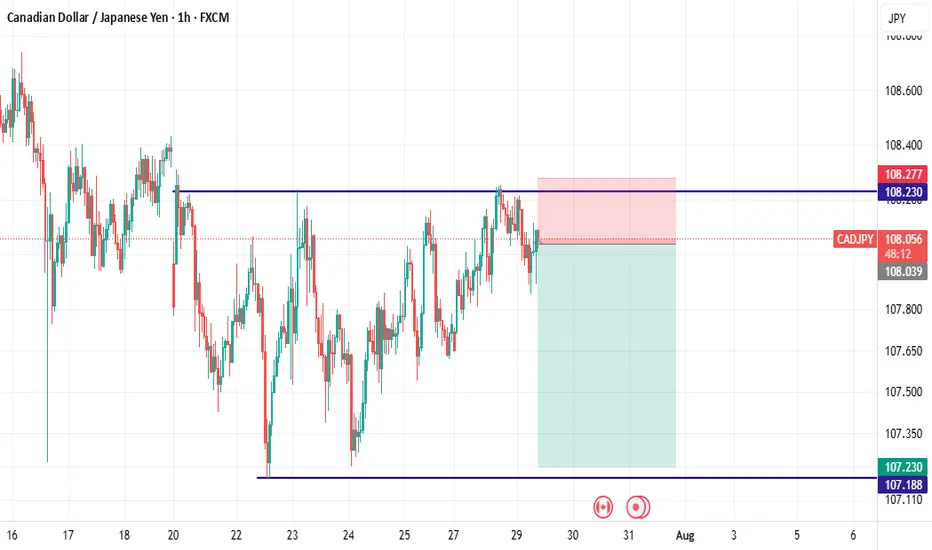
Cadjpy sellCad jpy looks rdy for a pullback, I will sell at 108.810 and take profits at 108.432 happy trading be good humans. 🙏

sell cadjpywe reach a resistance and then have rejection by candles and after the momentum shift is bearish by strong red candles,i enter...
CADJPY: Consolidation Trading 🇨🇦🇯🇵
I expect a retracement from a resistance of a consolidation
range on CADJPY.
My confirmation is a double top pattern formation on that
on a 4H time frame.
Goal - 107.79
❤️Please, support my work with like, thank you!❤️

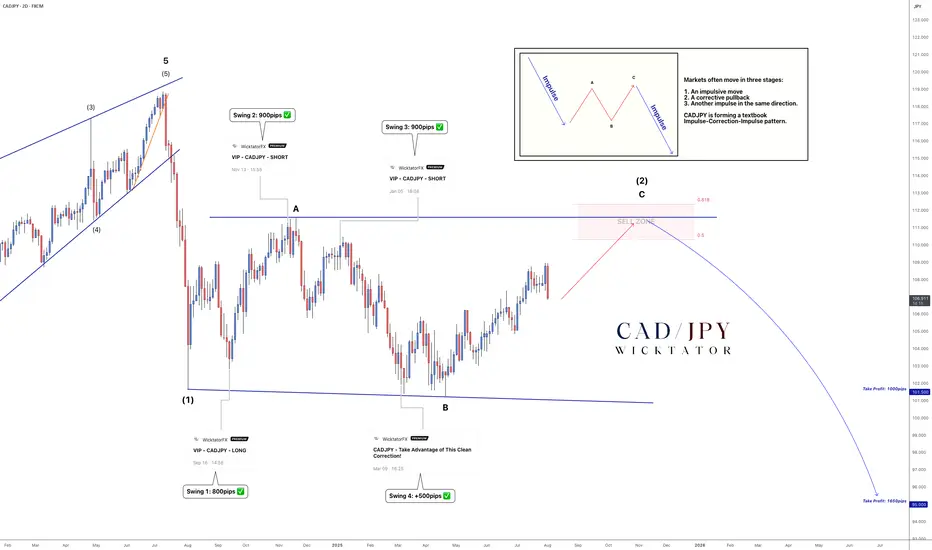
CADJPY - Wave C Near Completion: Big Drop Coming!We’ve been tracking CADJPY for years, and price has followed Elliott Wave structure almost perfectly.
In mid‑2024, an ending diagonal signalled the top and kicked off a major bearish impulse. That drop formed wave A of the current ABC correction. Wave B completed in late 2024, and price is now in wave C -pushing toward the 50–61.8 % Fibonacci retracement, which marks our sell zone.
We’ll be watching for a trendline to form into this zone. A clean break of that trendline will be our trigger to enter shorts.
Trade Idea:
- Watch for rejection in the 50–61.8 % sell zone
- Aggressive entry: Inside sell zone with stops above rejection
- Conservative entry: On break of trendline, stops above the break candle
Targets:
TP1: 101.5 (1000pips)
TP2: 95 ( 1650pips)
Optional: Leave a runner for a long-term swing
See below for our previous CADJPY setups:
Swing 1:
Swing 2:
Swing 3:
Swing 4:
Goodluck and as always, trade safe!
CADJPY - Downside to continueSellers has taken control with a massive push down, wait for bearish continuation to form to confirm another sell opportunity.
Good Luck

CADJPY Technical & Order Flow AnalysisOur analysis is based on a multi-timeframe top-down approach and fundamental analysis.
Based on our assessment, the price is expected to return to the monthly level.
DISCLAIMER: This analysis may change at any time without notice and is solely intended to assist traders in making independent investment decisions. Please note that this is a prediction, and I have no obligation to act on it, nor should you.
Please support our analysis with a boost or comment!
CADJPY - The Bulls Are Stronger than Ever!Hello TradingView Family / Fellow Traders. This is Richard, also known as theSignalyst.
📈CADJPY has been overall bullish trading within the rising wedge pattern marked in red.
This week, CADJPY has been retesting the lower bound of the wedge.
Moreover, the green zone is a strong weekly support.
🏹 Thus, the highlighted blue circle is a strong area to look for buy setups as it is the intersection of the lower red trendline and green support.
📚 As per my trading style:
As #CADJPY approaches the blue circle zone, I will be looking for trend-following bullish reversal setups (like a double bottom pattern, trendline break , and so on...)
📚 Always follow your trading plan regarding entry, risk management, and trade management.
Good luck!
All Strategies Are Good; If Managed Properly!
~Rich
Disclosure: I am part of Trade Nation's Influencer program and receive a monthly fee for using their TradingView charts in my analysis.

CADJPY Will Keep Growing!
HI,Traders !
#CADJPY keep growing and
The pair made a bullish breakout
Of the key horizontal level
Of 108.198 and the pair is
Already retesting the new
Support and we will be
Expecting a further
Bullish move uP !
Comment and subscribe to help us grow !

CAD/JPY BEARS WILL DOMINATE THE MARKET|SHORT
Hello, Friends!
CAD-JPY uptrend evident from the last 1W green candle makes short trades more risky, but the current set-up targeting 106.478 area still presents a good opportunity for us to sell the pair because the resistance line is nearby and the BB upper band is close which indicates the overbought state of the CAD/JPY pair.
Disclosure: I am part of Trade Nation's Influencer program and receive a monthly fee for using their TradingView charts in my analysis.
✅LIKE AND COMMENT MY IDEAS✅

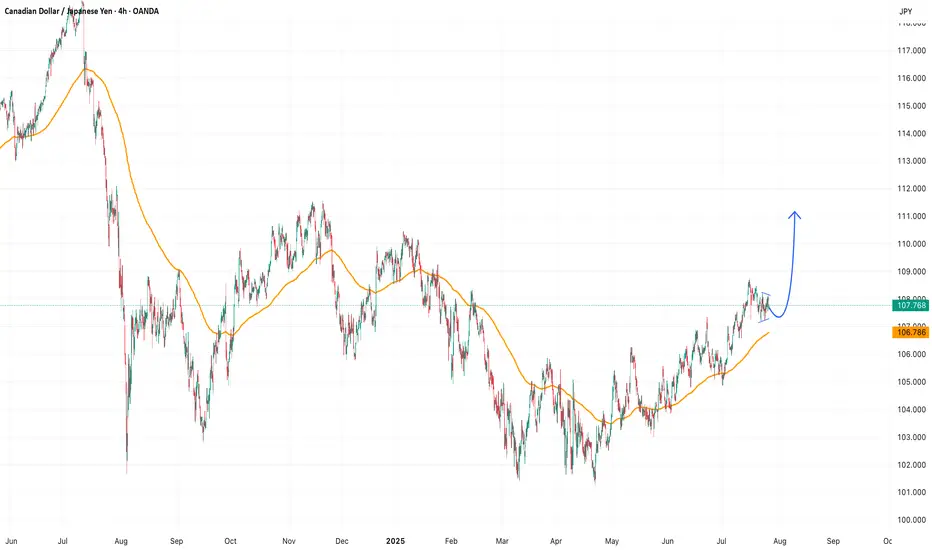
CADJPY Analysis: Uptrend Remains Intact – Look to BuyThe CADJPY pair continues to maintain its strong upward trend on the higher timeframes. Recent pullbacks appear to be temporary corrections and have not broken the overall bullish structure. Therefore, the most appropriate strategy at this stage is to wait for buying opportunities and look for confirmation before entering long positions.
Patience is key — waiting for clear price action signals or technical confirmations can greatly improve your trade success rate.
Suggested Strategy:
Monitor the H1 or H4 timeframe for bullish reversal patterns.
Look to buy when price retests key support zones and shows confirmation (e.g., pin bar, bullish engulfing, breakout).
Stick to your trading plan and follow the trend — the bulls are still in control!
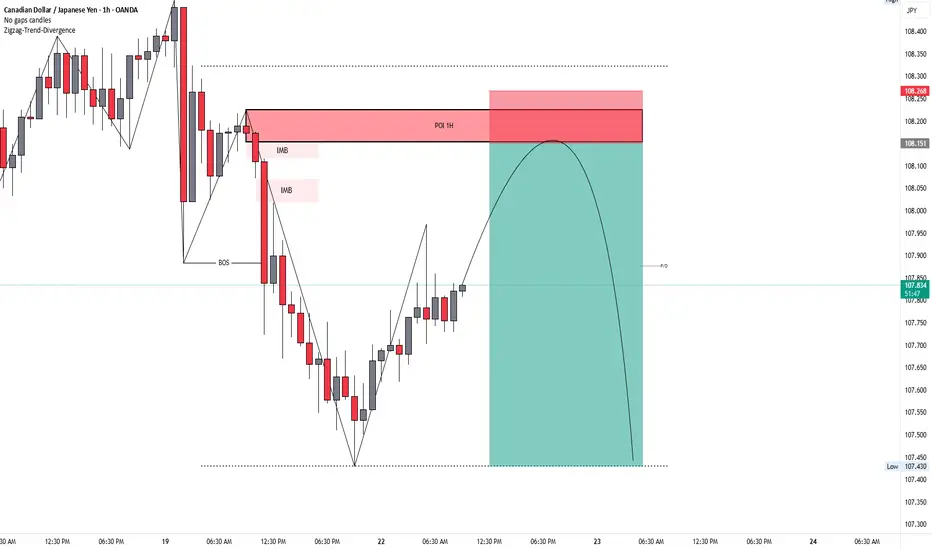
CADJPY (SMC SELL SETUP)TRADE SETUP DESCRIPTION (SMC SELL SETUP):
PAIR: CADJPY
TIMEFRAME: 1H Chart (Entry Confirmation on 15M or 5M)
SETUP LOGIC (SMC STRATEGY):
BOS (Break of Structure) confirm ho chuka hai — bearish trend active hai.
Price is retracing towards:
POI 1H (Supply Zone)
IMB (Imbalance)
Previous supply zone rejection area
Price ka expectation:
Price POI 1H zone tak jaayega.
Wahaan liquidity fill aur IMB fill ke baad bearish reaction expect karna hai.
ENTRY PLAN:
✅ After Price Enters POI 1H Supply Zone:
15 Min ya 5 Min Chart pe CHoCH (Change of Character) ka wait karo.
CHoCH milne ke baad SELL entry lena.
Stoploss POI zone ke upar lagana (above 108.268).
Target: Lower liquidity zone (marked around 107.430).
RISK-REWARD:
🎯 Risk:Reward ratio approximately 1:3 ka ban raha hai.
CADJPY FORECAST I'm looking into the CADJPY ,The way it looks like from the higher timeframe it is very interesting. Looking into the zones that I've highlighted to see if price is going to give me a potential. let's see how price is going to play out

CADJPY TRADE RECAPLooking Into This Trade That I shared To You Yesterday. I Just Want To Explain The Reason Behind This Trade And I Hope It Is Going To Add Something In Your Trading

CADJPY Possible Down trend CADJPY has brokend the support the price may likely to go down and touch the support of 106.
short cadjpysell cadjpy and target fib 100% as tp 1. i believe it will continue it bearishness for some days
CAD-JPY Local Long! Buy!
Hello,Traders!
CAD-JPY made a retest
Of the horizontal support
Level of 107.400 and we
Are already seeing a bullish
Rebound and we will be
Expecting a further local
Bullish move up
Buy!
Comment and subscribe to help us grow!
Check out other forecasts below too!
Disclosure: I am part of Trade Nation's Influencer program and receive a monthly fee for using their TradingView charts in my analysis.

CADJPY daily 20EMA bounceSimple idea here, CADJPY is testing the daily 20EMA (overlayed on this 4H chart) and recently broke above the monthly 20EMA (overlayed)... if price reclaims the daily 10EMA (overlayer) could be a nice move up.
Very simple trade, tight SL if entering.

CITYSTAR | CADJPY ANALYSISCADJPY New Forecast👨💻👨💻
This is my personal trade and not in anyway a mandatory setup.
Note:
Follow proper risk management rules. Never risk more then 2% of your total capital. Money management is the key of success in this business...... Set your own SL & TP.
Please support this idea with a Like and COMMENT if you find it useful click "follow" on our profile if you will like these type of trading ideas delivered straight to your email in the future.
Thanks for your continued support!! lemme know your thoughts in the comment sec..

CADJPY Will Go Down!
HI,Traders !
CAD-JPY made a bearish
Breakout of the rising support
And is now consolidating
Below the line so we are
Bearish biased and we will
Be expecting a further
Bearish continuation !
Comment and subscribe to help us grow !

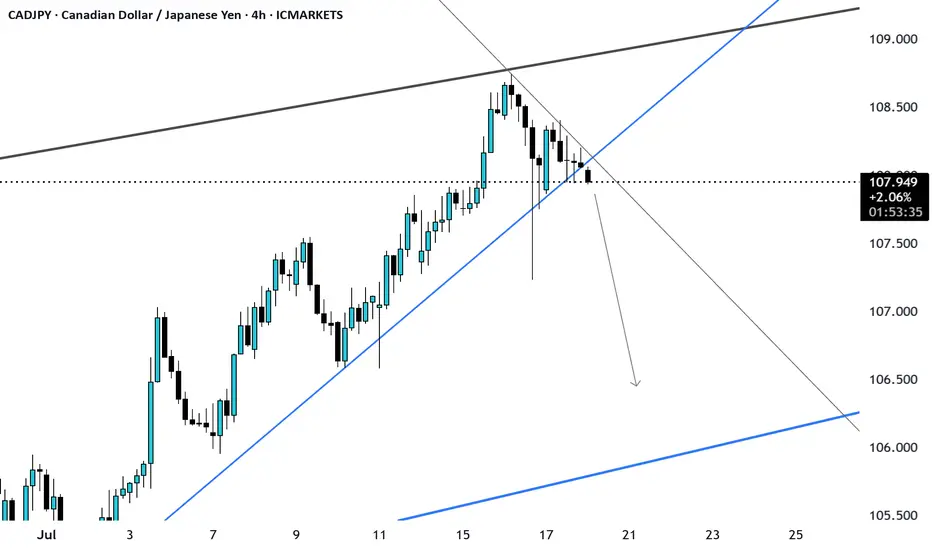
CADJPY Bearish Breakout!
HI,Traders !
#CADJPY made a bearish
Breakout of the key horizontal
Level around 107.376 and the
Breakout is confirmed After retesting the key
level which has now become resistance we
Will be expecting a further
Bearish move down !
Comment and subscribe to help us grow !

CADJPY still bearish to expect
OANDA:CADJPY strong bearish fall in week behind us, for next week still having bearish expectations.
SUP zone: 108.000
RES zone: 105.900, 105.500
