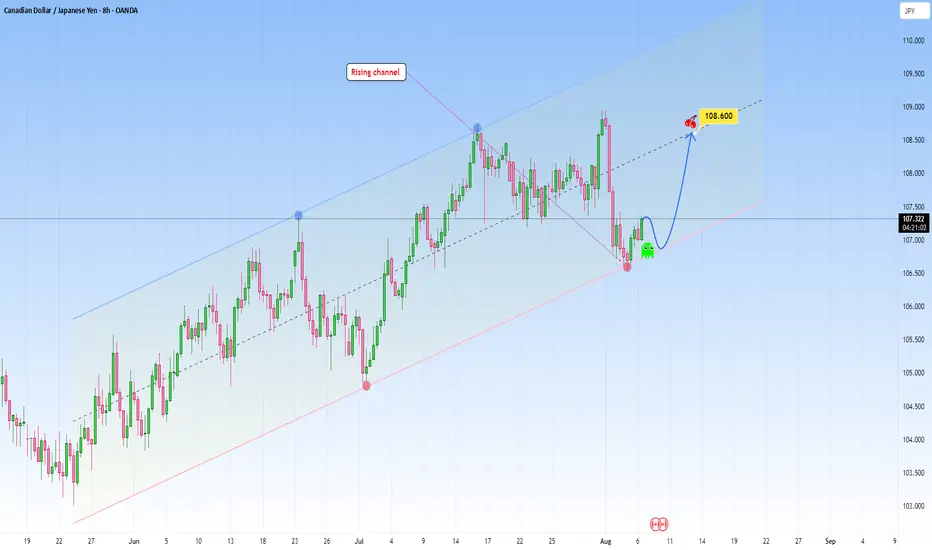
CADJPY: Moving in a clear rising channelCADJPY is currently respecting a well-defined rising channel structure, with price reacting cleanly to both the upper and lower bounds of the channel.
After a sharp correction, price has once again tapped the lower trendline support, a level that has triggered bullish reversals, and is now showing early bullish signs.
This bounce suggests the market is preparing for another leg up, with 108.600 marked as a key target near the midline of the channel, which often acts as dynamic resistance in trending conditions.
CADJPY trade ideas
07.08.25.25 Morning ForecastPairs on Watch -
FX:CADJPY (Live position)
FX:EURNZD
FX:EURCAD
A short overview of the instruments I am looking at for today, multi-timeframe analysis down to what I will be looking at for an entry. Enjoy!

CADJPY: Bullish Continuation is Expected! Here is Why:
Balance of buyers and sellers on the CADJPY pair, that is best felt when all the timeframes are analyzed properly is shifting in favor of the buyers, therefore is it only natural that we go long on the pair.
Disclosure: I am part of Trade Nation's Influencer program and receive a monthly fee for using their TradingView charts in my analysis.
❤️ Please, support our work with like & comment! ❤️

CAD_JPY STRONG UPTREND|LONG|
✅CAD_JPY is trading in an uptrend
Along the rising support line
Which makes me bullish biased
And the pair is already making
A bullish rebound from the support
So a further move up is expected
With the target of retesting the
Level above at 107.705
LONG🚀
✅Like and subscribe to never miss a new idea!✅

CADJPY: Bullish Move Confirmed?! 🇨🇦🇯🇵
CADJPY is going to bounce from a key daily support.
With a high probability, 107.28 level will be reached soon.
❤️Please, support my work with like, thank you!❤️

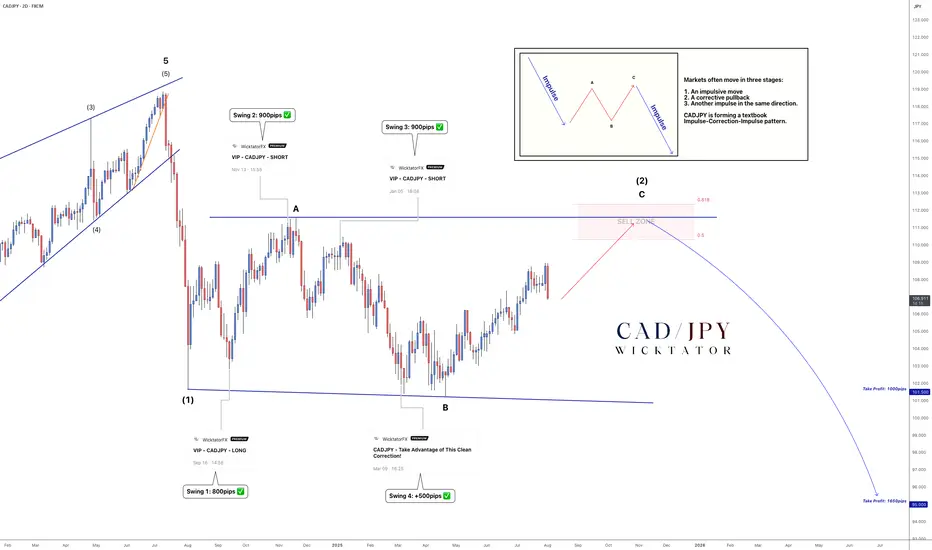
CADJPY - Wave C Near Completion: Big Drop Coming!We’ve been tracking CADJPY for years, and price has followed Elliott Wave structure almost perfectly.
In mid‑2024, an ending diagonal signalled the top and kicked off a major bearish impulse. That drop formed wave A of the current ABC correction. Wave B completed in late 2024, and price is now in wave C -pushing toward the 50–61.8 % Fibonacci retracement, which marks our sell zone.
We’ll be watching for a trendline to form into this zone. A clean break of that trendline will be our trigger to enter shorts.
Trade Idea:
- Watch for rejection in the 50–61.8 % sell zone
- Aggressive entry: Inside sell zone with stops above rejection
- Conservative entry: On break of trendline, stops above the break candle
Targets:
TP1: 101.5 (1000pips)
TP2: 95 ( 1650pips)
Optional: Leave a runner for a long-term swing
See below for our previous CADJPY setups:
Swing 1:
Swing 2:
Swing 3:
Swing 4:
Goodluck and as always, trade safe!
Cadjpy sellCad jpy looks rdy for a pullback, I will sell at 108.810 and take profits at 108.432 happy trading be good humans. 🙏

CADJPY: Bearish Move From Resistance 🇨🇦🇯🇵
There is a high chance that CADJPY will drop
from a key daily resistance cluster.
As a confirmation, I see a triple top pattern
on an hourly time frame and a violation of its neckline.
Goal - 106.9
❤️Please, support my work with like, thank you!❤️
I am part of Trade Nation's Influencer program and receive a monthly fee for using their TradingView charts in my analysis.

CAD/JPY Entry Uncapped – Loonie Robbery in Motion🔐CAD/JPY Heist Activated: Thief Breaks Into the Bullish Vault📈💰💥
📌 Asset: CAD/JPY "Loonie-Yen" Forex Bank
📌 Plan: Bullish
📌 Entry: Any price level
📌 Stop Loss: 106.600
📌 Target: 109.200
📌 Method: Multi-limit orders using Layering / DCA Strategy
👋🏼 Hello Money Movers & Market Robbers!
Welcome back to the battlefield — this time we’re breaching the vault of the CAD/JPY Loonie-Yen Forex Bank with a bullish masterplan. This isn't just a trade, it’s a planned heist using Thief Trader Strategy. Precision entries, layered orders, and sharp exits — that’s how we roll! 🏦💣
🔓 ENTRY — The Vault Is Open!
💸 Swipe the loot at any price — but the real pros place Buy Limits near recent swing lows (15min/30min TF) to catch price pullbacks.
⚠️ Only Long — Short is off-limits unless you’re surrendering your loot.
🛑 STOP LOSS — Lock Before They Catch You!
📍 Place SL at 106.600, or below your last entry layer if you stack orders.
Let your lot size, risk %, and DCA levels guide the SL placement. Safety first, profit always.
🎯 TARGET — The Exit Door: 109.200
📈 That’s where the loot gets stashed! Trail it smart if the price gets hot. Escape early if market mood shifts.
🧠 STRATEGY BREAKDOWN:
☑️ Style: Layered Grid / DCA Method
☑️ Trade Type: Scalping 🔹 Day Trade 🔹 Swing
☑️ Market Condition: Bullish momentum pushing through resistance — fundamental & sentiment align.
📚 MARKET INTEL:
📰 Stay ahead — read the COT reports, scan the macros, dive into quant flows & sentiment indexes.
Want the full picture? Click the 🔗 in proo file for the research vault.
⚠️ Avoid entries during high-volatility news. Set trailing SLs to protect your robbery bag. 🎒
🚨 THIEF TIPS:
🔹 Don’t panic — layer in, scale smart.
🔹 Use M15/H1 TF to plan sniper entries.
🔹 Let profits run, but never let them bleed.
💥 BOOST THIS IDEA if you support the Thief’s mission 💥
Every like powers up the next robbery!
Your support lets me share more free trade ideas with real planning & real money in mind.
🔐 Catch you on the next break-in… Stay funded, stay dangerous. 🤑🚁💼

AUDJPY & CADJPY Trade Recaps 08.08.25A long position on AUDJPY taken Monday for a -1%, the trade had great potential but one of those ones that didn't have enough steam to commit. Followed by a CADJPY short taken yesterday for a +2% manual close.
Full explanation as to why I executed on these positions and the management plan with both.
Any questions you have just drop them below 👇

CADJPY Bullish Breakout!
HI,Traders !
#CADJPY keeps growing and
The pair made a bullish breakout
Of the key horizontal level
Of 107.376 and the breakout
Is confirmed so we are bullish
Biased and we will be
Expecting a further move up !
Comment and subscribe to help us grow !

CADJPY SWING: SHORT OPPORTUNITYHi there,
Just like my short expectation on the GBPJPY analysis I shared, I would like to see CADJPY trade lower.
My reasons are well annotated on the chart. But I'd urge you to look at the 3M chart and see where we are in terms of support and resistance levels.
Anyways, I wish you good trading.
Cheers,
Jabari

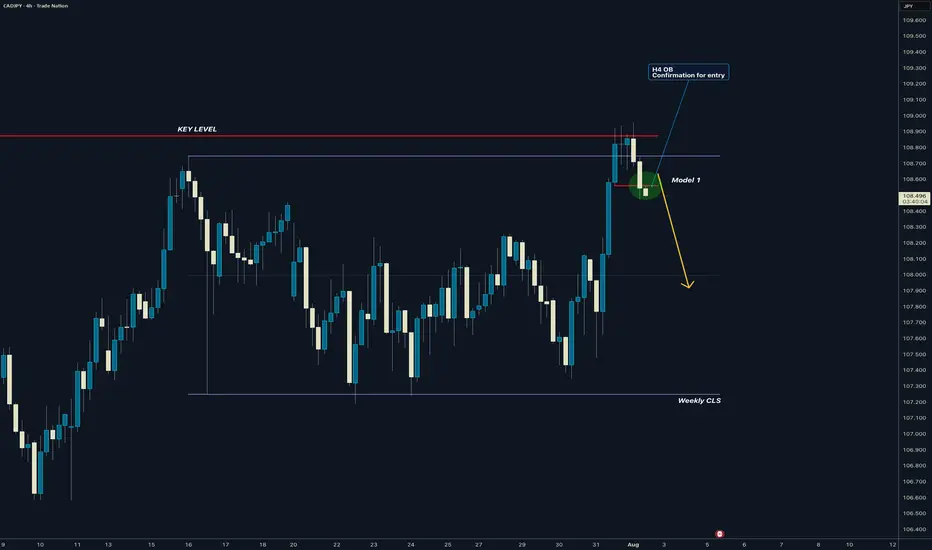
CADJPY I Weekly CLS Range I Model 1 I H4 entry ConfirmedYo Market Warriors ⚔️
Fresh outlook drop — if you’ve been riding with me, you already know:
🎯My system is 100% mechanical. No emotions. No trend lines. No subjective guessing. Just precision, structure, and sniper entries.
🧠 What’s CLS?
It’s the real smart money. The invisible hand behind $7T/day — banks, algos, central players.
📍Model 1:
HTF bias based on the daily and weekly candles closes,
Wait for CLS candle to be created and manipulated. Switch to correct LTF and spot CIOD. Enter and target 50% of the CLS candle.
For high probability include Dealing Ranges, Weekly Profiles and CLS Timing.
Analysis done on the Tradenation Charts
Disclosure: I am part of Trade Nation's Influencer program and receive a monthly fee for using their TradingView charts in my analysis.
Trading is like a sport. If you consistently practice you can learn it.
“Adapt what is useful. Reject whats useless and add whats is specifically yours.”
David Perk aka Dave FX Hunter
💬 Don't hesitate to ask any questions or share your opinions
CADJPY Resurrected.Here on these post, i shared a buy setup on FOREXCOM:CADJPY Combining both weekly daily and h4 timeframe to get these setup, For further info, see the video.

CADJPY - Downside to continueSellers has taken control with a massive push down, wait for bearish continuation to form to confirm another sell opportunity.
Good Luck

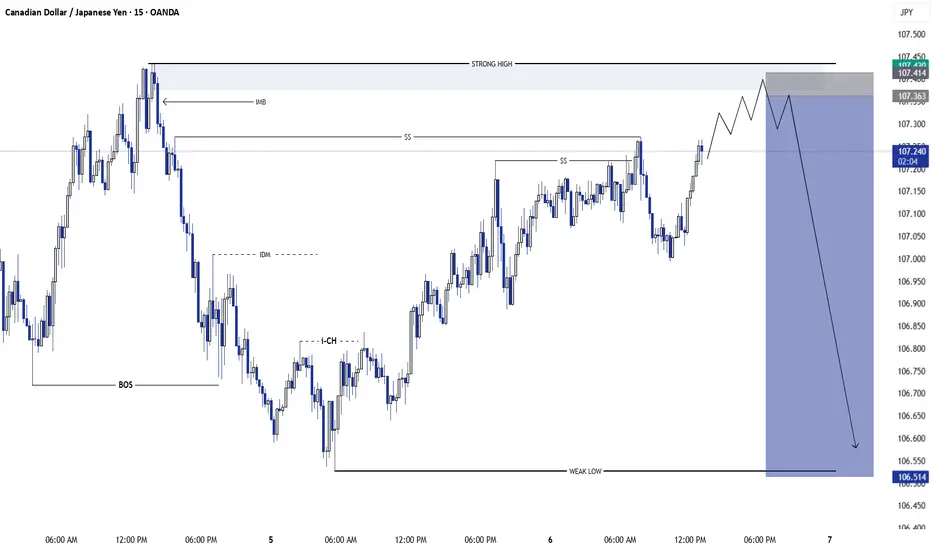
CADJPY SMC Trade (Higher Timeframe: 1H | 15M/5M Entry🔷 1H Structure Overview:
The market is in a bearish structure on the 1-Hour timeframe.
Price is approaching a strong supply zone marked near the previous strong high.
There’s an imbalance (IMB) visible—indicating potential reversal.
🔸 15-Minute POI (Point of Interest):
On the 15-minute chart, price is slowly rising toward the POI.
The POI lies within the 1H supply zone, aligned with Smart Money Concepts (SMC).
This is a high-probability sell setup.
✅ Entry Plan:
Wait for price to tap into the 15M POI (supply zone).
Observe for a CHoCH (Change of Character) or Break of Structure (BOS).
Once confirmed, enter a Sell trade.
Keep your Stop Loss (SL) just above the supply zone.
Set Take Profit (TP) at the previous Weak Low.
🎯 Risk to Reward (RR):
Targeting a 1:10 Risk to Reward trade.
Very attractive due to HTF confluence, liquidity sweep, and supply rejection.
🧠 SMC Logic Used:
HTF Supply + IMB
CHoCH Confirmation
Liquidity Grab Above Strong High
Entry on 15M with Precision
Targeting Weak Low for Continuation
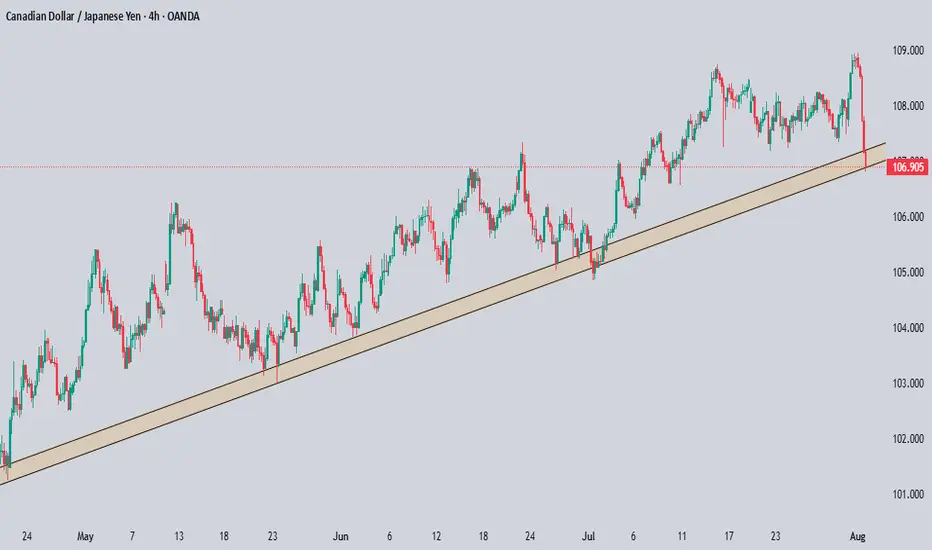
CADJPY Technical & Order Flow AnalysisOur analysis is based on a multi-timeframe top-down approach and fundamental analysis.
Based on our assessment, the price is expected to return to the monthly level.
DISCLAIMER: This analysis may change at any time without notice and is solely intended to assist traders in making independent investment decisions. Please note that this is a prediction, and I have no obligation to act on it, nor should you.
Please support our analysis with a boost or comment!

CADJPY Is Bearish! Sell!
Take a look at our analysis for CADJPY.
Time Frame: 2h
Current Trend: Bearish
Sentiment: Overbought (based on 7-period RSI)
Forecast: Bearish
The market is approaching a key horizontal level 107.345.
Considering the today's price action, probabilities will be high to see a movement to 106.396.
P.S
We determine oversold/overbought condition with RSI indicator.
When it drops below 30 - the market is considered to be oversold.
When it bounces above 70 - the market is considered to be overbought.
Disclosure: I am part of Trade Nation's Influencer program and receive a monthly fee for using their TradingView charts in my analysis.
Like and subscribe and comment my ideas if you enjoy them!

CAD/JPY BULLS ARE STRONG HERE|LONG
Hello, Friends!
We are now examining the CAD/JPY pair and we can see that the pair is going down locally while also being in a downtrend on the 1W TF. But there is also a powerful signal from the BB lower band being nearby indicating that the pair is oversold so we can go long from the support line below and a target at 108.573 level.
Disclosure: I am part of Trade Nation's Influencer program and receive a monthly fee for using their TradingView charts in my analysis.
✅LIKE AND COMMENT MY IDEAS✅

CAD_JPY BEARISH BREKAOUT|SHORT|
✅CAD_JPY broke the key structure level of 107.400
While trading in an local downtrend
Which makes me bearish
And I think that after the retest of the broken level is complete
A rebound and bearish continuation will follow
SHORT🔥
✅Like and subscribe to never miss a new idea!✅
Disclosure: I am part of Trade Nation's Influencer program and receive a monthly fee for using their TradingView charts in my analysis.

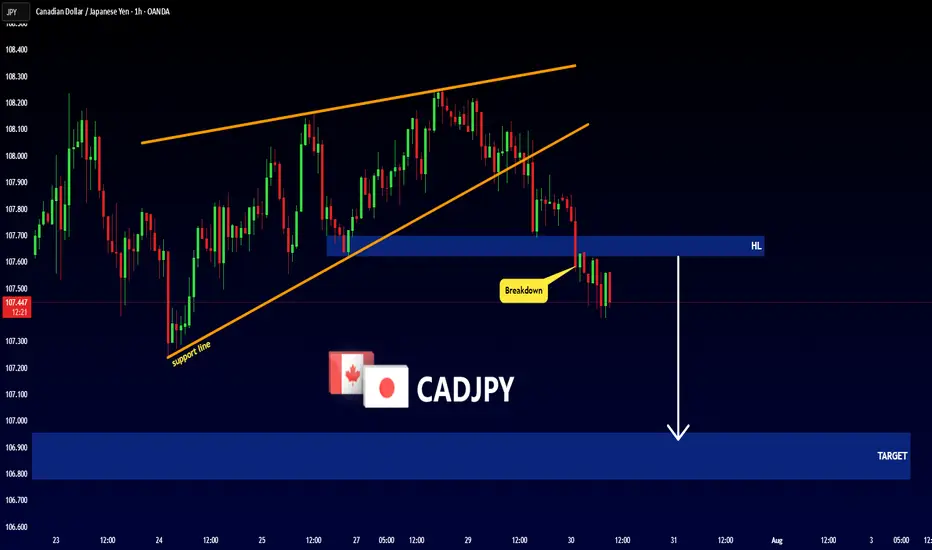
CADJPY - Bearish Rising WedgeHello Traders !
The CADJPY price formed a rising wedge pattern.
Currently, The support line is broken!
So, I expect a bearish move📉
_______________
TARGET: 106.955🎯
CADJPY Technical & Order Flow AnalysisOur analysis is based on a multi-timeframe top-down approach and fundamental analysis.
Based on our assessment, the price is expected to return to the monthly level.
DISCLAIMER: This analysis may change at any time without notice and is solely intended to assist traders in making independent investment decisions. Please note that this is a prediction, and I have no obligation to act on it, nor should you.
Please support our analysis with a boost or comment!
CADJPY: Consolidation Trading 🇨🇦🇯🇵
I expect a retracement from a resistance of a consolidation
range on CADJPY.
My confirmation is a double top pattern formation on that
on a 4H time frame.
Goal - 107.79
❤️Please, support my work with like, thank you!❤️
