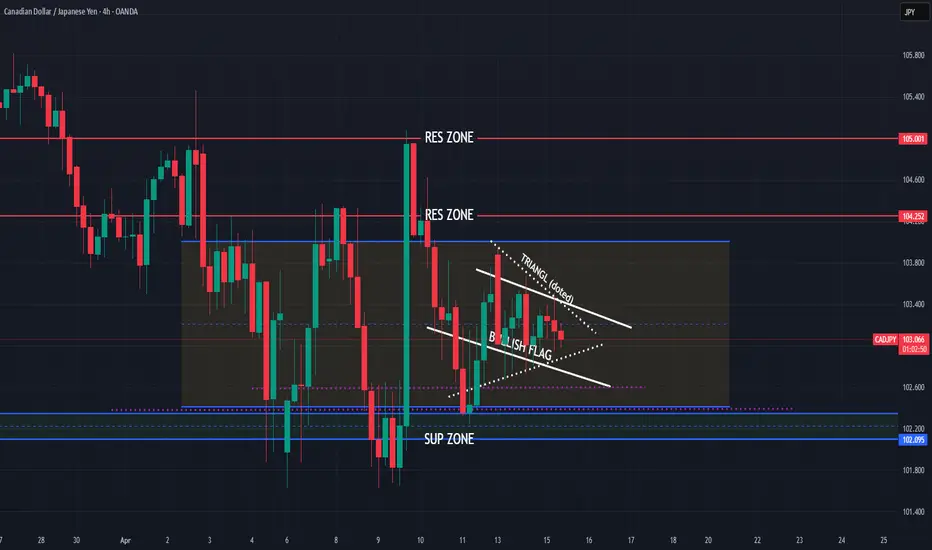
CADJPY structures created, having bullish view
Coming again on OANDA:CADJPY , analysis before this one closed manually, now having batter situation and sharing new view based on price action and patterns.
Few times price is bounce on zone 102.450. Now we have BULLISH FLAG (better visible on 2,1H TF) and we have TRIANGL formation, tomorrow BAC rate cut and some pairs like EUR and GBP versus CAD looks like will go bearish.
View is here bullish for this week.
SUP zone: 102.400
RES zone: 104.250, 105.000
CADJPY trade ideas
CADJPY - Buy with Target at 108This is a pretty good setup when taking everything into consideration. BOC on Wednesday likely to add additional strength to the Loonie from the tariffs. Earnings also adds more fire power towards this pair gaining in value along with Gold, looks like it wants to top off.

CADJPY possible Bullish My analysis for CADJPY expect that price will move down to take liquidity at Point A. Following this liquidity grab, I will be looking for confirmation signals of bullish momentum. If confirmed, the first profit target would be within the Fair Value Gap (FVG) at Point B, second profit target would be the liquidity level at Point C.

CADJPY 13/04/2025Weekly:
-Weekly lows.
-Liquidity sweep.
Daily:
-Inverse H&S pattern.
4H:
-Inverse H&S pattern.
-IC.


CADJPY Sellers In Panic! BUY!
My dear friends,
CADJPY looks like it will make a good move, and here are the details:
The market is trading on 103.54 pivot level.
Bias - Bullish
Technical Indicators: Supper Trend generates a clear long signal while Pivot Point HL is currently determining the overall Bullish trend of the market.
Goal - 104.58
Recommended Stop Loss - 102.96
About Used Indicators:
Pivot points are a great way to identify areas of support and resistance, but they work best when combined with other kinds of technical analysis
Disclosure: I am part of Trade Nation's Influencer program and receive a monthly fee for using their TradingView charts in my analysis.
———————————
WISH YOU ALL LUCK

CADJPY WILL BULLISH OR BEARISH ?? DETAILED ANALYSISCADJPY is currently forming a clear descending wedge pattern on the 12H chart, which historically signals a high-probability bullish reversal. The price has respected both the upper descending trendline and the lower support line with precision over the past few months, but the recent reaction near the wedge support is showing signs of buying interest. With the current price trading at 103.10, we are at a critical juncture where a breakout to the upside could initiate a strong momentum rally toward the 109.00 target.
Technically, this setup is supported by multiple touchpoints on both trendlines, suggesting a mature wedge structure ready to break. The risk-reward ratio is extremely favorable here, with clear invalidation below 100.90 and upside potential aligned with the upper structure of the broader consolidation zone. A confirmed breakout and candle close above the 104.00 resistance area would likely signal the start of a bullish impulse wave targeting 109.00 in the medium term.
On the fundamental side, CAD is supported by firm oil prices, which have remained elevated due to ongoing geopolitical risks and OPEC+ production cuts. Meanwhile, the JPY continues to weaken as the Bank of Japan remains firmly committed to ultra-loose monetary policy, even as inflation expectations globally stay elevated. This divergence in monetary policy between the BoC and BoJ is fueling carry trade flows, further boosting CADJPY's bullish outlook.
Looking ahead, any signs of risk-on sentiment in global markets, combined with resilient Canadian data, could act as a catalyst for the breakout. With the market positioning leaning heavily on JPY shorts and crude oil demand remaining strong, CADJPY is technically and fundamentally poised for a breakout rally. I'm watching the 104.00 zone closely—once cleared, I anticipate a swift move toward 109.00 with momentum on our side.

CADJPY SELL ideawe are currently in bearish trend on this pair, we expect a long term push to the downside,
price created an head and shoulders pattern on the daily timeframe, we expect price to break the neckline and continue downwards

Could the price bounce from here?CAD/JPY is falling towards the pivot which is a pullback support and could bounce to the pullback resistance.
Pivot: 102.61
1st Support: 101.62
1st Resistance: 103.68
Risk Warning:
Trading Forex and CFDs carries a high level of risk to your capital and you should only trade with money you can afford to lose. Trading Forex and CFDs may not be suitable for all investors, so please ensure that you fully understand the risks involved and seek independent advice if necessary.
Disclaimer:
The above opinions given constitute general market commentary, and do not constitute the opinion or advice of IC Markets or any form of personal or investment advice.
Any opinions, news, research, analyses, prices, other information, or links to third-party sites contained on this website are provided on an "as-is" basis, are intended only to be informative, is not an advice nor a recommendation, nor research, or a record of our trading prices, or an offer of, or solicitation for a transaction in any financial instrument and thus should not be treated as such. The information provided does not involve any specific investment objectives, financial situation and needs of any specific person who may receive it. Please be aware, that past performance is not a reliable indicator of future performance and/or results. Past Performance or Forward-looking scenarios based upon the reasonable beliefs of the third-party provider are not a guarantee of future performance. Actual results may differ materially from those anticipated in forward-looking or past performance statements. IC Markets makes no representation or warranty and assumes no liability as to the accuracy or completeness of the information provided, nor any loss arising from any investment based on a recommendation, forecast or any information supplied by any third-party.

CAD/JPY 4hir analysis my IdeaCAD/JPY is expected to go into a full bullish trend, and it's likely to continue upward. However, there is a possibility it may dip once more and form a new lower low (LL) before resuming the uptrend. Overall, the market remains bullish as long as it targets the range between 111.50 and 114.85.

CAD/JPY BEARS ARE STRONG HERE|SHORT
CAD/JPY SIGNAL
Trade Direction: short
Entry Level: 103.925
Target Level: 100.915
Stop Loss: 105.911
RISK PROFILE
Risk level: medium
Suggested risk: 1%
Timeframe: 1D
Disclosure: I am part of Trade Nation's Influencer program and receive a monthly fee for using their TradingView charts in my analysis.
✅LIKE AND COMMENT MY IDEAS✅

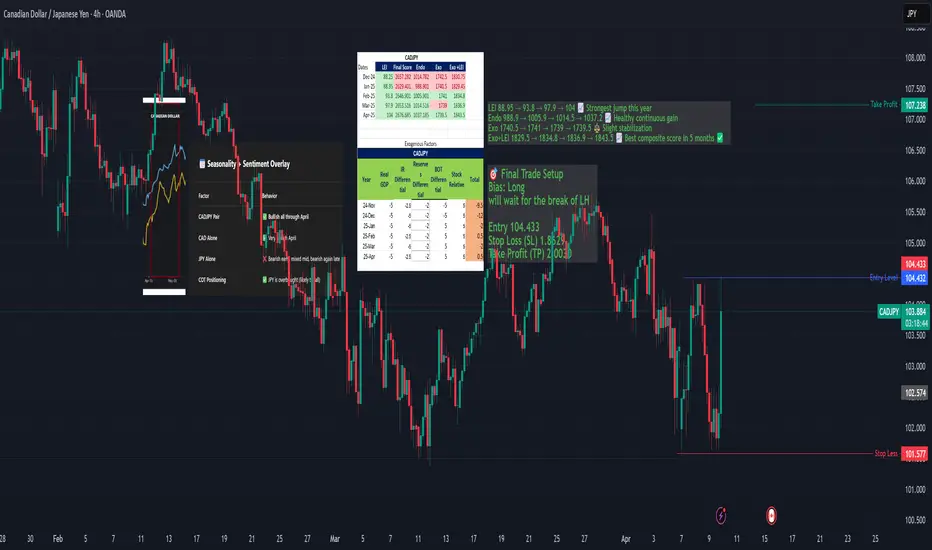
CADJPY: Bullish Setup Building — Fundamental AnalysisCADJPY is approaching a major support zone with a strong macro and seasonal backdrop favoring a bullish reversal.
Macro scores (LEI, endogenous) show consistent strength
Seasonality supports upside from late April into May
JPY is overbought per COT data
🔁 However, price structure remains bearish on 4H and Daily, so we are waiting for a confirmed CHoCH and HL before executing a swing long.
This idea is a "watch & prepare" setup — get ready to strike once structure flips.
Potential Buy Opportunity on CADJPYReasons I think this pair will rise:
- RSI was oversold on Daily and 4H Chart.
- Price gave us a double bottom which is a sign of trend weakness
- Trendline tested multiple times and may be suitable for a breakout
What do you think?

CAD/JPY At Interesting Supp , Long Setup Valid To Get 200 Pips !Here is my Analysis On CAD/JPY , I See that the price starting giving a good bullish Price Action , So we can enter a buy trade if the price back again to my support and give us any good bullish P.A , And we can put our target at high of down trend line , and if we have a closure above we can continue .
This Is An Educational + Analytic Content That Will Teach Why And How To Enter A Trade
Make Sure You Watch The Price Action Closely In Each Analysis As This Is A Very Important Part Of Our Method
Disclaimer : This Analysis Can Change At Anytime Without Notice And It Is Only For The Purpose Of Assisting Traders To Make Independent Investments Decisions.

CADJPY forming a W Pattern ?CADJPY recently broke the uptrend support and currently is in a down trend, but the formation of double bottom pattern suggest possible bullish momentum. let us see...

LONG ON CAD/JPYCAD/JPY is respecting a major demand area/zone
It has given a inverse head and shoulders in the recent pass, and now a double bottom at the same zone.
I will be buying this pair as a market order aiming for the next level of resistance/liquidity.

CADJPY: Bullish Continuation & Long Signal
CADJPY
- Classic bullish formation
- Our team expects pullback
SUGGESTED TRADE:
Swing Trade
Long CADJPY
Entry - 101.91
Sl - 101.20
Tp - 103.24
Our Risk - 1%
Start protection of your profits from lower levels
Disclosure: I am part of Trade Nation's Influencer program and receive a monthly fee for using their TradingView charts in my analysis.
❤️ Please, support our work with like & comment! ❤️

Bullish bounce?CAD/JPY is falling towards the pivot and could bounce to the 1st resistance.
Pivot: 101.88
1st Support: 101.45
1st Resistance: 102.91
Risk Warning:
Trading Forex and CFDs carries a high level of risk to your capital and you should only trade with money you can afford to lose. Trading Forex and CFDs may not be suitable for all investors, so please ensure that you fully understand the risks involved and seek independent advice if necessary.
Disclaimer:
The above opinions given constitute general market commentary, and do not constitute the opinion or advice of IC Markets or any form of personal or investment advice.
Any opinions, news, research, analyses, prices, other information, or links to third-party sites contained on this website are provided on an "as-is" basis, are intended only to be informative, is not an advice nor a recommendation, nor research, or a record of our trading prices, or an offer of, or solicitation for a transaction in any financial instrument and thus should not be treated as such. The information provided does not involve any specific investment objectives, financial situation and needs of any specific person who may receive it. Please be aware, that past performance is not a reliable indicator of future performance and/or results. Past Performance or Forward-looking scenarios based upon the reasonable beliefs of the third-party provider are not a guarantee of future performance. Actual results may differ materially from those anticipated in forward-looking or past performance statements. IC Markets makes no representation or warranty and assumes no liability as to the accuracy or completeness of the information provided, nor any loss arising from any investment based on a recommendation, forecast or any information supplied by any third-party.

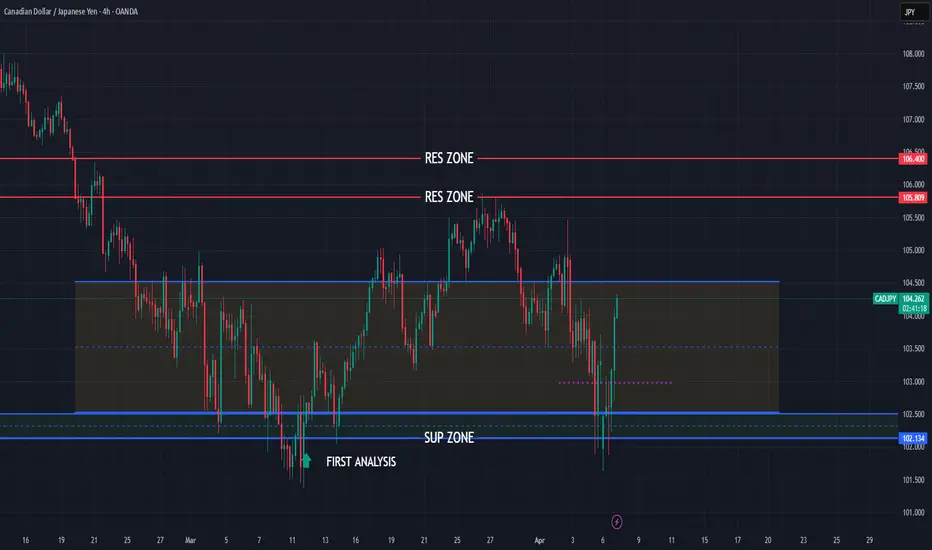
CADJPY still bullish expecting
OANDA:CADJPY first analysis highly accurate it's attached.
In first analysis i am share bullish view, having op we are not see some special big bullish move and based on PRICE ACTION analysis expecting here new bullish push.
SUP zone: 102.500
RES zone: 105.800, 106.400
CADJPY Buy Orders 103,359CADJPY bearish flag signaling possible possible visit to the support at 103,5. Have buy orders at 103,359, take profit at 104,7 and stop loss at 103.

CAD/JPY SHORT CAD/JPY SHORT " break of a support area and retest it + 61.8 % fib retracement + 50ema dynamic resistance + down trendline "

WHY CADJPY IS BULLISH ?? DETAILED ANALYSIS CAD/JPY is currently trading around 104.200, forming a falling wedge pattern—a technical indicator often suggestive of a potential bullish reversal. Traders are closely monitoring this setup for a breakout, which could potentially propel the pair toward the target price of 107.000, indicating a prospective gain of approximately 300 pips.
Fundamentally, the Canadian dollar's performance is closely tied to global oil prices, given Canada's status as a major oil exporter. Recent stability in oil markets has provided underlying support to the loonie. Conversely, the Japanese yen, traditionally viewed as a safe-haven currency, has experienced fluctuations influenced by shifts in global risk sentiment and the Bank of Japan's monetary policy stance. The divergence in economic indicators and central bank policies between Canada and Japan may contribute to the anticipated bullish momentum in the CAD/JPY pair.
Technical analysis reinforces this outlook. The falling wedge pattern observed on the charts is characterized by converging trendlines sloping downward, indicating diminishing bearish momentum. A decisive breakout above the upper trendline of the wedge, accompanied by increased trading volume, would serve as a confirmation of the bullish reversal. Key resistance levels to monitor include 105.000 and 106.000, with a sustained move above these thresholds enhancing the likelihood of reaching the 107.000 target.
Traders should exercise prudent risk management strategies, such as setting appropriate stop-loss orders, to mitigate potential market volatility. Additionally, staying informed about upcoming economic data releases and central bank communications from both Canada and Japan will be crucial in navigating this trade effectively. By aligning technical insights with fundamental developments, traders can position themselves to capitalize on the potential bullish breakout in the CAD/JPY pair.

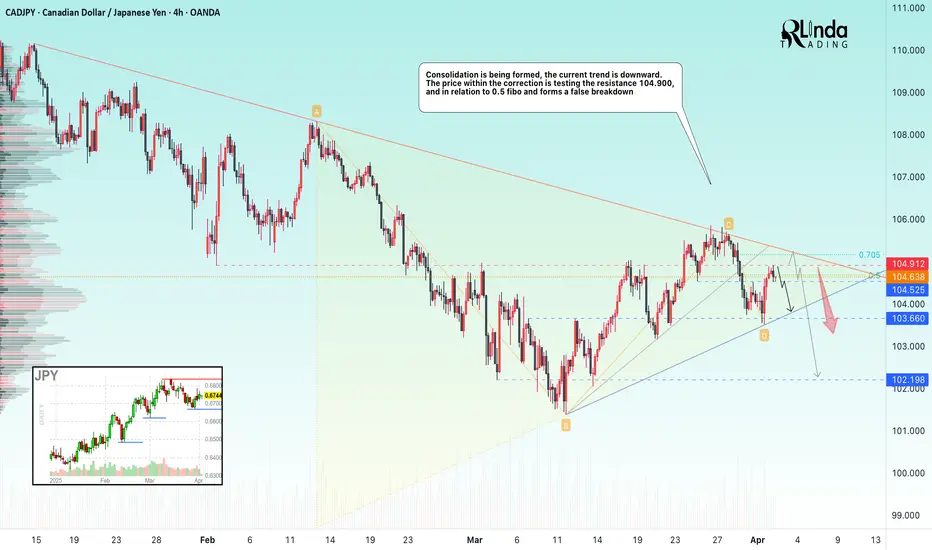
CADJPY → Consolidation before the news. DowntrendFX:CADJPY continues to forge a downtrend, but within the current movement a symmetrical triangle of accumulative nature is forming
The currency pair may continue its decline due to the strengthening of the Japanese Yen, while the Canadian is consolidating in a narrow range.
The situation may be accelerated by today's news, namely Trump's speech, where he may announce new tariff measures.
Technically, the price is correcting after the false break of 103.56, being below the previously broken upside support. Price is testing key resistance at 104.90, and against 0.5 Fibo is forming a false breakout. A consolidation below 104.69, a break of 104.525 could trigger further decline.
Resistance levels: 104.900, 105.36, 105.74
Support levels: 104.525, 103.56
There are important news ahead, high volatility is possible, especially at the moment of Trump's speech, which may set a medium-term tone in the market.
The currency pair is in consolidation on the background of the downtrend and the priority is to expect a continuation of the fall
Regards R. Linda!