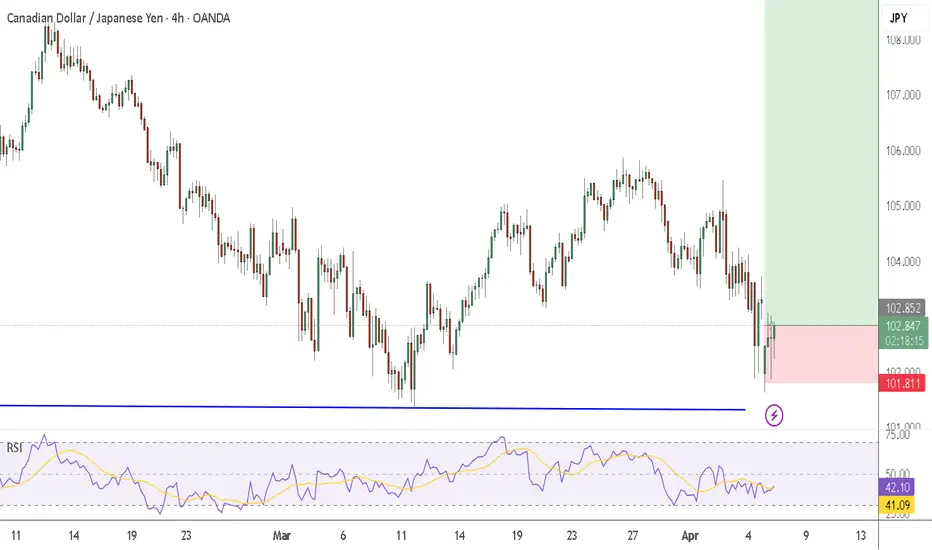
CADJPY Will Go Up! Long!
Please, check our technical outlook for CADJPY.
Time Frame: 1D
Current Trend: Bullish
Sentiment: Oversold (based on 7-period RSI)
Forecast: Bullish
The market is approaching a key horizontal level 102.695.
Considering the today's price action, probabilities will be high to see a movement to 106.707.
P.S
Please, note that an oversold/overbought condition can last for a long time, and therefore being oversold/overbought doesn't mean a price rally will come soon, or at all.
Disclosure: I am part of Trade Nation's Influencer program and receive a monthly fee for using their TradingView charts in my analysis.
Like and subscribe and comment my ideas if you enjoy them!
CADJPY trade ideas

CADJPY 4HCADJPY buy/long. I decided to share this simple idea as I journey to my wave analysis. Let's see what the market says...
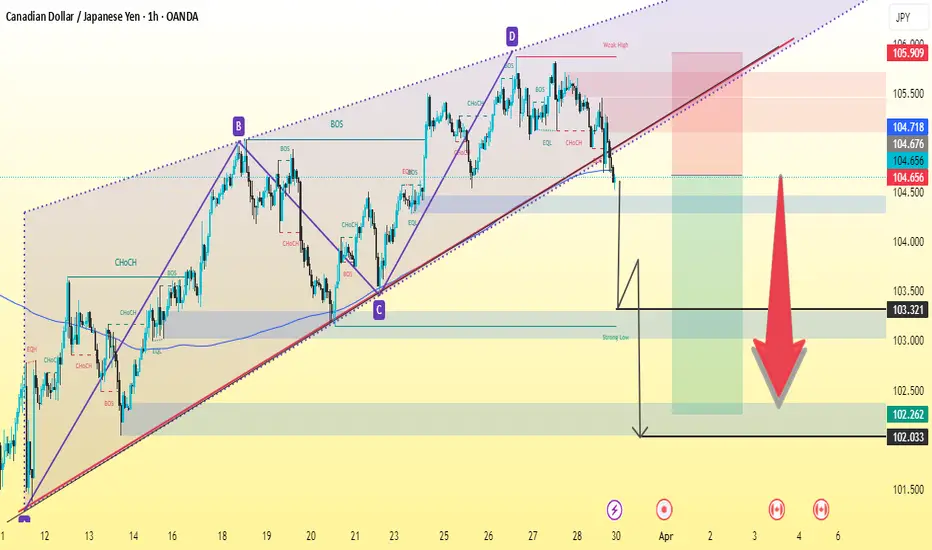
CAD/JPY breakDown trend line 1h analysis chartBased on your CAD/JPY chart analysis, here are key levels I can identify:
Entry Point:
A sell entry seems valid after a break below 104.656, confirming bearish momentum.
Stop Loss (SL105.900):
Place SL above the recent highs, likely around 105.900 , depending on your risk tolerance.
Take Profit (TP) / Target Zones:
First Support Zone: 103.500
Second Support Zone: 102.800
Final Target: 102.000 (as indicated by the large red arrow)
Support & Resistance Zones:
Major Resistance: 104.800 - 105.000
First Support: 103.500
Second Support: 102.800
Key Demand Zone: 102.000
This setup follows a breakout-retest strategy before continuation to the downside. Let me know if you need refinements!
CADJPY Strong Bearish Move Coming On my last Idea Post i was anticipating for CADJPY to drop to the March's Monthly Low, Now that I've analyze more in depth i do believe CADJPY is gonna have a Meltdown and Price is gonna start trading between 100. and 90. Levels, The reason of this is because if we look at the CADJPY charts specifically the Monthly Timeframe chart we can see price rejected a Mayor Level ( 112.500 ) with a lot of sellers coming in after the break of the level, now with time price was hesitant to break back above 112.500 until the monthly candle closure of February, confirming a Shift in Mayor Market Structure to the Downside creating a Lower High, not only the market did a Lower High but also printed a beautiful H&S Pattern and a FIB set up and combining the H&S Pattern with the FIB most likely Price will fall to the 61 ext. ( 92.000 level ) giving us more confluences that price will have a mayor drop on the Long Term, if we factor in News and Data, its also pointing out that CAD hasn't have bullish data being released from its latest news data and now with President Trump and his Tariff Proposal/Plan i do believe it is not gonna go very well for the CAD.

CAD/JPY Bearish Setup Near Resistance – Rejection Incoming?📉 Trend Analysis:
The pair is in a downtrend, confirmed by the descending trendline.
Lower highs and lower lows indicate bearish momentum.
📌 Key Levels:
Resistance Zone (104.5 - 106.0): Marked in purple, this area has previously acted as support and is now a key resistance zone.
Support Area: Around 100.0 - 101.0, a psychological level where price may find demand.
📊 Trade Scenario:
Bearish Rejection Expected: Price is approaching the resistance zone and trendline confluence. If rejection occurs, a downward move towards 100.0 is likely.
Break Above? If price breaks above the resistance zone and trendline, bullish momentum could invalidate the bearish setup.
🔍 Conclusion:
Watching for rejection near 105.0-106.0 to confirm a short opportunity.
If rejection happens, next targets are 102.0 → 100.0.
A bullish breakout above 106.0 could shift momentum upwards.

CAD/JPY "Loonie-Yen" Forex Bank Heist Plan (Day / Swing Trade)🌟Hi! Hola! Ola! Bonjour! Hallo! Marhaba!🌟
Dear Money Makers & Robbers, 🤑 💰💸✈️
Based on 🔥Thief Trading style technical and fundamental analysis🔥, here is our master plan to heist the CAD/JPY "Loonie-Yen" Forex Bank . Please adhere to the strategy I've outlined in the chart, which emphasizes long entry. Our aim is the high-risk Red Zone. Risky level, overbought market, consolidation, trend reversal, trap at the level where traders and bearish robbers are stronger. 🏆💸"Take profit and treat yourself, traders. You deserve it!💪🏆🎉
Entry 📈 : "The heist is on! Wait for the MA breakout (106.000) then make your move - Bullish profits await!"
however I advise to Place Buy stop orders above the Moving average (or) Place buy limit orders within a 15 or 30 minute timeframe most recent or swing, low or high level.
📌I strongly advise you to set an "alert (Alarm)" on your chart so you can see when the breakout entry occurs.
Stop Loss 🛑:
Thief SL placed at the recent/swing low level Using the 2H timeframe (104.500) Day / swing trade basis.
SL is based on your risk of the trade, lot size and how many multiple orders you have to take.
🏴☠️Target 🎯: 108.200 (or) Escape Before the Target
🧲Scalpers, take note 👀 : only scalp on the Long side. If you have a lot of money, you can go straight away; if not, you can join swing traders and carry out the robbery plan. Use trailing SL to safeguard your money 💰.
CAD/JPY "Loonie-Yen" Forex Bank Heist Plan (Day / Swing Trade) is currently experiencing a bullishness,., driven by several key factors.
📰🗞️Get & Read the Fundamental, Macro, COT Report, Quantitative Analysis, Sentimental Outlook, Intermarket Analysis, Future trend targets.. go ahead to check 👉👉👉🔗
⚠️Trading Alert : News Releases and Position Management 📰 🗞️ 🚫🚏
As a reminder, news releases can have a significant impact on market prices and volatility. To minimize potential losses and protect your running positions,
we recommend the following:
Avoid taking new trades during news releases
Use trailing stop-loss orders to protect your running positions and lock in profits
💖Supporting our robbery plan 💥Hit the Boost Button💥 will enable us to effortlessly make and steal money 💰💵. Boost the strength of our robbery team. Every day in this market make money with ease by using the Thief Trading Style.🏆💪🤝❤️🎉🚀
I'll see you soon with another heist plan, so stay tuned 🤑🐱👤🤗🤩

CADJPY Massive Long! BUY!
My dear followers,
This is my opinion on the CADJPY next move:
The asset is approaching an important pivot point 103.33
Bias - Bullish
Safe Stop Loss - 102.73
Technical Indicators: Supper Trend generates a clear long signal while Pivot Point HL is currently determining the overall Bullish trend of the market.
Goal - 104.29
About Used Indicators:
For more efficient signals, super-trend is used in combination with other indicators like Pivot Points.
Disclosure: I am part of Trade Nation's Influencer program and receive a monthly fee for using their TradingView charts in my analysis.
———————————
WISH YOU ALL LUCK

CADJPY BUY**📈 Key Long-Term Zone and Bullish Signal in Progress 🚀**
We are observing a **long-term key zone around 102**, which is acting as a **market support**. Additionally, there is a **support/resistance zone around 104**, which the pair has successfully broken and is holding above.
✅ **Downtrend TL broken**
✅ **Other technical signals aligned**
Everything suggests that the **pair is moving upwards**. A **pullback towards 103** could be an interesting area to watch.
👀 **Keep a close eye on this! Good luck, everyone!** 🚀📊
---
Still Holding Despite Trump’s Volatility Impact**
Trump’s speech caused **significant market nervousness and volatility**. Despite this, **my position on CADJPY remains open**.
➡️ **Staying alert to market reactions** and how the pair behaves in response to this uncertainty.
➡️ **My trading plan remains unchanged for now**, so I’ll keep following the setup.
💬 **How are you managing this sudden volatility?**

Inverse Head and shoulders NFP An increasing probability of stagflation risk in the US may see further narrowing of the 2-year sovereign yield premium spread between US Treasuries and JGBs.
CAD/JPY is the second worst-performing major yen crosses in the past three months.
CAD/JPY may see another round of impulsive down move sequence with the following medium-term supports coming in at 99.60 and 97.55.

CADJPY Will Move Lower! Sell!
Please, check our technical outlook for CADJPY.
Time Frame: 1h
Current Trend: Bearish
Sentiment: Overbought (based on 7-period RSI)
Forecast: Bearish
The price is testing a key resistance 103.448.
Taking into consideration the current market trend & overbought RSI, chances will be high to see a bearish movement to the downside at least to 102.631 level.
P.S
The term oversold refers to a condition where an asset has traded lower in price and has the potential for a price bounce.
Overbought refers to market scenarios where the instrument is traded considerably higher than its fair value. Overvaluation is caused by market sentiments when there is positive news.
Disclosure: I am part of Trade Nation's Influencer program and receive a monthly fee for using their TradingView charts in my analysis.
Like and subscribe and comment my ideas if you enjoy them!

Lingrid | CADJPY channel BREAKOUT. Potential Bearish MoveFX:CADJPY market recently broke and closed below the upward channel and following the channel breakout, the price has formed a range zone around 130.500. On the 1H timeframe, the market is making lower lows, while the daily timeframe shows a large engulfing candle, suggesting that the correction may be coming to an end. Given that today we have high-impact news, we can expect increased volatility in the market. I think that the price may move lower if it remains below the 104.000 resistance zone. My goal is support zone around 102.500
Traders, if you liked this idea or if you have your own opinion about it, write in the comments. I will be glad 👩💻

CADJPY SELL Another one with SL just above the 1H, it was supposed to be above the range but my risk will be huge so


CADJPY Heading to March's Monthly Low Looking at the CadJpy Chart i can see Price rejecting the Mayor Level 105.000 since Mid March, Now with time price has created some beautiful Market Structure, if we take a look at the Daily Or 4H chart there's a clean clear H&S Pattern printed at the Mayor Level 105. My Analysis for the next move on CadJpy is Price retesting the Monthly low of march ( 101.500 level ) because before price printed the H&S Pattern, price Broke Structure to the downside at the Mayor Level, Made a Higher Low For the Confirmation, and now price is retesting Previous Supply and Demand Zone ( 104. Level ) we do have some Strong news for CAD Friday April 4, I believe if the data does not come out good the the CAD price is gonna drop with some much momentum that the Daily FIB is gonna be fulfilled meaning i can see price drop all the way to 100. Level.


CADJPY 1D forecastLooking for a further decline on CADJPY daily timeframe, to complete the 5waves sequence.
We're in a wave (3) sequence, which is always an impulse pattern. We can project a price to make a new low relative to the current 3rd wave.

CAD/JPY SHORT FROM RESISTANCE
CAD/JPY SIGNAL
Trade Direction: short
Entry Level: 104.075
Target Level: 101.220
Stop Loss: 105.968
RISK PROFILE
Risk level: medium
Suggested risk: 1%
Timeframe: 1D
Disclosure: I am part of Trade Nation's Influencer program and receive a monthly fee for using their TradingView charts in my analysis.
✅LIKE AND COMMENT MY IDEAS✅

Trend Changing Pattern (TCP) in Action: Live ExampleHey traders,
Following up on yesterday’s lesson about the Trend Changing Pattern (TCP), I wanted to share a real-time example using the CADJPY pair in an intraday downtrend.
Today, we spotted a TCP setup where price action gave us a classic reversal signal:
The market manipulated the low of the TCP zone with a single break.
This was followed by a W pattern and a second attempt that failed to make a lower low.
That failure to create a new low acted as our entry confirmation for a long position.
🔹 Entry: 103.71 (Long)
🔹 Stop Loss: 103.28 (Just below the break low for protection)
This trade setup perfectly illustrates how price structure and momentum shifts can help you catch early entries during trend reversals.
Stay sharp, manage your risk — and have a blessed trading day!

Bearish breakout?CAD/JPY is reacting off the pivot which acts as an overlap support and could drop to the 1st support which has been identified as a pullback support.
Pivot: 103.58
1st Support: 102.28
1st Resistance: 104.70
Risk Warning:
Trading Forex and CFDs carries a high level of risk to your capital and you should only trade with money you can afford to lose. Trading Forex and CFDs may not be suitable for all investors, so please ensure that you fully understand the risks involved and seek independent advice if necessary.
Disclaimer:
The above opinions given constitute general market commentary, and do not constitute the opinion or advice of IC Markets or any form of personal or investment advice.
Any opinions, news, research, analyses, prices, other information, or links to third-party sites contained on this website are provided on an "as-is" basis, are intended only to be informative, is not an advice nor a recommendation, nor research, or a record of our trading prices, or an offer of, or solicitation for a transaction in any financial instrument and thus should not be treated as such. The information provided does not involve any specific investment objectives, financial situation and needs of any specific person who may receive it. Please be aware, that past performance is not a reliable indicator of future performance and/or results. Past Performance or Forward-looking scenarios based upon the reasonable beliefs of the third-party provider are not a guarantee of future performance. Actual results may differ materially from those anticipated in forward-looking or past performance statements. IC Markets makes no representation or warranty and assumes no liability as to the accuracy or completeness of the information provided, nor any loss arising from any investment based on a recommendation, forecast or any information supplied by any third-party.


CAD/JPY For Bearishyou can go short now
or
wait for pull-back near by entry point and then go short
general trend is up trend
current phase is pull-back
have fun :)

Trend Changing Pattern (TCP) ExplainedIntroduction
One of the most important skills in forex trading is learning how to read price action and understand what the market is telling you. Price is not just numbers — it’s the collective perception of traders, making it the most reliable leading indicator available.
Today, I want to explain a powerful concept known as the Trend Changing Pattern (TCP) — a crucial tool for identifying potential market reversals and shifts in trend direction.
📈 What Is a Trend Changing Pattern?
In any trending market, whether it's an uptrend or downtrend, the trend won’t change easily. The strength of the trend and the timeframe you're trading on will determine how long it takes for a true reversal to occur.
One key signal of a trend change is a shift in momentum:
In an uptrend, when a momentum low forms during a pullback, it can be a sign that the trend is beginning to reverse.
In a downtrend, a momentum high during a pullback can signal a potential bullish reversal.
These are what we refer to as Trend Changing Patterns (TCPs) — moments where the structure of the market starts to shift.
⚠️ Watch for Manipulation After the TCP
After a TCP appears, it's common to see price manipulation before the new trend fully takes hold:
In an uptrend, price may return to manipulate the previous high before continuing down.
In a downtrend, price often dips to manipulate the previous low before reversing higher.
Being aware of this common liquidity grab helps traders avoid being trapped and instead position themselves in alignment with the new trend.
🧠 Final Thoughts
Understanding how to spot and interpret a Trend Changing Pattern gives you a major edge in forex trading. It helps you stay ahead of the market and make informed decisions based on price action, not emotion.
🎥 In the video, I go into more detail about momentum highs and lows, and how to recognize these key patterns in real time. Be sure to check it out if you want to sharpen your trend reversal strategy.
Wishing you success on your trading journey! 🚀
