sell cadjpywe reach a resistance and then have rejection by candles and after the momentum shift is bearish by strong red candles,i enter...
CADJPY trade ideas
MY THOUGHTS ON CADJPYONCE PRICES TOUCHS MY CONFLUENCE ZONE I WOUKD wait for a bullish egulfing candle to close on the 1h time frame above my CTL and take my entry LONG

CADJPYIt will follow till tomorrow midday.
Let´s see.
Blessings.
Check "passiveincomes" at signal start.
thanks

Sell from PivotMy trading stradegy is simple
open trades on a Pivot lines (M / W)
this pair had strong movement down and may contiue bit more
my view

CADJPY still bearish to expect
OANDA:CADJPY strong bearish fall in week behind us, for next week still having bearish expectations.
SUP zone: 108.000
RES zone: 105.900, 105.500

CAD/JPY Enters Bearish Trend on 4H Chart – Key Levels to MonitorCAD/JPY Enters Bearish Trend on 4-Hour Chart – Key Levels to Monitor
The CAD/JPY currency pair has recently confirmed a bearish trend shift on the 4-hour timeframe, signaling potential further downside in coming sessions. This technical deterioration follows a decisive breakdown below the previous swing low, accompanied by significantly higher trading volumes – a strong indication of increasing selling pressure. The high-volume breakdown suggests institutional participation in this move, giving added credibility to the emerging downtrend.
Critical Technical Developments:
1. Trend Structure Breakdown - The pair has established a clear sequence of lower highs and lower lows
2. Volume Confirmation - The breakdown occurred with notably elevated trading volumes
3. Momentum Shift - Oscillators like RSI remain below key levels, supporting bearish momentum
Key Price Levels:
Downside Target: 105.00
This psychological support level represents the next major target for bears. Historical price action shows this area has previously acted as:
- A pivot point for multi-week reversals
Upper Resistance: 109.00
This level now serves as critical overhead resistance where:
- Previous support becomes new resistance
- Sellers are likely to re-emerge on any retests
- A close above would invalidate the current bearish structure
Trading Strategy Considerations:
For bearish traders:
- Short positions on pullbacks toward 107.50-108.00 may offer favorable risk/reward
- Position sizing should account for potential volatility spikes
- Initial targets can be scaled at 106.50 followed by 105.00
For potential buyers:
- Caution advised until clear reversal signals emerge
- The 105.00 level may offer a potential bounce opportunity if supported by:
- Bullish candlestick patterns
- Divergence on momentum indicators
- Reduction in selling volume
Risk Management Notes:
Traders should monitor:
- Crude oil price fluctuations (key CAD driver)
- Bank of Japan policy signals
- Canadian employment data (upcoming releases)
The current technical setup favors bearish positions, with the 109.00 level acting as a critical line in the sand for any trend reversal scenarios. As always, strict risk management remains essential given potential volatility in this currency cross.

CADJPy- Sell NowCADJPy- Sell Now Based on LS , TWS & M1 confirmation on CRT method. Lets hope at least 50% of the target is acheived :) whats are your thoughts. :)

CADJPY BUYBUY @106.736
SL @106.672
TP @107.056
Only if it makes any inducement enter, otherwise don't trade.....and if it creates BOS close the trade
And always risk 1%

CADJPY Bearish Breakout!
HI,Traders !
#CADJPY made a bearish
Breakout of the key horizontal
Level around 107.376 and the
Breakout is confirmed After retesting the key
level which has now become resistance we
Will be expecting a further
Bearish move down !
Comment and subscribe to help us grow !

CADJPY--SHORT--02_08_25--after long term bullish trend, time to pullback to the monthly support.
--entry around 107.660 and 105.830 zone.
--TP:105.830

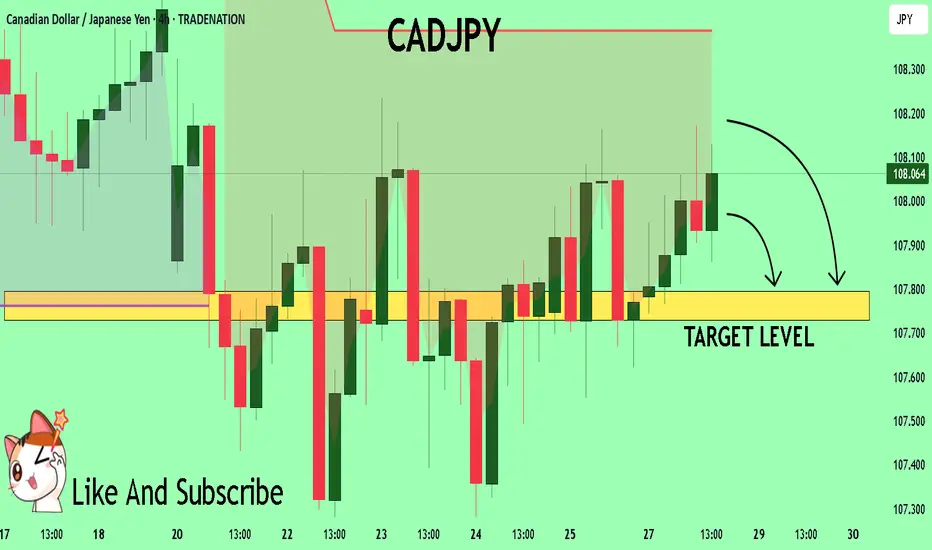
CADJPY Expected Growth! BUY!
My dear friends,
CADJPY looks like it will make a good move, and here are the details:
The market is trading on 107.35 pivot level.
Bias - Bullish
Technical Indicators: Supper Trend generates a clear long signal while Pivot Point HL is currently determining the overall Bullish trend of the market.
Goal - 107.90
About Used Indicators:
Pivot points are a great way to identify areas of support and resistance, but they work best when combined with other kinds of technical analysis
Disclosure: I am part of Trade Nation's Influencer program and receive a monthly fee for using their TradingView charts in my analysis.
———————————
WISH YOU ALL LUCK

CADJPY 60/15 Pullback LongJust turn in to bullish trend, so i am doubt about the gap will propel the bounce earlier. Possible 1st trade on the middle gap or the 2nd trade is bounce on the buy zone.

CADJPY Short Day Trade OANDA:CADJPY Short Day Trade, with my back testing of this strategy, it hits multiple possible take profits, manage your position accordingly.
Note: Manage your risk yourself, its risky trade, see how much your can risk yourself on this trade.
Use proper risk management
Looks like good trade.
Lets monitor.
Use proper risk management.
Disclaimer: only idea, not advice

CAD/JPY reaccumulationI am looking for reaccumulation here, since we are in a higher time frame model 1 with an orderflow objective of 111.550. My model 2 POI is the extreme demand. In case there is no confirmation i am watching the liquidity+demand below for a model 1. If none of it confirms i will wait for lower levels.


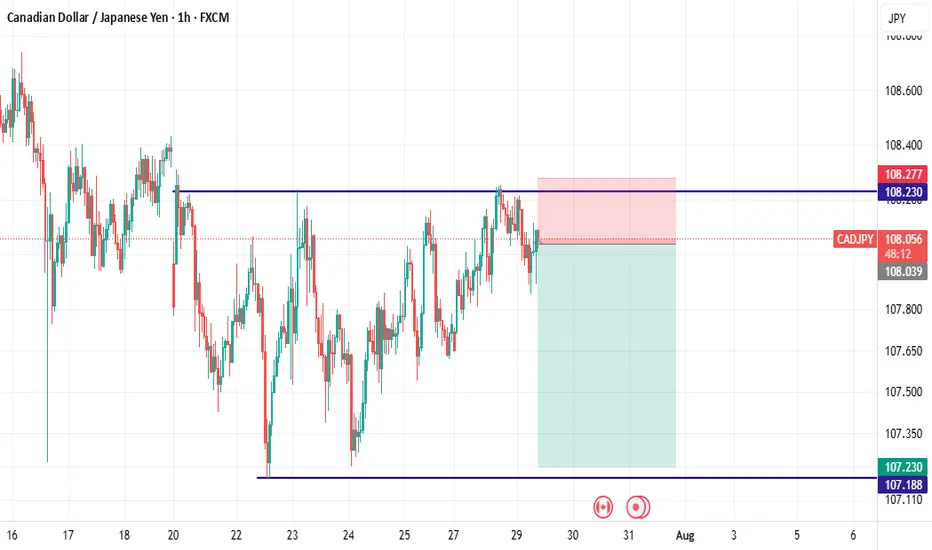
CADJPY Trading Opportunity! SELL!
My dear followers,
I analysed this chart on CADJPY and concluded the following:
The market is trading on 108.08 pivot level.
Bias - Bearish
Technical Indicators: Both Super Trend & Pivot HL indicate a highly probable Bearish continuation.
Target - 107.79
About Used Indicators:
A super-trend indicator is plotted on either above or below the closing price to signal a buy or sell. The indicator changes color, based on whether or not you should be buying. If the super-trend indicator moves below the closing price, the indicator turns green, and it signals an entry point or points to buy.
Disclosure: I am part of Trade Nation's Influencer program and receive a monthly fee for using their TradingView charts in my analysis.
———————————
WISH YOU ALL LUCK
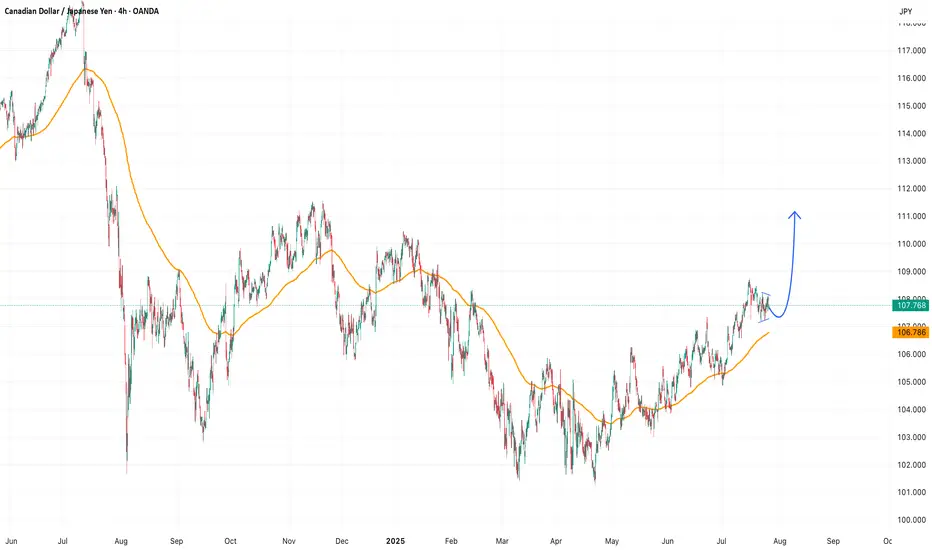
CADJPY Analysis: Uptrend Remains Intact – Look to BuyThe CADJPY pair continues to maintain its strong upward trend on the higher timeframes. Recent pullbacks appear to be temporary corrections and have not broken the overall bullish structure. Therefore, the most appropriate strategy at this stage is to wait for buying opportunities and look for confirmation before entering long positions.
Patience is key — waiting for clear price action signals or technical confirmations can greatly improve your trade success rate.
Suggested Strategy:
Monitor the H1 or H4 timeframe for bullish reversal patterns.
Look to buy when price retests key support zones and shows confirmation (e.g., pin bar, bullish engulfing, breakout).
Stick to your trading plan and follow the trend — the bulls are still in control!
CAD_JPY WILL GO UP|LONG|
✅CAD_JPY will soon retest a key support level of 107.500
So I think that the pair will make a rebound
And go up to retest the supply level above at 108.100
LONG🚀
✅Like and subscribe to never miss a new idea!✅
Disclosure: I am part of Trade Nation's Influencer program and receive a monthly fee for using their TradingView charts in my analysis.

CADJPY TRADE RECAPLooking Into This Trade That I shared To You Yesterday. I Just Want To Explain The Reason Behind This Trade And I Hope It Is Going To Add Something In Your Trading

CAD/JPY BEARS WILL DOMINATE THE MARKET|SHORT
Hello, Friends!
CAD-JPY uptrend evident from the last 1W green candle makes short trades more risky, but the current set-up targeting 106.478 area still presents a good opportunity for us to sell the pair because the resistance line is nearby and the BB upper band is close which indicates the overbought state of the CAD/JPY pair.
Disclosure: I am part of Trade Nation's Influencer program and receive a monthly fee for using their TradingView charts in my analysis.
✅LIKE AND COMMENT MY IDEAS✅

CAD-JPY Rebound Ahead! Buy!
Hello,Traders!
CAD-JPY made a retest
Of the horizontal support
Of 107.400 from where we
Are already seeing a bullish
Rebound and we will be
Expecting a further bullish
Move up
Buy!
Comment and subscribe to help us grow!
Check out other forecasts below too!
Disclosure: I am part of Trade Nation's Influencer program and receive a monthly fee for using their TradingView charts in my analysis.

CADJPY FORECAST I'm looking into the CADJPY ,The way it looks like from the higher timeframe it is very interesting. Looking into the zones that I've highlighted to see if price is going to give me a potential. let's see how price is going to play out

CADJPY - The Bulls Are Stronger than Ever!Hello TradingView Family / Fellow Traders. This is Richard, also known as theSignalyst.
📈CADJPY has been overall bullish trading within the rising wedge pattern marked in red.
This week, CADJPY has been retesting the lower bound of the wedge.
Moreover, the green zone is a strong weekly support.
🏹 Thus, the highlighted blue circle is a strong area to look for buy setups as it is the intersection of the lower red trendline and green support.
📚 As per my trading style:
As #CADJPY approaches the blue circle zone, I will be looking for trend-following bullish reversal setups (like a double bottom pattern, trendline break , and so on...)
📚 Always follow your trading plan regarding entry, risk management, and trade management.
Good luck!
All Strategies Are Good; If Managed Properly!
~Rich
Disclosure: I am part of Trade Nation's Influencer program and receive a monthly fee for using their TradingView charts in my analysis.
