CADJPY trade ideas

CADJPY - Short CADJPY is moving in bearish trend with no bullish divergence.
Entry is at retracement at LH.

CAD/JPY At Very Interesting Area To Buy , Don`t Miss 250 Pips !This Is An Educational + Analytic Content That Will Teach Why And How To Enter A Trade
Make Sure You Watch The Price Action Closely In Each Analysis As This Is A Very Important Part Of Our Method
Disclaimer : This Analysis Can Change At Anytime Without Notice And It Is Only For The Purpose Of Assisting Traders To Make Independent Investments Decisions.

CADJPY Take it or Leave itCADJPY - This week 16 - 21/03/2025 both players has high impact news . Yen is stronger and we want to follow the trend if the news will give us the change. Very interesting pair to watch this week.

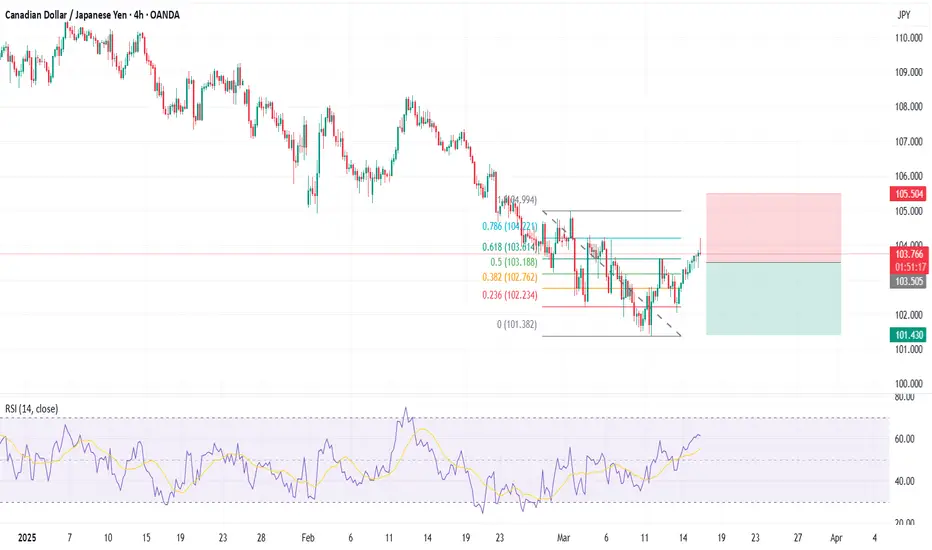
CADJPY LONG1. On wkly TF narrative is bearish but has just rejected an old low. Prev wk candle swept the wk1 candle closing above issuing a high probability chance for reversal.
2. on H4 Tf price has shifted the bias from bearish to bullish, hence this week we are looking for longs to the highs of the week 1 candle

CAD/JPY "The Loonie-Yen" Forex Market Bullish Heist Plan🌟Hi! Hola! Ola! Bonjour! Hallo!🌟
Dear Money Makers & Thieves, 🤑 💰🐱👤🐱🏍
Based on 🔥Thief Trading style technical and fundamental analysis🔥, here is our master plan to heist the CAD/JPY "The Loonie-Yen" Forex market. Please adhere to the strategy I've outlined in the chart, which emphasizes long entry. Our aim is the high-risk Red Zone. Risky level, overbought market, consolidation, trend reversal, trap at the level where traders and bearish robbers are stronger. 🏆💸Book Profits, Be wealthy and safe trade.💪🏆🎉
Entry 📈 : "The heist is on! Wait for the MA breakout (108.500) then make your move - Bullish profits await!"
however I advise to placing the Buy Stop Orders above the breakout MA or placing the Buy limit orders within a 15 or 30 minute timeframe. Entry from the most recent or closest low or high level should be in retest.
Stop Loss 🛑: Thief SL placed at 107.100 (swing Trade Basis) Using the 4H period, the recent / Swing Low or High level.
SL is based on your risk of the trade, lot size and how many multiple orders you have to take.
Target 🎯: 112.000 (or) Escape Before the Target
🧲Scalpers, take note 👀 : only scalp on the Long side. If you have a lot of money, you can go straight away; if not, you can join swing traders and carry out the robbery plan. Use trailing SL to safeguard your money 💰.
📰🗞️Fundamental, Macro, COT, Sentimental Outlook:
CAD/JPY "The Loonie-Yen" Forex Market market is currently experiencing a bullish trend,., driven by several key factors.
🟣Fundamental Analysis
Economic Indicators: Influenced by Canada's GDP, employment change, consumer price index, and Japan's GDP, inflation rates.
Monetary Policies: Impacted by Bank of Canada (BOC) and Bank of Japan (BOJ) interest rate decisions, quantitative easing, and forward guidance.
Trade Balance: Canada's trade balance, particularly with the US, and Japan's trade balance with China and the US.
Energy Prices: Correlated with energy prices, as Canada is a major oil exporter.
Safe-Haven Currency: Japanese yen considered a safe-haven currency during times of market stress.
🟡Macroeconomic Analysis
Global Economic Trends: The global economic slowdown and trade tensions are impacting both Canada and Japan
Commodity Prices: Canada's economy is heavily influenced by commodity prices, particularly oil prices
Japan's Trade Balance: Japan's trade balance has been impacted by the ongoing trade tensions between the US and China
🔵COT Data Analysis
Net Long Positions: Institutional traders have increased their net long positions in CAD/JPY to 58%
COT Ratio: The COT ratio has risen to 2.1, indicating a bullish trend
Non-Commercial Traders: Non-commercial traders, such as hedge funds and individual traders, have increased their long positions to 62%
⚪Market Sentimental Analysis
Bullish Sentiment: 55% of client accounts are long on this market, indicating a bullish sentiment
Bearish Sentiment: 45% of client accounts are short on this market, indicating a bearish sentiment
🔴Positioning Data Analysis
Institutional Traders: Institutional traders are positioning themselves for a bullish trend, with some predicting a move to 112.00
Corporate Traders: Corporate traders are also monitoring the pair's performance, considering factors like interest rates and global economic trends
🟠Technical Analysis
Trend Line: The pair is holding comfortably above the ascending trend line
Moving Averages: The 200-period and 100-period Simple Moving Averages (SMA) are indicating a bullish bias
Relative Strength Index (RSI): The RSI indicator on the 4-hour chart stays above 50, indicating a bullish trend
⚠️Trading Alert : News Releases and Position Management 📰 🗞️ 🚫🚏
As a reminder, news releases can have a significant impact on market prices and volatility. To minimize potential losses and protect your running positions,
we recommend the following:
Avoid taking new trades during news releases
Use trailing stop-loss orders to protect your running positions and lock in profits
📌Please note that this is a general analysis and not personalized investment advice. It's essential to consider your own risk tolerance and market analysis before making any investment decisions.
📌Keep in mind that these factors can change rapidly, and it's essential to stay up-to-date with market developments and adjust your analysis accordingly.
💖Supporting our robbery plan will enable us to effortlessly make and steal money 💰💵 Tell your friends, Colleagues and family to follow, like, and share. Boost the strength of our robbery team. Every day in this market make money with ease by using the Thief Trading Style.🏆💪🤝❤️🎉🚀
I'll see you soon with another heist plan, so stay tuned 🤑🐱👤🤗🤩

CADJPY MAJOR SUPPORT IS BROKEN!!!CAD/JPY has broken the major weekly support and In this case, a massive bearish trend may emerge from the look of things. A retracement to the broken support which now turn resistance may support a further bearish trend. We keep a close watch to see how to capitalize on this emerging trend

CAD/JPY SHORT FROM RESISTANCE
Hello, Friends!
CAD/JPY pair is in the downtrend because previous week’s candle is red, while the price is clearly rising on the 2H timeframe. And after the retest of the resistance line above I believe we will see a move down towards the target below at 102.749 because the pair is overbought due to its proximity to the upper BB band and a bearish correction is likely.
Disclosure: I am part of Trade Nation's Influencer program and receive a monthly fee for using their TradingView charts in my analysis.
✅LIKE AND COMMENT MY IDEAS✅

Waiting for intraday bullish signal If price breaks intraday high (red line) the long is possible, otherwise waiting to long from the blue line as intraday option. Anything can happen though.

CADJPY is in the Selling TrendHello Traders
In This Chart CADJPY HOURLY Forex Forecast By FOREX PLANET
today CADJPY analysis 👆
🟢This Chart includes_ (CADJPY market update)
🟢What is The Next Opportunity on CADJPY Market
🟢how to Enter to the Valid Entry With Assurance Profit
This CHART is For Trader's that Want to Improve Their Technical Analysis Skills and Their Trading By Understanding How To Analyze The Market Using Multiple Timeframes and Understanding The Bigger Picture on the Charts

CADJPYCanada cut interest rate yesterday and is still under a trade war with the USA. Which is bearish for the CAD. On the other hand, the yen has been attractive as investors seek risk off assets during this trade war. Also, the BOJ has been hawkish this year on interest rate.

Could the price bounce from here?CAD/JPY is falling towards the pivot and could bounce to the overlap resistance.
Pivot: 102.38
1st Support: 101.36
1st Resistance: 104.86
Risk Warning:
Trading Forex and CFDs carries a high level of risk to your capital and you should only trade with money you can afford to lose. Trading Forex and CFDs may not be suitable for all investors, so please ensure that you fully understand the risks involved and seek independent advice if necessary.
Disclaimer:
The above opinions given constitute general market commentary, and do not constitute the opinion or advice of IC Markets or any form of personal or investment advice.
Any opinions, news, research, analyses, prices, other information, or links to third-party sites contained on this website are provided on an "as-is" basis, are intended only to be informative, is not an advice nor a recommendation, nor research, or a record of our trading prices, or an offer of, or solicitation for a transaction in any financial instrument and thus should not be treated as such. The information provided does not involve any specific investment objectives, financial situation and needs of any specific person who may receive it. Please be aware, that past performance is not a reliable indicator of future performance and/or results. Past Performance or Forward-looking scenarios based upon the reasonable beliefs of the third-party provider are not a guarantee of future performance. Actual results may differ materially from those anticipated in forward-looking or past performance statements. IC Markets makes no representation or warranty and assumes no liability as to the accuracy or completeness of the information provided, nor any loss arising from any investment based on a recommendation, forecast or any information supplied by any third-party.

Potential bullish rise?CAD/JPY is reacting off the pivot and could rise to the 1st resistance which line sup with the 50% Fibonacci retracement.
Pivot: 102.38
1st Support: 101.36
1st Resistance: 104.74
Risk Warning:
Trading Forex and CFDs carries a high level of risk to your capital and you should only trade with money you can afford to lose. Trading Forex and CFDs may not be suitable for all investors, so please ensure that you fully understand the risks involved and seek independent advice if necessary.
Disclaimer:
The above opinions given constitute general market commentary, and do not constitute the opinion or advice of IC Markets or any form of personal or investment advice.
Any opinions, news, research, analyses, prices, other information, or links to third-party sites contained on this website are provided on an "as-is" basis, are intended only to be informative, is not an advice nor a recommendation, nor research, or a record of our trading prices, or an offer of, or solicitation for a transaction in any financial instrument and thus should not be treated as such. The information provided does not involve any specific investment objectives, financial situation and needs of any specific person who may receive it. Please be aware, that past performance is not a reliable indicator of future performance and/or results. Past Performance or Forward-looking scenarios based upon the reasonable beliefs of the third-party provider are not a guarantee of future performance. Actual results may differ materially from those anticipated in forward-looking or past performance statements. IC Markets makes no representation or warranty and assumes no liability as to the accuracy or completeness of the information provided, nor any loss arising from any investment based on a recommendation, forecast or any information supplied by any third-party.

CADJPY TRADE IDEAPrice is currently on a downtrend, awaiting price to take out inducement and activate on the 1 hour or 30 mins order block marked to continue the sell

CADJPY Wave Analysis – 11 March 2025
- CADJPY reversed from the support area
- Likely to rise to the resistance level 104.00
CADJPY currency pair recently reversed up from the support area between the major long-term support level 101.60 (former multi-month support from August) and the lower daily Bollinger Band.
The upward reversal from this support area will likely form the daily Japanese candlesticks reversal pattern Bullish Engulfing.
Given the strength of the support level 101.60, CADJPY currency pair can be expected to rise to the next resistance level 104.00 (former top of wave ii).

CADJPY: Bearish Continuation is Expected! Here is Why:
The price of CADJPY will most likely collapse soon enough, due to the supply beginning to exceed demand which we can see by looking at the chart of the pair.
Disclosure: I am part of Trade Nation's Influencer program and receive a monthly fee for using their TradingView charts in my analysis.
❤️ Please, support our work with like & comment! ❤️

CAD JPY Entry Setup 30 mins timeframe Bearish Break and Retest
Pattern confirmed.
Now we wait for candlestick confirmation. ⏰

CADJPY SELLCADJPY in an obvious downtrend. The price is at 15m S/R. Sell opportunity with a strong bearish rejection here.
Make sure to manage your risk before entering the trade!


CADJPY-BUY strategy Daily chartThe pair has been moving down aggressively, and even though its very oversold, it managed to move even lower than expectation. My view is unchanged, and the objective is somewhere 105.78 area or higher, hence the reward ratio is very attractive.
Strategy BUY current or add @ 101.50-101.75 and take profit near 105.57 for now.

CADJPY-BUY strategy 12 hourly chart I had placed a KAGI chart some days back, and that showed quite an oversold status. The regression analysis, as well shows we are in an oversold state, but not very extreme, but reasonable enough, and we are trading at the lower end of the channel.
Strategy unchanged view, and BUY current or add to LONG positions @ 102.00-102.35 and take profit @ 105.17 for now.

CADCHF-BUY SIDE Technical AnnalysesHere's a technical analysis for CAD/JPY (Canadian Dollar / Japanese Yen) focusing on the BUY side, including support and resistance levels:
CADCHF-BUY NOW
Entry Point-102.890
TP 1 - 103.876
TP 2 - 104.968
Stop Loss-101.729
