CADJPY - Take Advantage of This Clean Correction!CADJPY Daily Timeframe
CADJPY has shown a clear impulse in July 2024. We are now in a massive correction, consisting of 3 major waves, ABC. It appears we have almost completed Wave B and now we are anticipating wave C.
We expect wave C to push up to the corrective highs where we have the 61.8 fib.
Here are some key things to watch:
- Wave Structure: Ensure that Wave B has completed its corrective pattern
- Wave C Confirmation: Look for a strong bullish impulse off the lows of Wave B.
- Volume & Momentum: A rise in volume and bullish divergence in RSI/MACD could confirm Wave C is underway.
Confirmation for Wave C:
Break of Structure (BOS) / Trendline Break
When identifying confirmation for Wave C, a Break of Structure (BOS) or a Trendline Break is one of the strongest signals that the corrective phase is ending.
Break of Structure (BOS) – Key Levels to Watch
Wave B typically forms lower highs and lower lows. A break above the last lower high signals a bullish shift.
Look for a decisive close above the previous swing high on the 4H or daily timeframe. A weak break (with wicks) may indicate hesitation.
A higher low after the break adds extra confirmation.
Trendline Break – Reversal Signal
If Wave B formed a descending trendline, watch for a clean breakout with strong bullish candles (not just wicks).
Retest of the trendline as support after the breakout strengthens the case for Wave C starting.
Trade Idea:
- Watch for Wave C to start using the techniques listed above
- Once entered, keep stops below wave B
- Targets: 107 (500pips), 112 (1000pips)
Goodluck and as always trade safe!
See below for our previous swing setups:
Swing Setup 1
Swing Setup 2
Swing Setup 3
CADJPY trade ideas

CADJPY-BUY strategy 12 houely chart KagiWe are very oversold and judging regression channel, wedge and fisher form, clearly we should see a reasonable correction in the near-term.
Strategy BUY current 102.80-103.10 and take profit near 105.75 for now. (think it can stretch towards 106.25 even).

CAD/JPY AnalysisCAD/JPY looks promising here for a buy position.
You guys can take trade and manage your risk accordingly

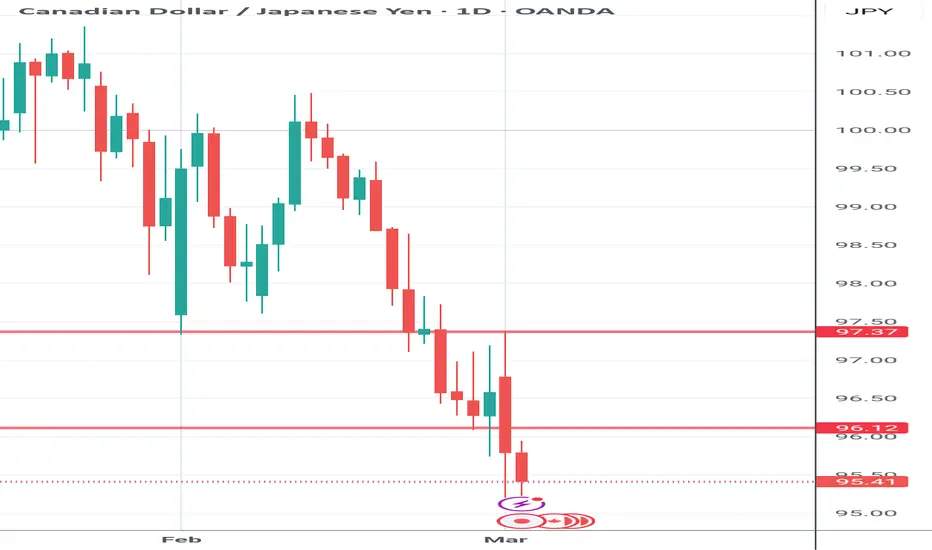
CAD/JPY Analysis – Key Levels & Market Drivers📉 Bearish Context & Key Resistance Levels:
Major Resistance at 108.32
Price previously rejected from this strong supply zone.
Moving averages (yellow & red lines) are acting as dynamic resistance.
Short-term Resistance at 106.00-107.00
Failed bullish attempt, leading to a strong reversal.
A break above this area is needed to shift momentum bullishly.
📈 Bullish Context & Key Support Levels:
Support at 102.00-101.50 (Demand Zone)
Significant buyer interest in this area.
If the price reaches this zone, a potential bounce could occur.
Deeper Support at 99.00-100.00
If 102.00 fails, the next demand level is in the high 90s, marking a critical long-term support.
📉 Current Market Outlook:
CAD/JPY is in a strong downtrend, consistently making lower highs and lower lows.
The price is testing key support areas, and further movement depends on upcoming economic events.
A potential bounce could occur at 102.00, but failure to hold could trigger further declines toward 99.00.
📰 Fundamental Analysis & Market Drivers
🔹 Bank of Canada (BoC) Interest Rate Decision – March 12, 2025
Expected rate cut from 3.00% to 2.75% → Bearish for CAD.
A dovish stance signals weakness in the Canadian economy, potentially pushing CAD/JPY lower.
If the BoC provides an aggressive rate cut or hints at further easing, the downtrend could continue.
🔹 Japan Current Account (January) – March 7, 2025
Expected at 370B JPY (significantly lower than previous 1077.3B JPY).
A lower-than-expected surplus may weaken JPY, slightly offsetting CAD weakness.
If JPY remains strong despite this data, CAD/JPY could fall further toward 101.50-100.00.
📈 Potential Trading Setups:
🔻 Short Setup (Bearish Bias):
Entry: Below 103.00, confirming further weakness.
Target 1: 102.00
Target 2: 100.00
Stop Loss: Above 104.50 to avoid volatility spikes.
🔼 Long Setup (Bullish Scenario - Retracement Play):
Entry: Strong bullish rejection from 102.00
Target 1: 105.00
Target 2: 108.00
Stop Loss: Below 101.50 to limit downside risk.
📌 Final Thoughts:
The BoC rate decision will likely be bearish for CAD, increasing downward pressure on CAD/JPY.
The Japan Current Account data could provide temporary support for JPY but is unlikely to fully reverse the trend.
102.00-101.50 is a key buying zone, while failure to hold could drive the pair toward 99.00-100.00.
🚨 Key Watch Zones: 102.00 Support & 108.00 Resistance – Strong moves expected!


cadjpy buy tradeThe Relative Strength Index (RSI) is showing an upward trend, indicating increasing momentum. Additionally, the Moving Average Convergence Divergence (MACD) is showing a bullish crossover, further supporting the potential for an upward move.

JPY is STRONGEST Hi, I I have indicated that YEN is taking control as being known as SAFE HEAVEN. Canadian Dollar is weak and this could be an opportunity.


Potential bullish rise?CAD/JPY has reacted off the pivot and could rise to the 1st resistance which lines up with the 50% Fibonacci retracement.
Pivot: 103.30
1st Support: 102.36
1st Resistance: 105.36
Risk Warning:
Trading Forex and CFDs carries a high level of risk to your capital and you should only trade with money you can afford to lose. Trading Forex and CFDs may not be suitable for all investors, so please ensure that you fully understand the risks involved and seek independent advice if necessary.
Disclaimer:
The above opinions given constitute general market commentary, and do not constitute the opinion or advice of IC Markets or any form of personal or investment advice.
Any opinions, news, research, analyses, prices, other information, or links to third-party sites contained on this website are provided on an "as-is" basis, are intended only to be informative, is not an advice nor a recommendation, nor research, or a record of our trading prices, or an offer of, or solicitation for a transaction in any financial instrument and thus should not be treated as such. The information provided does not involve any specific investment objectives, financial situation and needs of any specific person who may receive it. Please be aware, that past performance is not a reliable indicator of future performance and/or results. Past Performance or Forward-looking scenarios based upon the reasonable beliefs of the third-party provider are not a guarantee of future performance. Actual results may differ materially from those anticipated in forward-looking or past performance statements. IC Markets makes no representation or warranty and assumes no liability as to the accuracy or completeness of the information provided, nor any loss arising from any investment based on a recommendation, forecast or any information supplied by any third-party.

cadjpy expect a bullish run after a liquidity sweep, also support and resistance at adds to the confluence

CAD/JPY 4H and 1H - SELL OANDA:CADJPY Analysis
4-Hour Chart Analysis
The 4-hour chart shows CAD/JPY in a clear downtrend with lower highs and lower lows. Key observations:
Price has been declining from around 110.500 to current levels around 103.079
Recently formed a potential double bottom around 102.500 level
Currently showing some consolidation/minor bounce from these lows
Price is below key moving averages (based on the chart structure)
1-Hour Chart Analysis
The 1-hour chart provides a closer look at recent price action:
Shows a recent bounce from the lows
Price has formed a small consolidation pattern
Currently at 103.079 with a -0.07% daily change
Some short-term resistance likely around 103.500-104.000 area
Trade Setup:
Direction: Looking for potential short entry
Entry Point : Enter short at 103.500-103.700 zone (on a rejection/failure to break higher)
Stop Loss: Place stop at 104.000 (approximately 30 pips from entry, matching your risk tolerance)
Take Profit: Target the recent lows at 102.500 area (100+ pip potential)
Risk-to-Reward Ratio: Approximately 1:3
Rationale:
The dominant trend is clearly bearish on larger timeframes
Recent bounce appears corrective rather than trend-changing
Previous support levels often become resistance on retests
The 103.500-104.000 zone should act as resistance
Alternative Scenario:
If price breaks above 104.000 with conviction, I would avoid entering and reassess the setup, as this could indicate a deeper correction or potential trend change.
Important Note:
Wait for price action confirmation at the resistance zone before entering (such as bearish engulfing, rejection candles, or failure to break higher with diminishing volume).

CADJPY - ShortCADJPY is moving in bearish trend with no bullish divergence.
Entry is at retracement at LH.

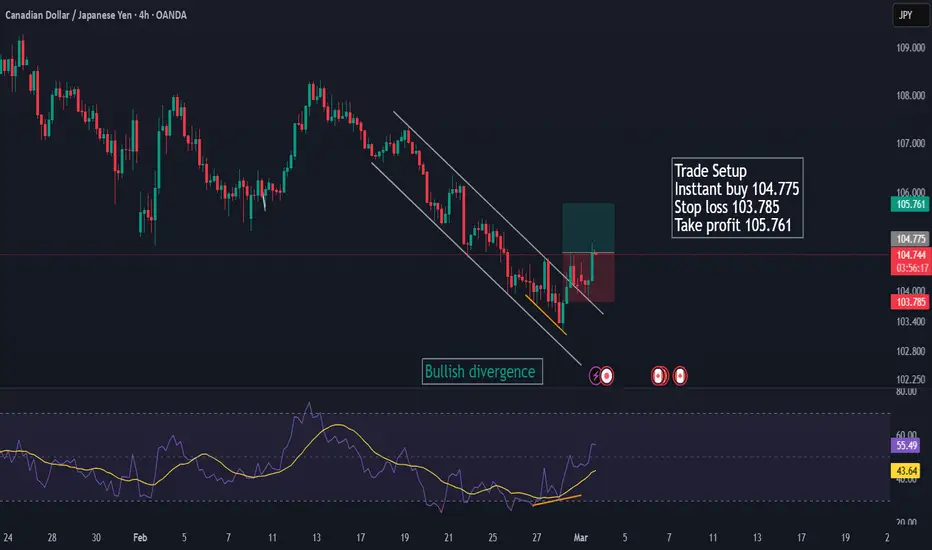
CADJPY BULLISH CADJPY – Potential Bullish Reversal Setup
CADJPY has been in a sustained bearish trend; however, signs of a potential reversal are emerging. A bullish divergence has been identified on the RSI, signaling weakening bearish momentum. Additionally, the price has broken out of a parallel descending channel, further supporting the possibility of a trend reversal.
Moreover, the structure has shifted as the previous Lower High (LH) has been broken, indicating the first sign of bullish strength. Based on this confluence of factors, I am entering a buy position immediately, anticipating further upside continuation.
Key Confluences:
RSI bullish divergence
Breakout of the descending parallel channel
Structure break of the previous Lower High (LH)
Disclaimer:
This analysis is for educational purposes only and not financial advice. Always manage your risk accordingly.
Sell CADJPYWith Trump's announcement of Tarrifs on Canada and Mexico starting tomorrow, I expect this downward trend to continue on the JPY and CHF pairs

#CADJPY Buy Setup🔼#CADJPY Buy Setup
Currently Trading at 102.940 , Buy On Dip In Range 102.292—101.504 For The Target 105.500—108.780


CAD/JPY SENDS CLEAR BULLISH SIGNALS|LONG
Hello, Friends!
We are now examining the CAD/JPY pair and we can see that the pair is going down locally while also being in a downtrend on the 1W TF. But there is also a powerful signal from the BB lower band being nearby indicating that the pair is oversold so we can go long from the support line below and a target at 108.118 level.
✅LIKE AND COMMENT MY IDEAS✅

POTENTIAL LONG TRADE SET UP FOR CADJPYAnalysis: Utilizing chart patterns, highs & lows, and impulses & corrections, the focus is on identifying a continuation corrective structure following a breakout.
The price has approached a previous swing low zone on the higher time frame (HTF) while moving within a descending structure on the MTF. The price has broken out of the MTF descending structure and we will now monitor for a continuation structure to identify a potential entry point for the trade.
Expectation: A upward move is expected.
⚠️ Reminder: Always conduct your own analysis and apply proper risk management, as forex trading involves no guarantees. This is a high-risk activity, and past performance is not indicative of future results. Trade responsibly!
