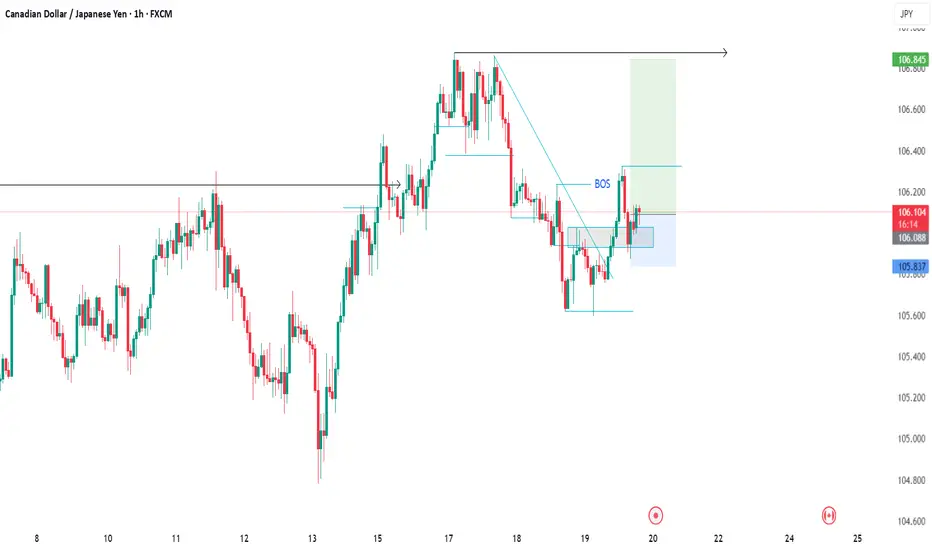
CadJpy Trade IdeaWith CJ failing to create bullish structures above the previous high and above a level of resistance we could potentially look for price to pullback and retest the level of resistance. We have a clean break of structure on smaller time frames indicating a possible range continuation. Looking for a 1:3rr if all goes well. We'll see what happens.
CADJPY trade ideas

#CADJPY:1700+ PIPS Swing Concept On The Way,Three Profit TargetsJPY initiated a bearish trend and anticipates a rapid reversal in all JPY pairs, such as CADJPY. We expect a significant swing move, potentially reaching 2000+ pips in the long term. Additionally, we have set three targets based on our analysis, which can aid in identifying potential trade opportunities. Good luck and trade safely.
Good luck and trade safely.
Thanks for your support! 😊
If you want to help us out, here are a few things you can do:
- Like our ideas
- Comment on our ideas
- Share our ideas
Team Setupsfx_
❤️🚀

CADJPY - Important Breakout !Hello Traders !
The CADJPY broke the resistance level (106.312 - 106.032).
This key level becomes new support!
So, I expect a bullish move🚀
______________
TARGET: 107.620🎯

121 SymmetryHey awesome traders 🔥 Hope the trading week is flowing well.
This is a clean Bullish 121 Symmetry setup on CADJPY.
After a sharp XA impulse, price printed a deep AB correction, then rallied to C — forming a perfect CD symmetry leg into the PRZ zone (D = 105.593).
🧠 Key Pattern Logic:
AB ≈ CD 121 Symmetry
PRZ between 78.6% & 100% projection
Strong rejection at D, supported by the SMA 200
🎯 Target Zones:
TP1 → 106.75 (38.2% retracement of CD)
TP2 → 107.46 (61.8% Fibonacci, full reversal extension)
Optional final stretch: 107.96 (78.6%)
Clean reaction from structure. Now we let the market validate continuation.
Stay disciplined, trade structure, not emotion.
— C. Dela | #TradeChartPatternsLikeThePros

CADJPY Bearish Reversal? Smart Money + Seasonal Confluence🧠 COT Sentiment
Speculators are heavily net short on CAD (–93K), while maintaining a strong net long position on JPY (+144K).
→ This positioning clearly favors JPY strength over CAD weakness.
Commercials are hedging JPY downside, but the dominant flow remains JPY bullish.
📅 Seasonal Patterns
Historically, June is weak for CAD (5Y, 10Y, 15Y averages all negative).
Meanwhile, JPY tends to strengthen in the second half of June.
→ Seasonality supports a bearish outlook on the pair.
📉 Technical Structure
Price has reacted precisely to the Fibonacci 0.705 retracement (106.23) and is showing signs of RSI divergence.
We are trading within a key supply zone between 106.70 and 108.30, which also aligns with a major resistance cluster and harmonic extension.
First target sits at 103.88, with potential extension to 101.20 if breakdown confirms.
🛢 Macro Catalyst
Oil remains under pressure.
CAD retail sales dropped significantly.
Risk-off sentiment (cautious Fed + geopolitical tensions) favors JPY as a safe haven.
📊 Retail Sentiment
62% of retail traders are short, but with an average entry at 108.49.
→ A break below 106 could trigger liquidation, fueling further downside.
🧩 Trade Setup
🔹 Entry zone: 106.70–107.00
🔸 SL: Above 108.40 (invalidates the bearish thesis)
🎯 TP1: 103.88 (S/R retest)
🎯 TP2: 101.20 (extended target on risk aversion)
🧭 Synthesis
Every angle aligns toward a potential bearish reversal on CAD/JPY:
✅ COT positioning
✅ Seasonality
✅ Macro narrative
✅ Technical confluence
✅ Retail sentiment trap

CADJPY Eyes Key Breakout Zone at 106.00CADJPY Eyes Key Breakout Zone at 106.00 🔍
CADJPY is approaching a well-tested resistance area, with price reacting multiple times to this zone in the past, as visible on the left side of the chart.
To confirm a potential bullish wave, the pair needs to decisively break above the 106.00 level.
Without a clean breakout, the setup may remain uncertain or take an alternative path.
🎯 Key Upside Targets: • 106.40 • 106.70
You may find more details in the chart!
Thank you and Good Luck!
❤️PS: Please support with a like or comment if you find this analysis useful for your trading day❤️
Disclosure: I am part of Trade Nation's Influencer program and receive a monthly fee for using their TradingView charts in my analysis.

CAD/JPY Forecast tight Sl
Price Structure & Key Levels
1. Resistance Zone:
- 106.000–106.122: Strong resistance cluster.
- 106.122 (swing high) and 106.000 (psychological barrier) are critical.
- Price rejection here suggests bearish pressure.
2. Immediate Support:
- 105.800–105.900: Near-term demand area.
- A break below 105.800 opens downside toward 105.600 (next support).
3. Critical Floor:
- 105.600: Major support.
- Loss of this level could accelerate declines toward 105.300–105.400.
Market Sentiment & Momentum
- Bearish Bias:
- Lower highs (106.122 → 106.000 → 105.900) indicate selling momentum.
- Price trading below 106.000 (psychological pivot) reinforces downside control.
Tactical Trade Setups
- Short Entries:
- Ideal near 106.000–106.122 (stop-loss above 106.200).
- Target: 105.600→ 105.300.
- Long Entries:
- Only if price holds 105.600 with reversal signals (e.g., bullish pin bar).
- Target: Scalping toward 105.900–106.000.
Always confirm with volume/RSI divergence and economic calendars. Trade safe! 🚀

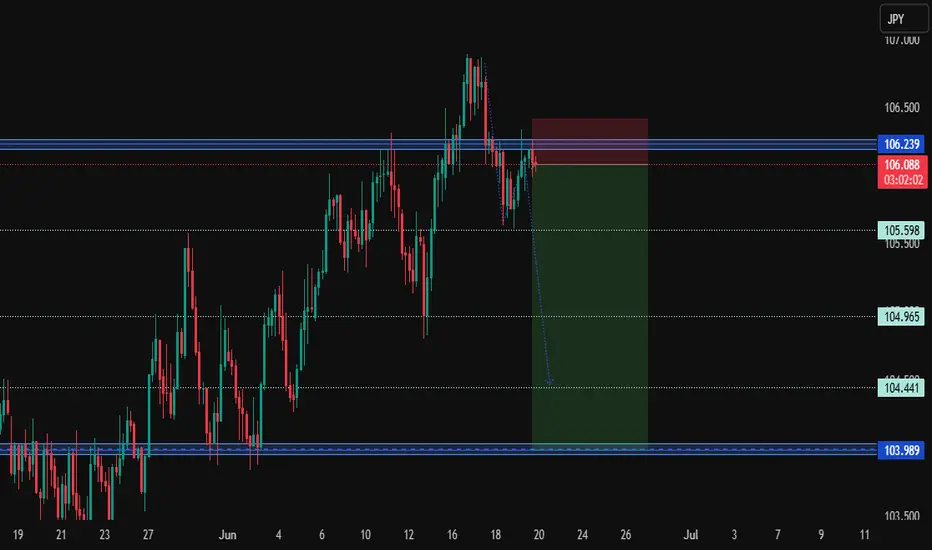
CADJPY Rejected from Resistance – Bearish Setup UnfoldingHey Traders,
CADJPY has reacted sharply to the 106.20 resistance zone, forming a potential lower high and setting the stage for a short-term bearish reversal. The price appears to be respecting the previous structure, and a drop toward the 105.00 and 104.00 regions may be on the cards if downside momentum builds.
Current Market Conditions:
Strong rejection at the 106.20–106.30 resistance level, which has historically acted as a supply zone.
Price is now hovering just below resistance and may confirm a bearish structure on lower timeframes.
Clean downside path if 105.60 is broken, potentially opening space down to 104.40, with extended downside support at 103.98.
Risk-reward ratio looks favorable from current levels if resistance holds.
Fundamental Analysis/Outlook:
The Canadian dollar has been under pressure as crude oil prices retreat, reducing demand for the CAD due to its strong correlation with oil. Additionally, the Bank of Canada’s recent rate guidance hinted at a more dovish stance compared to the Fed and BoJ, limiting CAD upside.
Meanwhile, JPY is drawing strength from rising demand for safe-haven assets amid ongoing geopolitical concerns and recent risk-off sentiment triggered by global growth worries. With central banks showing policy divergence and investor caution rising, CADJPY may face continued downward pressure.
Targets:
TP1: 105.60
TP2: 104.44
TP3: 103.98
Risk Management:
Stop-Loss: Above 106.40 to protect against bullish continuation
Confirm bearish price action (e.g., break and retest of intraday lows) before fully committing
Maintain proper lot size to manage drawdown across correlated yen pairs
Technical Outlook:
Price failing to sustain above key resistance
Lower high formation evident
Clean liquidity zones to the downside provide favorable structure for bearish continuation
Conclusion:
CADJPY looks poised for a potential reversal after rejecting major resistance. Watch for confirmations below 105.60 to increase conviction. The setup aligns with both technical and fundamental bias for yen strength.
Sign-off:
"In trading, the most dangerous words are 'it’s different this time.' Trust the chart, trust the process."
I would love to hear your thoughts in the comment section, and please hit boost and follow for more ideas. Thank you, and profitable trading to you all!
CADJPY BUYWe have transitioned from a downtrend to and up trend as shown by the transition for lower low and lower high to a higher high and potential higher low. we have pulled back to a key level for an entry.
CJ 4H LOOOK INTO BEARISH C-D HARMONIC SHARK LEGThis is an inside look into the short C-D set up. Same idea keep an eye out for the price action.
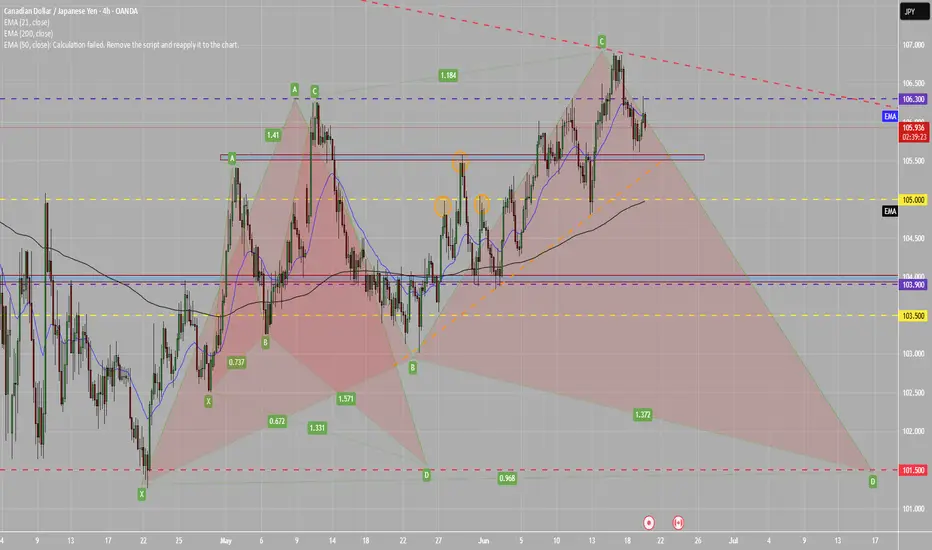
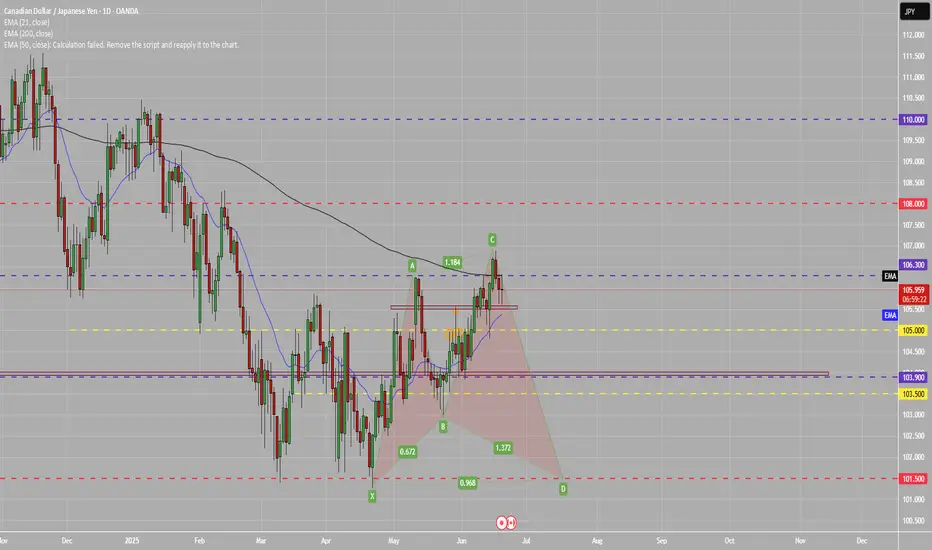
CJ BEARISH C-D SHARK HARMONIC PATTERN Price just tested strong resistance, due to a shark harmonic pattern forming and that overall daily trend is bearish market, will favor shorts. There will be an addtional 4h look into this. Price on daily TF should not trade above C level, as long as it holds I will look for shorts.
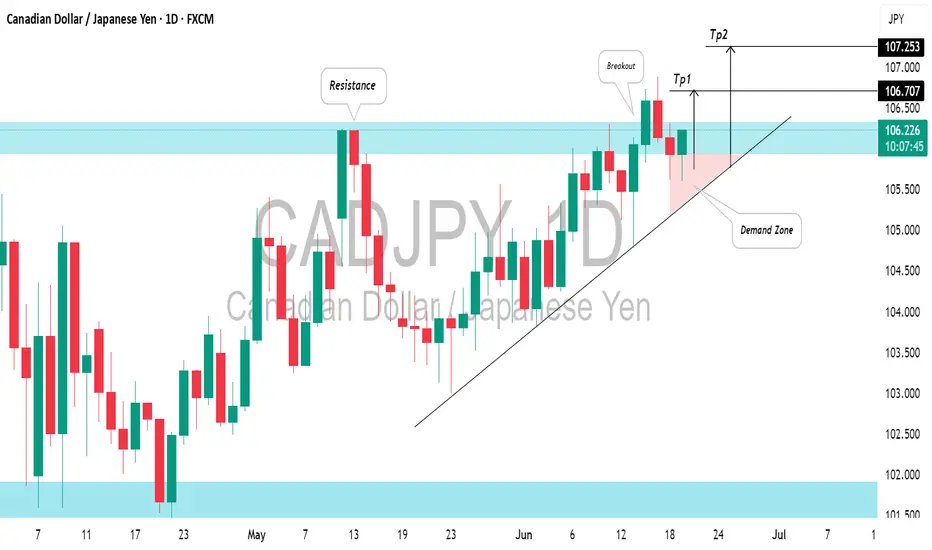
CADJPY: More Growth Ahead?!📈CADJPY broke above a key daily horizontal resistance yesterday.
The combination of this broken structure and an upward trend line creates a solid demand zone.
This area will be an ideal point to consider buying following a pullback, with the next target for buyers set at 107.27.
CADJPY-SELL strategy 6 hourly chart GANNThe pair is overbought, and we are trading around a resistance line 106.73. The indicators are not as yet negative, but considering the pattern, and also how much is has moved higher, the chances are seeing a decline in the coming sessions.
Strategy SELL @ 106.50-106.90 and take profit near 105.17 for now.

CAD_JPY WILL GROW|LONG|
✅CAD_JPY will soon hit
A rising support line and
As we are bullish biased
On the pair overall we will
Be expecting a local bullish
Rebound and a bullish move up
LONG🚀
✅Like and subscribe to never miss a new idea!✅
Disclosure: I am part of Trade Nation's Influencer program and receive a monthly fee for using their TradingView charts in my analysis.

Buy setup on CADJPYWill be traveling tomorrow morning so I decided to check out the cadjpy markets. I see price coming to a supply area & getting ready to move to the upside on the 4hr we are still looking bullish forming HH & HL's. We will wait for a break on our counter trend line as we scale in!
CADJPY POSSIBLE BUY OPPORTUNITY Price pulled back deeper and provided us with a possible buy opportunity. I anticipate more institutional longing from the current market price.

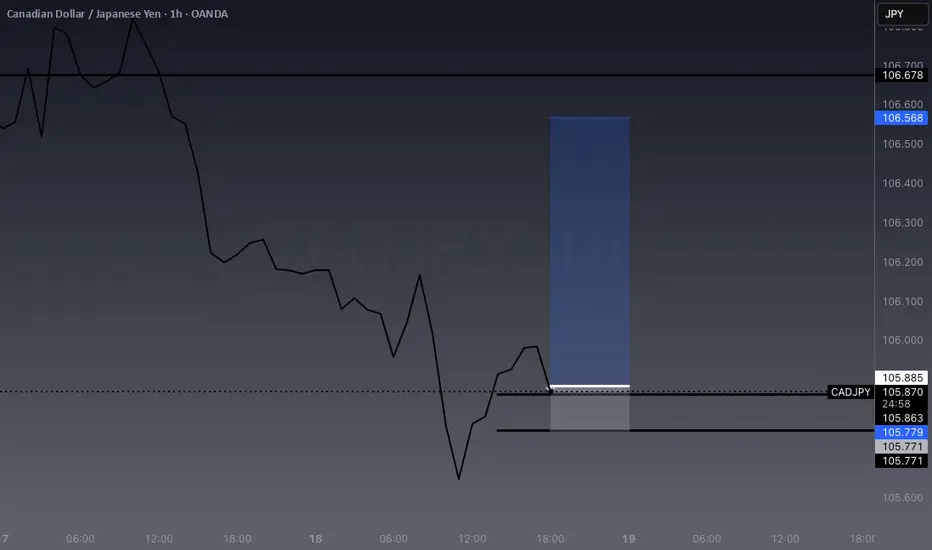
Short trade
📍 Pair: CADJPY
📅 Date: Tuesday, June 17, 2025
🕒 Time: 3:00 PM (NY Session PM)
⏱ Time Frame: 1 Hour
📈 Direction: Sell-side
📊 Trade Breakdown:
Entry Price 106.484
Profit Level 106.029 (0.43%)
Stop Loss 106.603 (0.11%)
Risk-Reward Ratio 3.82
🧠 Context / Trade Notes:
1H Structure-Based Entry:
Trade was observed on the 1-hour chart, and sell-side trade was undertaken due to a clear bearish market structure in play.

#CADJPY Trading for a long time while waiting for the Fed's data, which is going down, and for confirmation of the structure.

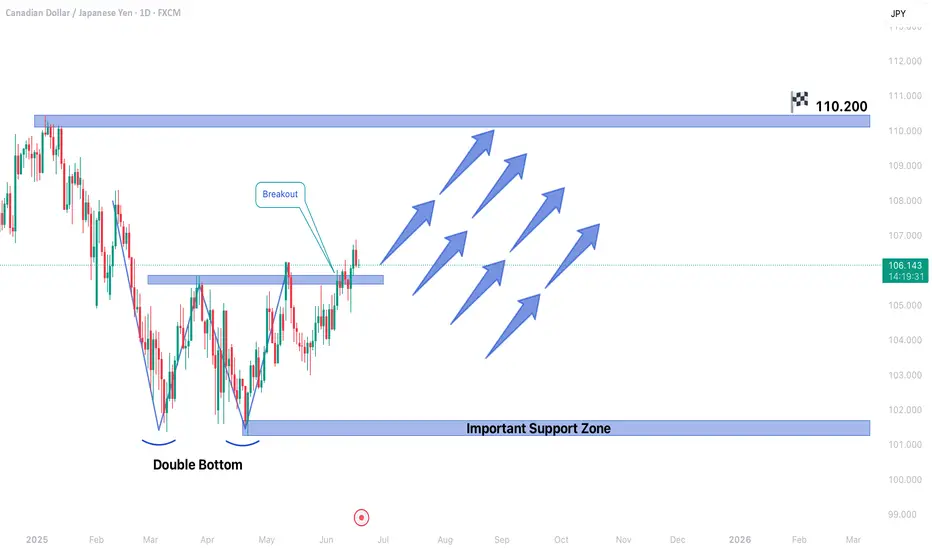
CADJPY FORMED DOUBLE BOTTOM STRUCTURECADJPY FORMED DOUBLE BOTTOM STRUCTURE AFTER A DOWN TREND.
Market is expected to Rise in upcoming trading sessions.
On lower side important support level is 101.300.
On higher side market may reach the targets of 110.200.
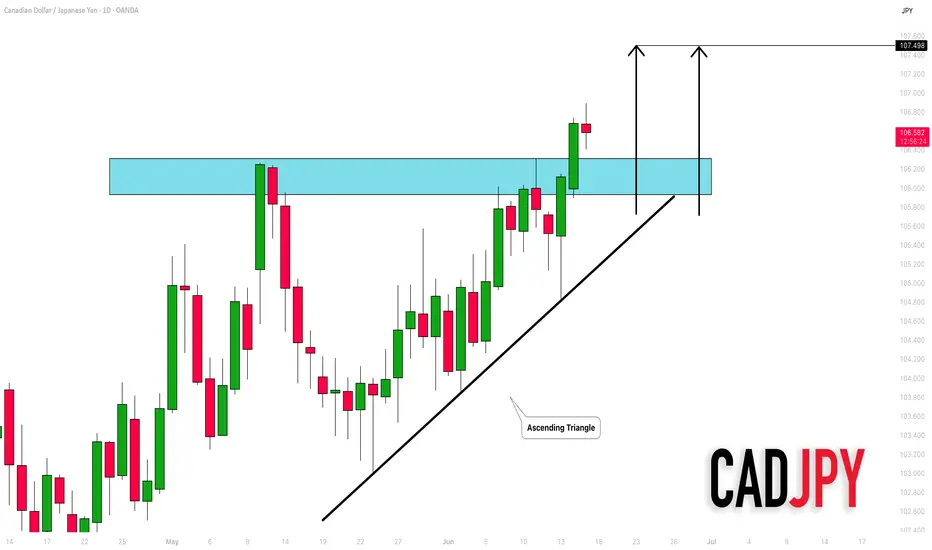
CADJPY: Important Breakout 🇨🇦🇯🇵
CADJPY successfully violated a resistance of an ascending triangle
pattern on a daily time frame.
The broken structure turns into a strong support now.
The pair may continue rising after a pullback.
Next goal - 107.5
❤️Please, support my work with like, thank you!❤️
SELL CADJPYA textbook head and shoulders pattern is at play here on CADJPY. Should price indeed react and reject this area, sell targets can be placed at 106,126.


CADJPY - New Breakout !Hello Traders !
After a huge bullish move,
The CADJPY broke the lower high (choch).
So, I expect a bullish move🚀
______________
TARGET: 106.165🎯
