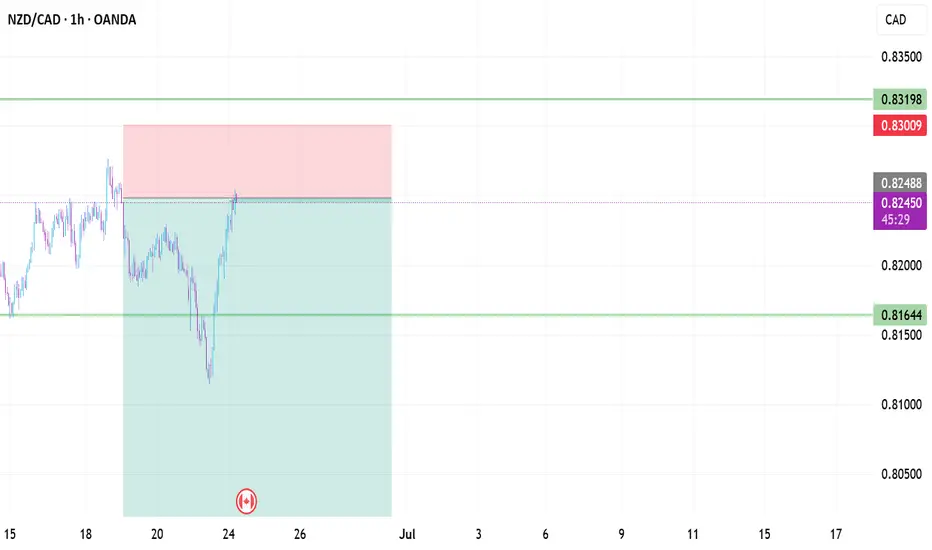
NZDCAD reached key resistance: Rebound to 0.82450 likelyPrice on NZDCAD has reached a pretty significant resistance level, that has been a key turning point in the past, with several strong reversals from the area. So naturally, I’ve been watching to see how price reacts here again.
We can already see early signs of rejection, so I will monitor this pair and I’ll be looking for short setups from the zone again.
🟥 My sell idea is based on the expectation that this resistance will hold. I would be targeting a move down toward the 0.82450 level , which I feel is a realistic target before any reversal could take from the gains, especially if price respects this structure continuously.
But if price breaks above and starts holding strong above the zone, then I’ll back off the bearish bias and reassess, and I’d consider the bearish idea invalidated, with potential for further upside.
Just sharing how I see the chart right now, not financial advice
CADNZD trade ideas

Is the NZDCAD uptrend still strong?NZDCAD has broken the trendline structure and is heading towards the resistance at 0.83500
0.827 has become a confluence of support and trendline. The pair is looking for more buying momentum at the support zone.
2 zones to watch are 0.827 and 0.823
If the 0.823 zone is broken, the uptrend is broken and the market turns to a downtrend. The target of the downtrend and the market finds the bottom of last month around 0.812.
Confirm SELL signal when breaking 0.823

NZD/CAD BEARISH BIAS RIGHT NOW| SHORT
NZD/CAD SIGNAL
Trade Direction: short
Entry Level: 0.827
Target Level: 0.818
Stop Loss: 0.832
RISK PROFILE
Risk level: medium
Suggested risk: 1%
Timeframe: 2h
Disclosure: I am part of Trade Nation's Influencer program and receive a monthly fee for using their TradingView charts in my analysis.
✅LIKE AND COMMENT MY IDEAS✅

NZD_CAD SHORT FROM RESISTANCE|
✅NZD_CAD will soon retest a key resistance level of 0.8320
So I think that the pair will make a pullback
And go down to retest the demand level below at 0.8267
SHORT🔥
✅Like and subscribe to never miss a new idea!✅
Disclosure: I am part of Trade Nation's Influencer program and receive a monthly fee for using their TradingView charts in my analysis.

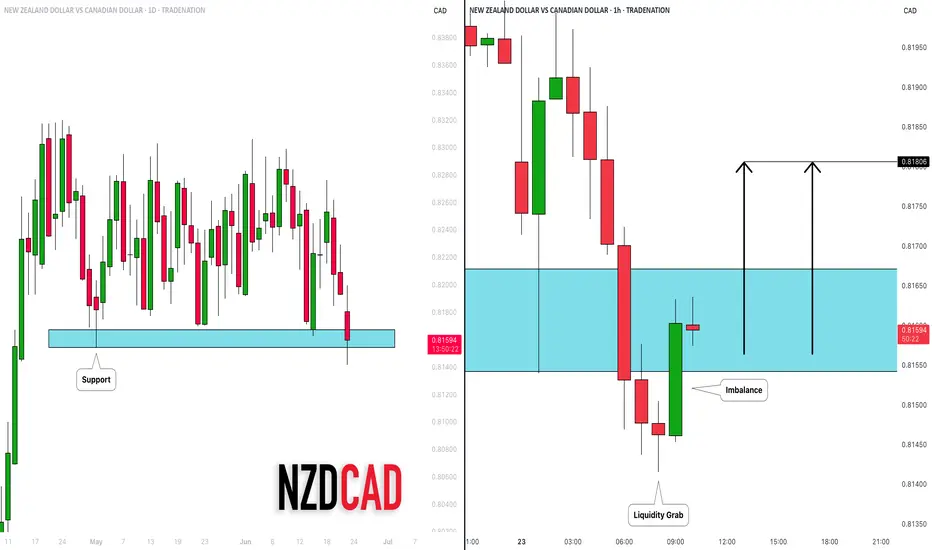
NZDCAD: Confirmed Bearish Trap?! 🇳🇿🇨🇦
There is a high chance that NZDCAD will bounce
after a false violation of a significant daily support cluster.
A formation of a bullish imbalance candle on an hourly time frame
leaves a strong bullish clue.
Goal - 0.818
❤️Please, support my work with like, thank you!❤️
I am part of Trade Nation's Influencer program and receive a monthly fee for using their TradingView charts in my analysis.
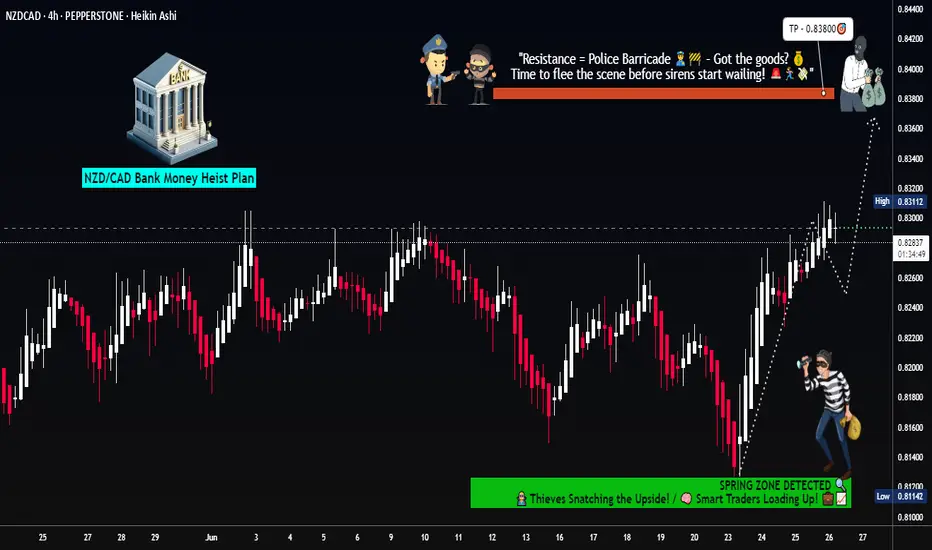
BANK JOB: NZD/CAD LOOT GRAB (Swing Heist Plan) 🏦 "Market Heist: NZD/CAD Long Before Trap Closes! 💰
🦹♂️ Attention All Market Thieves!
(Hola! Oi! Salut! Hallo! Ahlan!) 🎭💸
🔥 Thief Trading Intel Confirmed!
The NZD/CAD "Kiwi vs Loonie" vault is primed for cracking! Our bullish heist blueprint targets the red zone - but we escape before the bears set their trap!
🔓 ENTRY: CRACKING THE SAFE
"Resistance wall at 0.83150 is the vault door!"
✔ Option 1: Buy Stop above resistance (breakout play)
✔ Option 2: Buy Limit at swing low (15m/30m pullback)
🔔 Pro Tip: Set breakout alerts - don't miss the heist!
🚨 STOP LOSS: POLICE EVASION PLAN
📍 Thief SL: 0.82200 (below 4H swing low & MA)
⚠️ Warning: No SL before breakout! You'll trigger the alarms!
💎 TARGET: ESCAPE WITH THE LOOT
🎯 Primary Take: 0.84400
💰 Scalpers: Long-only! Trail your SL like a getaway car!
📊 MARKET CONDITIONS
🐂 Bullish Trend (but overbought - time it right!)
🔍 Key Intel Needed: COT reports, macro data, sentiment
🌐 Full Briefing: Check bi0 linkss 👉🔗
🚦 RISK MANAGEMENT PROTOCOLS
• ❌ Avoid news event heists
• 🔒 Always use trailing stops
• 💣 Position size = explosive potential
🦾 SUPPORT THE SYNDICATE
💥 SMASH THAT BOOST BUTTON!
💬 Comment your heist results below!
🔔 Next job coming soon - stay tuned!
🤑 Remember thieves: Book profits before the cops arrive!

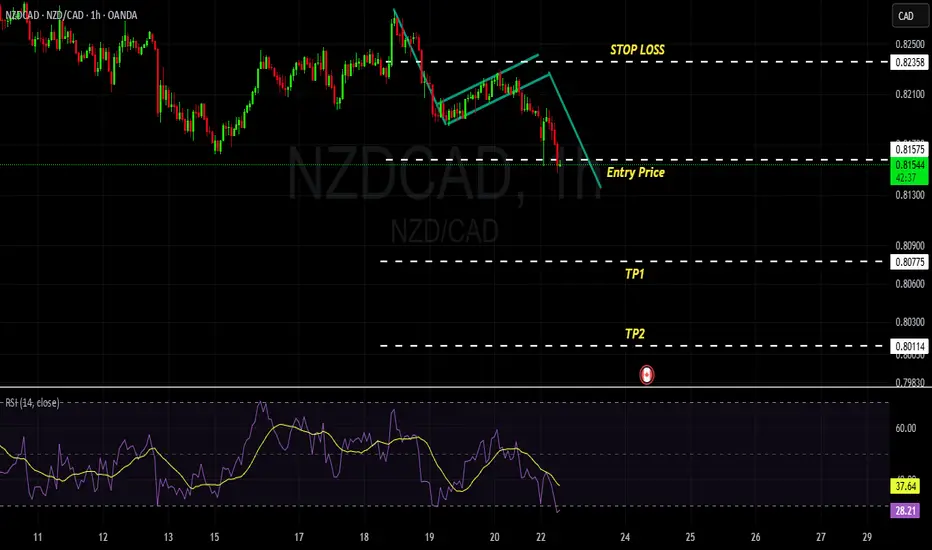
NZDCAD BearishMarket is making series of LH and LL, it has no divergence and we anticipate the market to reach TP1 and TP2 in continuation of Bear Trend. Market has broken the resistance level of 0.81613 with momentum candle which is a good indication of bearish trend.
NZDCAD SELL TRADE PLANNZD/CAD – 18 June 2025
📋 PLAN OVERVIEW
Parameter Details
Type Swing Short
Direction 🔻 Bearish
Status ✅ Active Setup Forming
R:R 1:3 (Base Targeted)
Confidence ⭐⭐⭐⭐ (88%) – Clean HTF Compression Structure
📈 MARKET BIAS & TRADE TYPE
Price is operating within a highly coiled D1/H4 compression range, after a clean rejection off a prior supply shelf at 0.8245–0.8260. The current move down is structurally aligned with a larger HTF BOS event from late May, where price failed to sustain above 0.8300 and dropped impulsively.
📌 Trade Type: Continuation (Supply Rejection)
📌 Bias Origin: D1 CHoCH + H4 OB rejection + Minor FVG fill
🔰 CONFIDENCE FACTORS
Component Weight Score
HTF Structure (D1 CHoCH, H4 OB) 35% ✅
Liquidity Logic (Equal Highs, Wick Sweeps) 25% ✅
Macro/Sentiment (NZD Weak, CAD Neutral) 25% ⚠️ Mixed
Volume & Reaction History 15% ✅
Total Confidence Score: 88% ✅
📍 ENTRY ZONES
Zone Range Type Confidence
🟦 Zone 1 0.8238–0.8258 H4 OB (Refined) ⭐⭐⭐⭐
🟧 Zone 2 0.8285–0.8300 D1 FVG Tap + Inducement ⭐⭐⭐
📌 Price currently below Zone 1 → Awaiting retrace or rejection wick for tactical entry.
📌 Both zones are supply-driven and lie above recent BOS.
❗ STOP LOSS LOGIC
* Zone 1 SL: Above 0.8265 (Above OB + wick)
* Zone 2 SL: Above 0.8305 (Breaks structure + clears inducement)
🎯 TAKE PROFIT LEVELS
TP Level Reason
TP1 0.8180 Intra-day LTF structure shelf
TP2 0.8145 D1 reaction zone & minor support
TP3 0.8100 HTF liquidity pocket / imbalance draw
🧠 TRADE MANAGEMENT LOGIC
* Entry 1/2 if Zone 1 taps with H1 engulfing
* Entry 1/2 if Zone 2 taps and confirms with volume/sweep
* SL to breakeven on TP1
* Reduce size at TP2, trail remainder with H1 fractal levels
* Fully exit if HTF BOS against plan occurs below TP1
⚠️ ENTRY CONFIRMATION CONDITIONS
Confirmation Required
H1 Bearish Engulfing ✅
Volume Spike / Sweep Wick ✅
NY or London Session Trigger ✅
📌 Market orders allowed only if all 3 are met after OB tap
⏳ TRADE VALIDITY WINDOW
Zone Duration
Zone 1 Valid for 18–24h (London–NY overlap ideal)
Zone 2 Valid up to 48h
❌ INVALIDATION
* H1 close above 0.8305
* Bullish structure flip on H4
🌐 MACRO SNAPSHOT
Asset Condition
NZD Weak – no supportive macro/fundamentals
CAD Oil-neutral – no major directional catalyst
Risk Sentiment Risk-off supportive of CAD
Macro Alignment: Partial ✅ (supports downside bias)
✅ FINAL TRADE SUMMARY
Entry SL TP1 / TP2 / TP3 R:R Status
0.8248 0.8265 0.8180 / 0.8145 / 0.8100 ~1:3

NZDCAD SELLSA bullish flag is currently in formation here. Price should visit support trend line once more before moving higher. Sell now towards 0,82

NZDCAD Monthly increaseThe New Zealand dollar (NZD) is showing strong potential for long-term appreciation against the Canadian dollar (CAD). Fundamentally, New Zealand's economy is benefiting from the RBNZ's cautious tightening stance and strong export performance in dairy and agriculture. Meanwhile, Canada faces reduced rate hike expectations from the BOC due to softer energy and housing sectors. Market sentiment favors higher-yielding commodity currencies like NZD, especially as risk appetite improves. Technically, NZD/CAD is forming higher lows on the monthly chart, signaling a bullish bias, with a potential breakout from its long-term range confirming further upside. Any short-term pullbacks could present buying opportunities for sustained gains.
Sasha Charkhchian

GBPCAD 10 weeks of Consolidation/buildup ready for breakout ?GBPCAD has nearly 10 weeks consolidated at the box and each week got rejected from the resistance. The wig of the candle can tell you the story of rejection and now last week this wig has been overcome by strong bullish solid candle and high chances of breakout possible. let us see...

NZDCAD LONGMarket structure bullish on HTFs DW
Entry at Daily and Weekly AOi
Weekly Rejection at AOi
Weekly EMA retest
Previous Weekly Structure Point
Daily Rejection At AOi
Previous Daily Structure Point
Around Psychological Level 0.82500
H4 Candlestick rejection
Levels 4.08
Entry 105%
REMEMBER : Trading is a Game Of Probability
: Manage Your Risk
: Be Patient
: Every Moment Is Unique
: Rinse, Wash, Repeat!
: Christ is King.

This currency is likely to go down.It is moving within a very strong support resistance zone so we can expect it to sell again.

SHORT ON NZD/CADNzd/cad has given us a double top with a confirmed change of character (choc)
to the downside.
I am waiting for price to reach into supply sweeping liquidity before taking a sell to the next demand level looking to catch 100-150 pips.

NZD/CAD THIEF TRADING ALERT: Bullish Loot Ahead – Are You In?🔥 NZD/CAD Heist: Bullish Loot Ahead! 🏴☠️💰
🌟 Greetings, Market Pirates! 🌟
Hola! Oi! Bonjour! Hallo! Marhaba! 🚀
💸 The Master Plan:
Based on Thief Trading tactics (technical + fundamental analysis), we’re plotting a bullish heist on NZD/CAD ("Kiwi vs Loonie"). The vault is open—time to swipe the loot!
📈 Entry (Long Only):
Buy Limit Orders preferred (15-30min TF for pullbacks).
Aggressive? Enter anytime—just stick to the strategy!
🛑 Stop Loss (Protect Your Loot!):
Nearest swing low (4H TF) → 0.81500 (adjust based on risk & lot size).
Scalpers? Use trailing SL to lock profits!
🎯 Take Profit (Escape Before Cops Arrive!):
Primary Target: 0.83800 (or exit earlier if momentum fades).
⚠️ Warning (High Risk!):
Overbought? Yes. Bear traps? Likely.
Consolidation zone → trend reversal risk!
News releases? Avoid new trades—hedge or trail stops!
📊 Market Context:
Neutral trend (bullish bias forming 🐂).
Check: COT reports, macro trends, sentiment & intermarket signals BEFORE executing! 🔍 (go ahead to read 🔗🌏).
💥 Boost This Idea!
Hit 👍 LIKE & 🔔 FOLLOW to support the Thief Trading crew! More heists coming soon—stay tuned! 🚀
🚨 Reminder: Trade responsibly. This is NOT financial advice—just a risky, high-reward play. Manage your risk or get rekt!
NZDCAD SHORT Market structure bearish on HTFs DH
Entry at both Weekly and Daily AOi
Weekly Rejection at AOi
Weekly EMA Retest
Daily Rejection at AOi
Daily EMA retest
Previous Structure point Daily
Around Psychological Level 0.82500
H4 EMA retest
H4 Candlestick rejection
Rejection from Previous structure
Levels 4.26
Entry 110%
REMEMBER : Trading is a Game Of Probability
: Manage Your Risk
: Be Patient
: Every Moment Is Unique
: Rinse, Wash, Repeat!
: Christ is King.

NZD/CADSince April, NZD/CAD has been consolidating within a defined range between 0.83198 and 0.81597. Recently, price has broken below the 0.81597 support level, indicating a potential shift toward a bearish trend. I am currently monitoring price action for confirmation through bearish engulfing candles or other reversal patterns before considering a short position.
While this setup appears promising, I remain cautious of potential false breakouts and will ensure continued bearish momentum before entering. I will be observing this pair closely over the coming sessions.
"Patience is not the ability to wait, but how you act while you're waiting." — Joyce Meyer
Trade Idea: Sell NZD/CAD (Short-Term Pressure)### **💡 Why Sell NZD/CAD?**
**🇳🇿 NZD – New Zealand Dollar:**
* **Global risk-off + weaker China demand**
→ *🌍📉 NZD struggles when investors avoid risk and China slows — both are happening.*
* **RBNZ cut rates to 3.25% and may cut again**
→ *🏦📉 A dovish central bank puts downward pressure on the Kiwi.*
* **June 23 GDP could move the market**
→ *📅 Until then, expectations are low — and that weighs on NZD.*
* **Dairy prices + China still weak**
→ *🐄🇨🇳 These are key parts of NZ’s economy — and both are underperforming.*
* **Sentiment: Bearish**
→ *📊 Traders are positioned short — not much appetite to buy Kiwi right now.*
---
**🇨🇦 CAD – Canadian Dollar:**
* **Oil above \$80 helps CAD**
→ *🛢️ Canada’s economy benefits from higher oil — that’s a natural support for the loonie.*
* **BoC held rates at 2.75%, not rushing to cut**
→ *⚖️ Slightly dovish, but still firmer than NZ’s approach.*
* **Core inflation still above 3%**
→ *🔥 Keeps the BoC cautious — good for CAD strength.*
* **Retail sales data coming soon**
→ *🧾 A strong print could give CAD a further push.*
* **Sentiment: Neutral to bullish**
→ *📈 Among commodity currencies, CAD is holding up the best right now.*
---
### **🔍 Outlook:**
The **fundamentals clearly favor CAD over NZD** — stronger inflation, oil support, and no aggressive easing. Unless NZ GDP surprises big on June 23, this pair likely continues to drift lower.
---
**📌 Note:**
> *“Still one of the cleanest cross plays — NZD weak, CAD stable. Slow but steady sell setup as long as the story holds.”*

NZDCAD - a few technical things togetherFib's retracement level of 50.00% will probably give the trend some strong upward impulse,
After that, this "Bull Flag" will come into play, and the price will go up a little bit higher,
The next step is to enter the price into the current "Most meaningful" channel...
Our take profit is: 0.82550. (Near +24 pips from current price).

They Had to Take Before They Could GivePrice swept below the previous day’s low (PDL), triggered liquidity, and gave us a clean BOS. This isn’t random, it’s intention.
Now, we wait to see if the market delivers the follow-through into that FVG below.
Your job isn’t to chase price. Your job is to recognize its story.

NZDCAD Is Going Down! Sell!
Take a look at our analysis for NZDCAD.
Time Frame: 1h
Current Trend: Bearish
Sentiment: Overbought (based on 7-period RSI)
Forecast: Bearish
The market is testing a major horizontal structure 0.825.
Taking into consideration the structure & trend analysis, I believe that the market will reach 0.822 level soon.
P.S
Overbought describes a period of time where there has been a significant and consistent upward move in price over a period of time without much pullback.
Disclosure: I am part of Trade Nation's Influencer program and receive a monthly fee for using their TradingView charts in my analysis.
Like and subscribe and comment my ideas if you enjoy them!

Cadnzd Am pretty much interested in this trade am waiting for a break and a retest on the 4hrs time frame then we buy more
NZD_CAD REBOUND AHEAD|LONG|
✅NZD_CAD is set to retest a
Strong support level below at 0.8160
After trading in a local downtrend for some time
Which makes a bullish rebound a likely scenario
With the target being a local resistance above at 0.8182
LONG🚀
✅Like and subscribe to never miss a new idea!✅
Disclosure: I am part of Trade Nation's Influencer program and receive a monthly fee for using their TradingView charts in my analysis.
