Bearish drop?NZD/CAD has reacted off the pivot which has been identified as a pullback support and could drop to the 1st support level that acts as an overlap support.
Pivot: 0.84367
1st Support: 0.83700
1st Resistance: 0.84969
Risk Warning:
Trading Forex and CFDs carries a high level of risk to your capital and you should only trade with money you can afford to lose. Trading Forex and CFDs may not be suitable for all investors, so please ensure that you fully understand the risks involved and seek independent advice if necessary.
Disclaimer:
The above opinions given constitute general market commentary, and do not constitute the opinion or advice of IC Markets or any form of personal or investment advice.
Any opinions, news, research, analyses, prices, other information, or links to third-party sites contained on this website are provided on an "as-is" basis, are intended only to be informative, is not an advice nor a recommendation, nor research, or a record of our trading prices, or an offer of, or solicitation for a transaction in any financial instrument and thus should not be treated as such. The information provided does not involve any specific investment objectives, financial situation and needs of any specific person who may receive it. Please be aware, that past performance is not a reliable indicator of future performance and/or results. Past Performance or Forward-looking scenarios based upon the reasonable beliefs of the third-party provider are not a guarantee of future performance. Actual results may differ materially from those anticipated in forward-looking or past performance statements. IC Markets makes no representation or warranty and assumes no liability as to the accuracy or completeness of the information provided, nor any loss arising from any investment based on a recommendation, forecast or any information supplied by any third-party.
CADNZD trade ideas

possibility of reaction...Hello friends.
According to the drawn trend line and the reaction we had,
I expect to rise up to the specified range.
what is your opinion?
Good luck.
# Let's look simply

NZDCAD in an Ascending ChannelNZDCAD in an Ascending Channel
Technical Analysis:
NZDCAD is moving inside a daily "Ascending Channel"
From the chart, we can see that the price respected the support zone of the pattern several times.
Currently, the price is testing 0.8150 and the support line can attract more buyers thus rising the bullish momentum.
However, it's a bit early to say that it will rise but we can watch for reversal signs near to
the current zone.
You may find more details in the chart!
Thank you and Good Luck!
❤️PS: Please support with a like or comment if you find this analysis useful for your trading day❤️

Potential bullish reversal?NZD/CAD is falling towards the support level which is an overlap support that aligns with the 61.8% Fibonacci retracement and could reverse from this level to our take profit.
Entry: 0.84210
Why we lik eit:
There is an overlap support level that aligns with the 61.8% Fibonacci retracement.
Stop loss: 0.83582
Why we like it:
There is a pullback support level that is slightly below the 78.6% Fibonacci retracement.
Take profit: 0.84962
Why we like it:
There is an overlap resistance level.
Enjoying your TradingView experience? Review us!
Please be advised that the information presented on TradingView is provided to Vantage (‘Vantage Global Limited’, ‘we’) by a third-party provider (‘Everest Fortune Group’). Please be reminded that you are solely responsible for the trading decisions on your account. There is a very high degree of risk involved in trading. Any information and/or content is intended entirely for research, educational and informational purposes only and does not constitute investment or consultation advice or investment strategy. The information is not tailored to the investment needs of any specific person and therefore does not involve a consideration of any of the investment objectives, financial situation or needs of any viewer that may receive it. Kindly also note that past performance is not a reliable indicator of future results. Actual results may differ materially from those anticipated in forward-looking or past performance statements. We assume no liability as to the accuracy or completeness of any of the information and/or content provided herein and the Company cannot be held responsible for any omission, mistake nor for any loss or damage including without limitation to any loss of profit which may arise from reliance on any information supplied by Everest Fortune Group.

NZDCAD BULLSOn the Weekly and Daily chart price is moving downwards. Price retrace the 61.8% Fibonacci level on the 4 hour chart. FVG filled. Wait for a reversal candlestick.

NZDCAD BULLSRetracement to ward the low that created a new HH and broke structure. Current demand zone is the POI... Currently waiting for price to pull-back to the demand zone for buy entries!

Nzdcad sells Selling NC again break and retest of this trendline, sending her back to the downside tp 0.82830

NZDCADNZDCAD is in strong bullish trend.
As the market is consistently printing new HHs and HLs.
currently the market is retracing a bit after last HH, which is also the 50% Fib retracement level and local support as well. if the market successfully sustain this buying confluence the next leg up could go for new HH.
What you guys think of this idea?

Bullish bounce?NZD/CAD is falling towards the pivot which has been identified as a pullback support and could bounce to the 1st resistance which acts as a pullback resistance.
Pivot: 0.84367
1st Support: 0.83708
1st Resistance: 0.85278
Risk Warning:
Trading Forex and CFDs carries a high level of risk to your capital and you should only trade with money you can afford to lose. Trading Forex and CFDs may not be suitable for all investors, so please ensure that you fully understand the risks involved and seek independent advice if necessary.
Disclaimer:
The above opinions given constitute general market commentary, and do not constitute the opinion or advice of IC Markets or any form of personal or investment advice.
Any opinions, news, research, analyses, prices, other information, or links to third-party sites contained on this website are provided on an "as-is" basis, are intended only to be informative, is not an advice nor a recommendation, nor research, or a record of our trading prices, or an offer of, or solicitation for a transaction in any financial instrument and thus should not be treated as such. The information provided does not involve any specific investment objectives, financial situation and needs of any specific person who may receive it. Please be aware, that past performance is not a reliable indicator of future performance and/or results. Past Performance or Forward-looking scenarios based upon the reasonable beliefs of the third-party provider are not a guarantee of future performance. Actual results may differ materially from those anticipated in forward-looking or past performance statements. IC Markets makes no representation or warranty and assumes no liability as to the accuracy or completeness of the information provided, nor any loss arising from any investment based on a recommendation, forecast or any information supplied by any third-party.


NZDCAD LONGMarket structure Bullish on HTFs 30
Entry At Daily AOi
Weekly candle stick Rejection
Strong bullish momentum
Daily Candlestick Rejection
Previous Structure point D
Round Psychological Level 0.85000
H4 Candlestick rejection
Rejection from Previous structure
Levels 7.1
Entry 90% A
REMEMBER : Trading is a Game Of Probability
: Manage Your Risk
: Be Patient
: Every Moment Is Unique
: Rinse, Wash, Repeat!
: Christ is King

NZDCAD TRADE RECAP AND KEY LESSONSI shared this forecast today, and I hope most of you who follow my forecast got into this because price gave us nice entry and it was exact at the same area we forecasted! Watch this video to the end to see how I took it and the reasons of taking it!

NZDCAD - A Bull Trap after a Bear Trap?NZDCAD continues its bullish run and is entering into the Parabolic trend zone.
There have been signs of bearish momentum divergences on the indicators which has led people into shorting prematurely and being caught in a bear trap.
Many short traders are watching in anticipation of a violent move to compensate for the continued fake-outs. It's proximity to the last pivot high could result in another move with either a bull trap or a breakout. Patience needed.

NZD CADTHIS IS MY SETUP FOR NZD CAD
I use Fibonacci to get these extreme points and my preferred one is 75% retracement, with a risk-reward of 1:3.
Trade carefully
This is not financial advice, DYOR.

NzdCad Trade IdeaNc at the moment is extremely bullish at the moment. NC longs are definitely valid here as long price can respect the retest and flip smaller time frame bearish structures to bullish to then be in sync with the higher time frame trend. If price comes back down the current level its at then we can expect price to drop below 85000 and possibly tap 84300 again.
Sell NZDCADSell limit order place at fib retracement level, Nzdcad making a bearish divergence at 1h timeframe and also break their last Higher Low.

NZDCAD short movePrice is currently rising towards our resistance level, any bearish reaction cloud leads to downside movement in price.

NZD/CAD Bearish Reversal: Break of Higher LowNZD/CAD has broken its higher low, and the bearish divergence suggests a potential bearish reversal.

@NZDCAD SELLFX:NZDCAD
NZD CAD SELL
ENTRY Area = 0.85600 - 0.85400
TP = 0.85000
SL = 0.86150
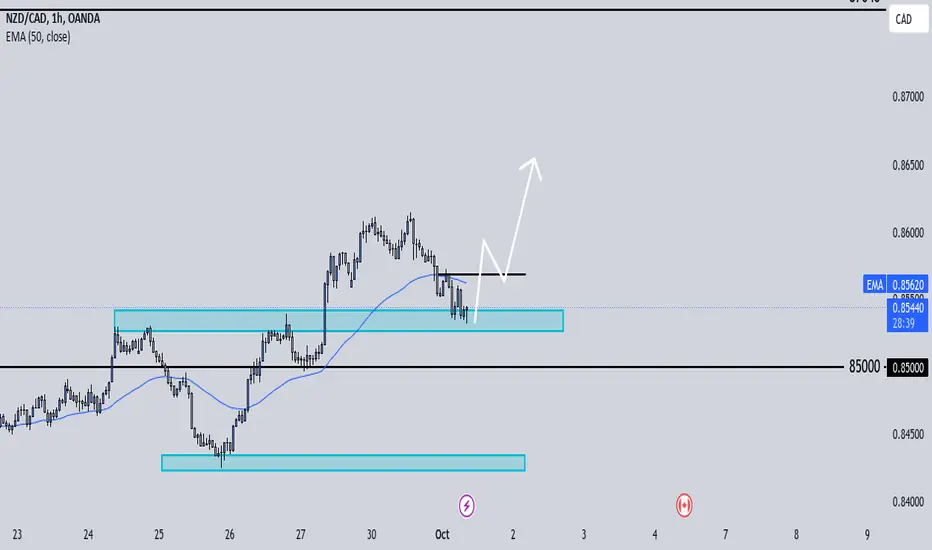
NZDCAD break trendline and will hit 0.85000 as a demand Area

NZDCAD FORECASTThis pair seems to have bigger potentials on the coming days, what we need to do is just to stay patient and wait, because in these areas most of people are tagged in and out, we need to wait for the confirmation as the market communicates every time!
I just appreciate you for taking time to follow my contents! Let's grow together

Bullish bounce?NZD/CAD is falling towards the support level which is a pullback support that slightly below the 38.2% Fibonacci retracement and could bounce from this level to our take profit.
Entry: 0.85288
Why we like it:
There is a pullback support level which is slightly below the 38.2% Fibonacci retracement.
Stop loss: 0.84756
Why we like it:
There is a pullback support level.
Take profit: 0.86072
Why we like it:
There is a pullback resistance level.
Enjoying your TradingView experience? Review us!
Please be advised that the information presented on TradingView is provided to Vantage (‘Vantage Global Limited’, ‘we’) by a third-party provider (‘Everest Fortune Group’). Please be reminded that you are solely responsible for the trading decisions on your account. There is a very high degree of risk involved in trading. Any information and/or content is intended entirely for research, educational and informational purposes only and does not constitute investment or consultation advice or investment strategy. The information is not tailored to the investment needs of any specific person and therefore does not involve a consideration of any of the investment objectives, financial situation or needs of any viewer that may receive it. Kindly also note that past performance is not a reliable indicator of future results. Actual results may differ materially from those anticipated in forward-looking or past performance statements. We assume no liability as to the accuracy or completeness of any of the information and/or content provided herein and the Company cannot be held responsible for any omission, mistake nor for any loss or damage including without limitation to any loss of profit which may arise from reliance on any information supplied by Everest Fortune Group.

NZDCAD - Long from bullish order block !! Hello traders!
‼️ This is my perspective on NZDCAD.
Technical analysis: Here we are in a bullish market structure from 4H timeframe perspective, so I look for a long. My point of interest is price to fill the imbalance lower and then to reject from bullish OB.
Like, comment and subscribe to be in touch with my content!

NZDCAD idea pt1This weak is looking even slower than last week but last week we still managed to catch a move so let's see if we get the same thing this week. All timeframes in sync need price to get the that zone and round number and hopefully hold to create new highs ⚐
