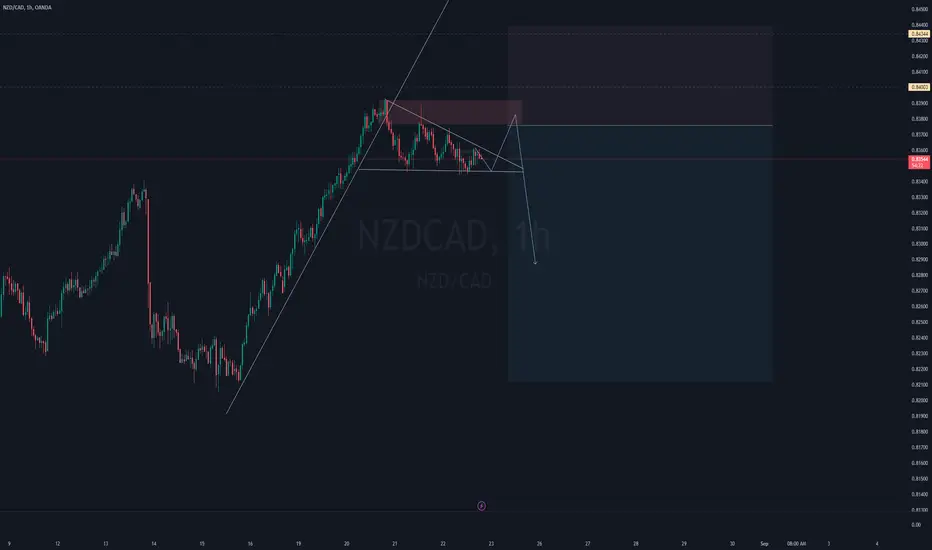
NZD/CAD Short idea Bearish flag pattern
4h impulse -correction =impulse
side away bearish rectangle pattern
CADNZD trade ideas

NZDCAD Bearish Reversal OpportunityNZDCAD is near a key resistance zone. A potential Bearish reversal may occur if the price action breaks the previous Higher Low.
Bears may eventually face a strong support zone around 0.814 till 0.806. If this zone breaks, chances of TP2 will increase.
Trade Plan:
4Hr Time Frame
Entry @ 0.83340
Stop Loss @ 0.84350
TP1 @ 0.8233
TP2 @ 0.8132
No. of Trades: 2
Move Stop Loss to Break even if TP1 hits.

NZDCAD still going up. Might want to get in. NZDCAD has about 70-80 pips to go before price hit major zone.

It's NZDCAD 15 Min time frameMaking some small cash waiting for the market to respect my setup so that I can go long with it🤝

NZD/CAD For Bullishyou can go long now
or
wait for entry point and then go long
- general trend is up trend
- price break current resistance and will retest it
have fun :)

NZDCADHi All... I see possible sell from 4hr Bearish Order Block. Also monitoring FIB @ 0.618.
Coming to 1 hr I wait for confirmations either through Candle Stick or Order Block.
Always take profit at key areas - OB/BB/Candle Wicks and set BE
Good luck :)

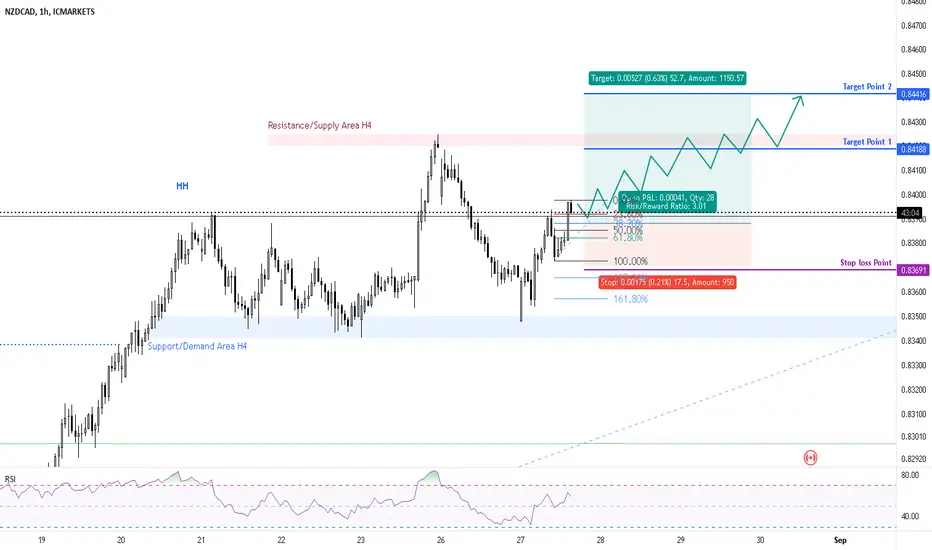
Bullish rise?NZD/CAD has reacted off the pivot which has been identified as an overlap support and could bounce to the 1st resistance.
Pivot: 0.83460
1st Support: 0.829488
1st Resistance: 0.84189
Risk Warning:
Trading Forex and CFDs carries a high level of risk to your capital and you should only trade with money you can afford to lose. Trading Forex and CFDs may not be suitable for all investors, so please ensure that you fully understand the risks involved and seek independent advice if necessary.
Disclaimer:
The above opinions given constitute general market commentary, and do not constitute the opinion or advice of IC Markets or any form of personal or investment advice.
Any opinions, news, research, analyses, prices, other information, or links to third-party sites contained on this website are provided on an "as-is" basis, are intended only to be informative, is not an advice nor a recommendation, nor research, or a record of our trading prices, or an offer of, or solicitation for a transaction in any financial instrument and thus should not be treated as such. The information provided does not involve any specific investment objectives, financial situation and needs of any specific person who may receive it. Please be aware, that past performance is not a reliable indicator of future performance and/or results. Past Performance or Forward-looking scenarios based upon the reasonable beliefs of the third-party provider are not a guarantee of future performance. Actual results may differ materially from those anticipated in forward-looking or past performance statements. IC Markets makes no representation or warranty and assumes no liability as to the accuracy or completeness of the information provided, nor any loss arising from any investment based on a recommendation, forecast or any information supplied by any third-party.

NZDCAD 26/08/2024Weekly:
-Inverse H&S pattern.
-IC acting as support.
Daily:
-Bullish M pattern.
4H:
-Bullish M pattern.
-IC.

NZDCAD LongMarket structure Bullish on HTFs 30
Entry at Weekly and Daily AOi
Weekly rejection at AOi
Daily Rejection at AOi
Previous Daily Structure Point
H4 Candlestick rejection
Levels 5.56
Entry 90%
REMEMBER : Trading is a Game Of Probability
: Manage Your Risk
: Be Patient
: Every Moment Is Unique
: Rinse, Wash, Repeat!
: Christ is King

NZDCAD bullish expectactionsCanadian dollar expected to be weaker due to strengthening of New Zealand dollar, this cause the canadian dollar to be driven, may be due to the unemployment rate remained stable at 5.5% during this period,
I expect to go long at the nearest liquidity engineering

NZDCAD 1 HR CHARTHi everyone, 1hour price action, OB is valid,
First target - 0.84114
2nd target - 0.84200

Nzdcad buy analysisThis is how I analyse my chart.
And I'm waiting for that third touch so that I can go long with it

NZD/CAD Long positionMarket is creating HH and HL. The Market continues target the PDH array, and getting closer to FVG on Daily TF.
Look for buy opportunity only. Wait for pullback to enter, between 0.83922-0.83774.


NZD---Cad-----bullishthere are series of HH $ HL in trend there is no divergence in trend probability of high chances of trend continue

NZDCAD POTENTIAL LONG OPPORTUNITY Hello amazing people! Just wanted to come on here and make a post for the week on a potential upcoming opportunity I see on the NZDCAD currency cross. Potential bounce play if not new high play on the weekly coming into play so let's see what the market gives us but let's dive in!!
OK so when zooming out on the higher TF I saw that in 2022 NZDCAD made a huge run to the upside creating multi-year highs. Following this move we saw a long term corrective move coming in A LOT weaker and slower then that buyer push we saw. Something else I'm realizing on the weekly timeframe now is actually price forming subtle higher highs and higher lows on price on the weekly showing me a potential shift coming into play. This is what built my BIAS for a potential upside opportunity on this pair!
OK so when looking at the weekly and daily timeframe I was looking for some areas of demand to support this higher timeframe bias that I am formulating based on price action. When looking at the weekly and daily timeframes I found the 0.81700 demand zone as the strongest and highest confluence zone to see a bounce to the upside from! You can see the 78.6 (discount) fib level is aligning with the weekly/daily point of demand I have marked off as well on the charts.
Now I am waiting to watch how price comes into that level and if it can give me any more price action confluence to make this trade a little more juicy!
ALRIGHT GUYS! Hope you enjoyed!! Please boost this post and follow my page for more accurate analysis and trade setups! Love you all. God Bless!

NZDCAD - Bullish ReversalThe pair has made a bullish RSI divergence. We are selling it on printing higher high and higher low. The trade plan is set, let's hope for the profit!

NZDCAD ShortWith prices reaching the value area , the three touch structure and ascending channel shows a potential reversal from the bears.

BUY NZDCAD - trade explained in detailTrader Tom, a technical analyst with over 15 years’ experience, explains his trade idea using price action and a top down approach. This is one of many trades so if you would like to see more then please follow us and hit the boost button.

NZDCAD Risky Short!NZD-CADshot up sharply
And the pair is locally
Oversold so after it
Hits the horizontal
Resistance of 0.83846
We will be expecting a
Local bearish correction !

NZD/CAD Short ideasBroke the trend line. Now in consolidation stage.
Target is the Equal Lows (Liquidity)
NZDCAD I am looking for shorts on the 1H I see a 1H bearish flag,just waiting for the candlestick conformation and NZDCAD is been on the uptrend for weeks
