NZDCAD ENTRY CHART On this pair,we will be looking at more bearish movements,as it's trend is still Bearish, also we had a valid supply zone with SNR Confluence, MTF analysis also Included. We will be watching out for this pair today, update will be given in the comment session as price plays forward. THANK YOU
CADNZD trade ideas

NZDCAD SHORT Market structure structure bearish on HTFs DH
Entry at Both Weekly and Daily AOi
Weekly Rejection at AOi
Daily Rejection At AOi
Previous Structure point Daily
Around Psychological Level 0.82500
H4 EMA retest
H4 Candlestick rejection
Rejection from Previous structure
Levels 3.72
Entry 100%
REMEMBER : Trading is a Game Of Probability
: Manage Your Risk
: Be Patient
: Every Moment Is Unique
: Rinse, Wash, Repeat!
: Christ is King.

Tariffs. Turbulence. OpportunityMarkets Rattle as Global Currencies Slide: Central Banks Prepare to Act
Global financial markets plunged on Monday as U.S. tariffs under the Trump administration, alongside retaliatory measures from key trading partners, officially took effect. The result: a wave of uncertainty and volatility that sent the Australian, Canadian, and New Zealand dollars spiraling to steeply discounted levels.
As this new economic reality unfolds, institutional investors and households alike are scrambling to adjust. In response, central banks across the globe face mounting pressure to stabilize their economies. The most immediate solution? Accelerated interest rate cuts.
Beyond the headline noise of trade wars, the deeper concern lies in domestic economic resilience. Economists and central bankers are increasingly turning inward, looking to bolster aggregate demand through aggressive monetary easing. The U.S. Federal Reserve, nudged persistently by President Trump, has already signaled its willingness to comply. Other central banks are expected to follow suit as nations seek to shield local industries from the impact of trade disruption.
The era of lower global interest rates appears to be more than a passing phase—it is becoming the new norm. In volatile times, disciplined strategies and a long-term lens are more essential than ever. We remain focused on seizing value where others see only risk.

NZDCAD Selling Trading IdeaHello Traders
In This Chart nzdcad HOURLY Forex Forecast By FOREX PLANET
today NZDCAD analysis 👆
🟢This Chart includes_ (NZDCAD market update)
🟢What is The Next Opportunity on NZDCAD Market
🟢how to Enter to the Valid Entry With Assurance Profit
This CHART is For Trader's that Want to Improve Their Technical Analysis Skills and Their Trading By Understanding How To Analyze The Market Using Multiple Timeframes and Understanding The Bigger Picture on the Charts

NZDCAD BULLISH OR BEARISH DETAILED ANALYSIS ??NZDCAD is currently coiling within a textbook bullish flag formation after an aggressive impulsive leg to the upside. Price action remains tight inside this consolidation structure, respecting both trendline resistance and support. As we approach the apex of this flag, I’m closely watching for a breakout confirmation to trigger the next bullish continuation leg toward the 0.8600 target.
From a macro perspective, the New Zealand dollar is gaining strength following the RBNZ’s firm stance on keeping rates elevated due to persistent inflation risks, particularly in housing and services. On the flip side, the Canadian dollar is showing relative weakness as oil prices stall and the Bank of Canada shifts toward a more dovish tone amid weaker economic data and slowing consumer spending. This divergence in central bank policy and economic outlook is building a strong fundamental case for NZDCAD upside.
Technically, the structure remains clean. The market formed a strong bullish engulfing rally earlier in April, and since then has entered a symmetrical correction with higher lows forming under compression. This is a classic continuation setup with strong momentum buildup underneath. A breakout above the 0.8280–0.8300 zone with volume would likely trigger institutional interest and drive price rapidly toward the 0.8600 level, which aligns with the measured move of the flag.
This is a high-probability trade idea supported by both technical and fundamental convergence. With risk well-defined below 0.8135 and momentum favoring the bulls, NZDCAD is one of my top setups going into June. Breakout traders and swing traders alike should keep this pair on the radar as the next bullish expansion looks imminent.

NZDCAD: Likely to Drop Again Inside a Corrective PatternNZDCAD: Likely to Drop Again Inside a Corrective Pattern
On the 4-hour chart, NZDCAD is moving within a large corrective pattern.
Looking at past price action, we can see that NZDCAD has repeatedly declined from this zone. The pattern suggests that another drop is likely.
The price movements have followed a "V"-shaped reversal without clear confirmation, meaning we can expect a similar price behavior again.
Key target areas:
0.8226
0.8205
0.8180
You may find more details in the chart!
Thank you and Good Luck!
❤️PS: Please support with a like or comment if you find this analysis useful for your trading day❤️
Disclosure: I am part of Trade Nation's Influencer program and receive a monthly fee for using their TradingView charts in my analysis.

NZDCAD - TECH.Hello everybody! It's Nika.
As we can see, we have triple bottom support. Maybe not only that, but here is also rising support channel.
Have a nice trade.

weekly,daily,4hour Market structure MTF analysiswe have downtrend on weekly we are previous high of weekly and daily is proving downtrend and recently we just confirmed a downtrend on 4hours timeframe

NZD/CAD - Large Timeframe breakdown for potential sell side move📉 AUD/NZD – 8H Bearish Outlook with 4D Confluence
Price action has completed a clean 5-wave Elliott structure, with the final leg (Wave 5) concluding at a key weekly 71% Fibonacci retracement level — now acting as strong supply.
🔹 Liquidity Grab Complete:
All buy-side liquidity above swing highs appears to have been swept, leaving price vulnerable to a deeper correction.
🔹 Break in Structure (ChoCH):
A clear Change of Character (ChoCH) confirms bearish intent, and price is now showing signs of lower high formation beneath internal supply zones.
🔹 Sell Opportunity:
The market is likely targeting Sell-Side Liquidity (SSL) resting beneath recent lows.
Short-term rallies into minor supply may offer low-risk entries.
🎯 Final downside target: 0.78286, aligned with major structural lows.
With fib rejection, Elliott wave exhaustion, and liquidity mechanics aligning — this setup offers a high-probability short scenario for experienced traders.

NZDCAD The Target Is UP! BUY!
My dear followers,
This is my opinion on the NZDCAD next move:
The asset is approaching an important pivot point 0.8191
Bias - Bullish
Technical Indicators: Supper Trend generates a clear long signal while Pivot Point HL is currently determining the overall Bullish trend of the market.
Goal - 0.8219
About Used Indicators:
For more efficient signals, super-trend is used in combination with other indicators like Pivot Points.
Disclosure: I am part of Trade Nation's Influencer program and receive a monthly fee for using their TradingView charts in my analysis.
———————————
WISH YOU ALL LUCK

NZDCAD | Strong Demand Zone DetectedIf we look at the daily chart for NZDCAD we can see a strong demand zone forming. This level will make a good target for order flow.
Typically, you want to wait for price to reach this level and take a long. However, you can also use this as a higher timeframe orderflow bias. But keep in mind you'll be lowering your odds of success compared to the long.

NZDCAD Is Bearish! Sell!
Take a look at our analysis for NZDCAD.
Time Frame: 10h
Current Trend: Bearish
Sentiment: Overbought (based on 7-period RSI)
Forecast: Bearish
The market is testing a major horizontal structure 0.824.
Taking into consideration the structure & trend analysis, I believe that the market will reach 0.817 level soon.
P.S
We determine oversold/overbought condition with RSI indicator.
When it drops below 30 - the market is considered to be oversold.
When it bounces above 70 - the market is considered to be overbought.
Disclosure: I am part of Trade Nation's Influencer program and receive a monthly fee for using their TradingView charts in my analysis.
Like and subscribe and comment my ideas if you enjoy them!

NZDCAD Technical & Order Flow AnalysisOur analysis is based on multi-timeframe top-down analysis & fundamental analysis.
Based on our view the price will fall to the monthly level.
DISCLAIMER: This analysis can change anytime without notice and is only for assisting traders in making independent investment decisions. Please note that this is a prediction, and I have no reason to act on it, and neither should you.
Please support our analysis with a boost or comment!

NZD_CAD LONG SIGNAL|
✅NZD_CAD is going down to
Retest a horizontal support of 0.8160
Which makes me locally bullish biased
And I think that we will see a rebound
And a move up from the level
So we can go long wit the
TP of 0.8206 and the SL of 0.8152
LONG🚀
✅Like and subscribe to never miss a new idea!✅
Disclosure: I am part of Trade Nation's Influencer program and receive a monthly fee for using their TradingView charts in my analysis.

NZD/CAD at Key Support: Reversal Opportunity or Bearish Breakdow✅ Detailed Technical Conclusion (Based on H4 Chart & Indicators)
The NZD/CAD pair is currently trading near the bottom of a well-defined range between 0.81800 and 0.83000, representing a major horizontal support level that has been respected multiple times over recent weeks.
Despite the broad bearish sentiment reflected in the moving averages (all indicating Sell) and momentum indicators like MACD and Momentum (10), several important reversal signals are starting to emerge:
🔍 Bullish Reversal Clues
Commodity Channel Index (CCI) is at -174, a deeply oversold reading, often preceding a bullish bounce.
Stochastic %K is at 16.1, and RSI at 36.1 — both nearing or in oversold territory.
Price is sitting on S1 Pivot (0.81611) and close to the range floor, where previous rebounds occurred.
Heatmap Fundamentals show NZD strengthening while CAD remains relatively weak, supporting bullish outlook.
⚠️ Bearish Pressure Risks
All major moving averages (from EMA10 to SMA200) are above price and aligned in a bearish stack.
Break and close below 0.81600 would invalidate the range and expose the next targets near 0.81000 and 0.80000.
Momentum is still weak, so confirmation of a bounce is essential before entering a long.
📌 Strategic Conclusion
If the 0.81800 support holds with bullish price action confirmation, this presents a high-reward long opportunity, aiming for a breakout above 0.83000 and extension toward 0.84000 or higher.
If 0.81600 fails decisively, traders should shift to a bearish outlook, targeting the 0.81000 and 0.80000 zones.

NZDCAD - Bullish Flag PatternNZDCAD is forming Bullish Flag Pattern, will it move towards its target?
Entry, Stop Loss & Take Profit are mentioned.


NZDCAD bearish expectations after RBA
OANDA:NZDCAD price action visible, price currently in ascending channel, moving zig-zag last two weeks, here after yesterday RBA, having bearish expectations.
Break of violet doted line can be taked for confirm.
SUP zone: 0.82700
RES zone: 0.81500

NZD/CAD BUYERS WILL DOMINATE THE MARKET|LONG
Hello, Friends!
NZD-CAD downtrend evident from the last 1W red candle makes longs trades more risky, but the current set-up targeting 0.827 area still presents a good opportunity for us to buy the pair because the support line is nearby and the BB lower band is close which indicates the oversold state of the NZD/CAD pair.
Disclosure: I am part of Trade Nation's Influencer program and receive a monthly fee for using their TradingView charts in my analysis.
✅LIKE AND COMMENT MY IDEAS✅

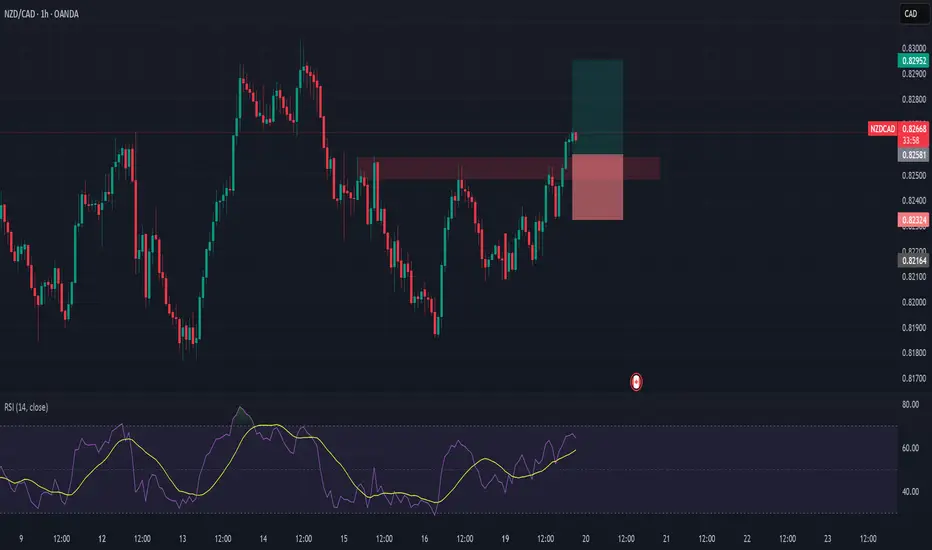
NZDCAD Long – Breakout + Retest Opportunity Backed by Macros🔹 Pair: NZD/CAD
🔹 Timeframe: 1H
🔹 Direction: Long
🔹 Status: Breakout of resistance → waiting for retest at turncoat support
🔹 Entry Zone (Planned): 0.8250–0.8260
NZD is the top gainer this week with strong conditional momentum and seasonal strength. CAD is stagnating under weak macro support. We're now watching for a pullback to the breakout zone for an ideal long entry.
Will look to enter between 0.8250–0.8260, SL under 0.8230, and aiming for 0.8295+.
📊 Macro & Fundamental Confluence
🇳🇿 NZD – Bullish
Biggest Weekly Gainer: Conditional score surged 🚀 from 8 → 13
Seasonal Bias: Strong buy signal from mid-May onward
Central Bank: RBNZ remains hawkish amid stable inflation targets
Risk-On Regime: VIX < 20 favors high-beta currencies like NZD
🇨🇦 CAD – Bearish
Policy vs Data Mismatch: BoC hawkish, but weak retail & CPI data
Global Headwinds: Commodity weakness and trade risks weigh on CAD
🧩 Confluences
✅ NZD macro & conditional strength
✅ CAD stagnation
✅ Risk-on favors NZD
✅ Technical breakout + higher high confirmed
NZD/CAD🔹Symbol: NZD/CAD
🔹Price: 0.82533
🔹Stop loss: 0.82736
🔹Take profit 1: 0.82248
🔹Take profit 2: 0.81850
📊Check your chart before entering.
♦️Check before use to make sure there is no important news.

NZD/CAD For Bullishwait for pull-back near by entry point and then go long
general trend is up trend
have fun :)

