NZDCAD LONG/BUYBy utilizing Fibonacci retracement levels, historical patterns, , we can formulate a hypothesis that the market might follow a similar trajectory if bullish sentiment prevails.
CADNZD trade ideas

NZD/CAD SELLERS WILL DOMINATE THE MARKET|SHORT
Hello, Friends!
We are going short on the NZD/CAD with the target of 0.812 level, because the pair is overbought and will soon hit the resistance line above. We deduced the overbought condition from the price being near to the upper BB band. However, we should use low risk here because the 1W TF is green and gives us a counter-signal.
Disclosure: I am part of Trade Nation's Influencer program and receive a monthly fee for using their TradingView charts in my analysis.
✅LIKE AND COMMENT MY IDEAS✅


NZADCADHi traders welcome back!
Its high potential to sell NZDCAD since sellers ready to overrule the market.
Stay and follow with me to get nice setups with good entry points

NZD_CAD RESISTANCE AHEAD|SHORT|
✅NZD_CAD is going up to retest
A horizontal resistance of 0.8350
Which makes me locally bearish biased
And I think that we will see a pullback
And a move down from the level
Towards the target below at 0.8275
SHORT🔥
✅Like and subscribe to never miss a new idea!✅
Disclosure: I am part of Trade Nation's Influencer program and receive a monthly fee for using their TradingView charts in my analysis.

NZDCAD sell ideaAfter an initial rejection from the 4-hour supply zone on April 21st, which lacked conviction, and a successful retest today, I foresee a high likelihood of a price decline to at least 0.819.

NZDCAD -Clear resistance area with peaking strength and momentumNZDCAD running into historic areas of volume on short term chart this morning (Blue Line Orange Circles)
Momentum peaking
Strength Peaking in RSI
SELL at current levels 8275
STOP at 8292
Take Profit at 8242
Almost 2:1 risk reward
E

NZD/CAD For Bullishwait for pull-back near by entry point and then go long
general trend is up trend
have fun :)

NZDCAD Discretionary Analysis: Bounce at 0.83Hello traders and happy Easter Monday!
I'm expecting a bounce on NZDCAD. I'm interested in this 0.83 zone. It might turn into a strong bounce point. If the signs are there, I'm jumping in with a short.
Discretionary Trading: Where Experience Becomes the Edge
Discretionary trading is all about making decisions based on what you see, what you feel, and what you've learned through experience. Unlike systematic strategies that rely on fixed rules or algorithms, discretionary traders use their judgment to read the market in real time. It's a skill that can't be rushed, because it's built on screen time, pattern recognition, and the ability to stay calm under pressure.
There's no shortcut here. You need to see enough market conditions, wins, and losses to build that intuition—the kind that tells you when to pull the trigger or sit on your hands. Charts might look the same, but context changes everything, and that's something only experience can teach you.
At the end of the day, discretionary trading is an art, refined over time, sharpened through mistakes, and driven by instinct. It's not for everyone, but for those who've put in the work, it can be a powerful way to trade.

NZDCAD: Break & Retest Setup 🇳🇿🇨🇦
NZDCAD broke and closed above a key daily/intraday horizontal resistance.
We see a strong bullish reaction to that after its test
and, from a current perspective, we see that it turned into support now.
I expect a bullish continuation at least to 0.8327
❤️Please, support my work with like, thank you!❤️
I am part of Trade Nation's Influencer program and receive a monthly fee for using their TradingView charts in my analysis.

NZD_CAD SHORT SIGNAL|
✅NZD_CAD has reached a supply level
So according to our strategy
We can enter a short trade
With TP of 0.8258 and the
SL of 0.8352 as we will be
Expecting a local bearish correction
SHORT🔥
✅Like and subscribe to never miss a new idea!✅
Disclosure: I am part of Trade Nation's Influencer program and receive a monthly fee for using their TradingView charts in my analysis.

NZDCAD SHORT Market Structure bearish on HTFs DW
Entry at both Daily and Weekly AOi
Weekly Rejection At AOi
Weekly EMA retest
Daily Rejection at AOi
Previous Daily Structure point
Around Psychological Level 0.82500
H4 Candlestick rejection
Levels 5.31
Entry 90%
REMEMBER : Trading is a Game Of Probability
: Manage Your Risk
: Be Patient
: Every Moment Is Unique
: Rinse, Wash, Repeat!
: Christ is King.

NZDCAD Elliot Waves forecast: Is wave 1 complete?NZDCAD have completed wave 2 which have unfolded as a complex correction WXY. Looks like currently price is making wave 1 of lower degree. If this count is correct we should expect price to retrace to the golden zone fib 50% to 61.8% before resuming the bullish momentum. Lets continue to monitor it a possible short setup when the 1st wave is completed.

NZDCAD: Bearish Continuation is Highly Probable! Here is Why:
The price of NZDCAD will most likely collapse soon enough, due to the supply beginning to exceed demand which we can see by looking at the chart of the pair.
❤️ Please, support our work with like & comment! ❤️

NZD/CAD For Bullishwait for pull-back near by entry point and then go long
general trend is up trend
have fun :)

Institutional Supply: NZD/CAD shortsHey,
Next on my list is NZD/CAD.
Like many other pairs, it’s in an extreme move — with our zones acting like magnets where price may finally pause and take a breath.
In these conditions, it’s all about patience. Whether you’re riding strong trends or waiting for a reversal, let the market do its thing.
And as always, be careful trying to catch falling knives.
Kind regards,
Max Nieveld

NZD/CAD Chart Analysis (30m TF) Market Outlook: BearishNZD/CAD Chart Analysis (30m TF)
Market Outlook: Bearish
Entry Point:
Sell at 0.82192 (current price zone marked with horizontal line and price tag)
Take Profit Targets:
TP1: 0.81483 (first horizontal support line)
Final TP: 0.80768 (second and lower support zone)
Support Levels:
0.81483 — Minor support (first target)
0.80768 — Strong support (final target area)
Resistance Level:
0.82192 — Immediate resistance (entry point zone)
Minor intraday resistance near 0.82350 (local highs)
Technical Observation:
Price formed a lower high and is consolidating below resistance.
Bearish breakout setup drawn with projection to the downside.
Confirmation to sell upon clear breakdown below support area and continuation pattern forming.

CadnzdAm still pretty much interested in this trade if price much up back to the support and break and retest then we look for a buy position

NZDCADwe are the bottom of the chanel. i expect price to go UP to uper band of chanel. wait for trend line brake.

Watching Volume Clusters for Short Opportunities on NZD/CADThe OANDA:NZDCAD pair is respecting a clear bearish market structure on the weekly timeframe. Price remains below the Ichimoku cloud (Span A at 0.8081 and Span B at 0.8218), confirming ongoing bearish momentum.
Price is now hovering around the Point of Control (POC) from the volume profile of the last major move — between 0.822 and 0.815, an area of high transaction activity and potential resistance. This zone presents a valid area to initiate short positions, especially given the lack of bullish breakout.
However, the optimal supply zone lies slightly higher between 0.823 and 0.838, which also corresponds to the second-highest volume node in the current range. If price pushes into this area and shows rejection, it may offer a cleaner entry for higher reward setups.
The target for this bearish scenario is the previous swing low at 0.7687, which marks a significant support level. The invalidating level for the bearish bias is a break above 0.8480, which sits above the recent structural high.
Trade Setup Summary:
Short Entry Zone 1 (aggressive): 0.822 – 0.815 (POC area)
Short Entry Zone 2 (optimal): 0.823 – 0.838 (supply zone)
Stop Loss: Above 0.8480
Target: 0.7687
The TSI indicators are near neutral but slightly negative:
TSI(10): -0.13
TSI(20): -0.04
This confirms the bearish pressure remains, but the move is not oversold, leaving room for further downside continuation.
The New Zealand dollar remains under pressure due to softening economic data and expectations of dovish monetary policy from the RBNZ, while the Canadian dollar has recently found support from stronger oil prices and relatively stable BoC guidance. Although both currencies are commodity-linked, CAD's correlation with energy gives it an edge in current conditions. As long as this divergence holds, the bias on NZD/CAD remains to the downside, in line with the current technical structure.
Disclaimer: This content is for educational and informational purposes only. It does not represent financial advice or a recommendation to buy or sell any financial instrument. Trading involves risk, and you should only trade with money you can afford to lose.

NZDCAD: Bearish Continuation & Short Signal
NZDCAD
- Classic bearish formation
- Our team expects fall
SUGGESTED TRADE:
Swing Trade
Sell NZDCAD
Entry Level - 0.8262
Sl - 0.8332
Tp - 0.8116
Our Risk - 1%
Start protection of your profits from lower levels
Disclosure: I am part of Trade Nation's Influencer program and receive a monthly fee for using their TradingView charts in my analysis.
❤️Please, support our work with like & comment!❤️

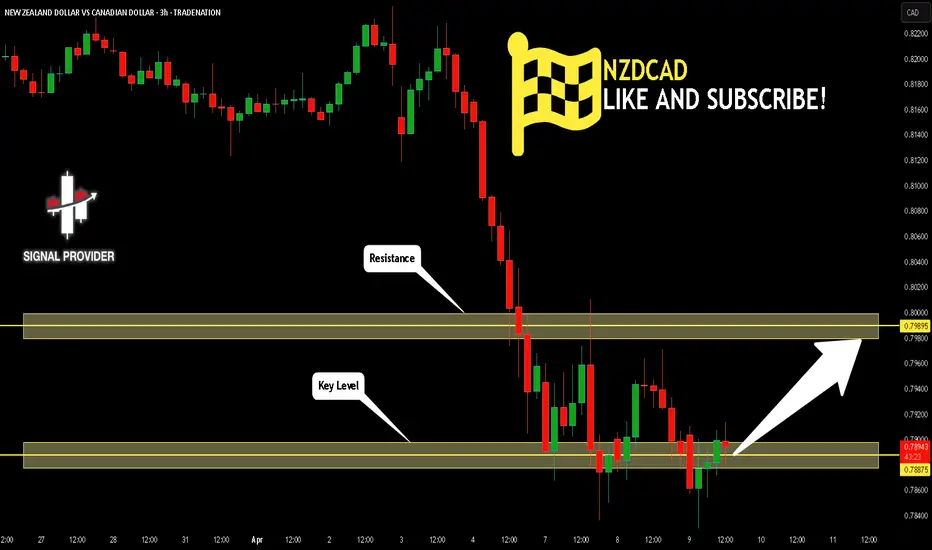
NZDCAD Is Going Up! Buy!
Take a look at our analysis for NZDCAD.
Time Frame: 3h
Current Trend: Bullish
Sentiment: Oversold (based on 7-period RSI)
Forecast: Bullish
The market is on a crucial zone of demand 0.788.
The oversold market condition in a combination with key structure gives us a relatively strong bullish signal with goal 0.798 level.
P.S
Please, note that an oversold/overbought condition can last for a long time, and therefore being oversold/overbought doesn't mean a price rally will come soon, or at all.
Disclosure: I am part of Trade Nation's Influencer program and receive a monthly fee for using their TradingView charts in my analysis.
Like and subscribe and comment my ideas if you enjoy them!
NZD/CAD SENDS CLEAR BEARISH SIGNALS|SHORT
NZD/CAD SIGNAL
Trade Direction: short
Entry Level: 0.826
Target Level: 0.804
Stop Loss: 0.840
RISK PROFILE
Risk level: medium
Suggested risk: 1%
Timeframe: 9h
Disclosure: I am part of Trade Nation's Influencer program and receive a monthly fee for using their TradingView charts in my analysis.
✅LIKE AND COMMENT MY IDEAS✅
