USD/CAD 15-Minute Time Frame (15TF) Technical & Fundamental AnalUSD/CAD 15-Minute Time Frame (15TF) Technical & Fundamental Analysis
Last week, we highlighted potential bullish momentum building in USD/CAD. That narrative continues to develop, supported by the latest economic data.
The U.S. Core PCE Price Index came in at 0.2%, slightly higher than the previous 0.1%, indicating persistent inflationary pressure that could keep the USD supported. On the other hand, Canada’s GDP contracted by -0.1%, a significant drop from the previous 0.2% growth, weighing on the CAD.
Technical Outlook:
Following the price rejection near 1.37500, USD/CAD entered an accumulation phase around 1.3680–1.3690, signaling smart money building long positions.
After accumulating buy orders and sweeping liquidity below the key level at 1.36750, price has broken above a minor resistance zone, indicating bullish intent. A visible manipulation pattern within a liquidity pocket further supports this move.
We now anticipate a continuation higher from a key re-entry zone around recent breakout structure.
📊 Trade Setup
📍 Area of Interest (AOI): 1.36770 (Buy Limit Order)
🛡 Stop-Loss: 1.36570 (Below liquidity zone)
🎯 Take Profit: 1.37280 (Next key resistance / ~1:2.5 RR)
This trade aligns with institutional behavior — accumulation, liquidity grab, and break of structure — suggesting a bullish continuation as long as price respects the recent breakout zone.
📌 Disclaimer:
This is not financial advice. Always wait for proper confirmation before executing trades. Manage risk wisely and trade what you see—not what you feel.
CADUSD trade ideas

USDCAD – Long Bias LiveUSDCAD – Long Bias Live
🔹 Entered long near market open at ~1.36780
🎯 Target: 1.37112 (previous swing area highlighted)
⏳ Expect to hold into next London/New York session
After a sharp spike up into the yellow zone (~1.37283) and subsequent retrace, price has found support around 1.36780 (lower white curve). I’m anticipating a bounce back up toward the red resistance band at 1.37112 (former swing level).
• Entry: ~1.36780 support
• Target: 1.37112 resistance
• Timeframe: 15 min chart, swing through today’s London open
All setups can be replayed on TradingView for confirmation.
⚠️ Not financial advice—always trade with proper risk management!
#USDCAD #Forex #TradingView #PriceAction #SwingTrade

CADUSD - BullishMarket formed a BUllihs divergence on 1H time frame followed by the inverse H&S pattern. Market broke the last LH, and then formed the 1st HH and HL and 2nd HL is being formed. which is clear sign of bullish trend. we take instant entry and place our SL below the right Shoulder of pattern.
we anticipate the market to remain bullish and put TPs 1 and 2 accordingly with 1:1 and 1:2 R:R ratio.
Happy Trading Guyz .

Is it too late for a TACO trade on USD/CAD? USD/CAD jumped nearly 900 pips on Monday after President Donald Trump announced he is “terminating” trade negotiations with Canada. But the surge didn’t stick. Within hours, the pair gave up most of its gains, slipping back below the 1.3700 breakout level.
There’s been no reversal from Trump — not yet. But price action suggests the market might be front-running one. Traders have seen this before: the “TACO” setup — Trump Always Chickens Out.
In that context, traders may be cautious about chasing the spike without confirmation that the trade breakdown will be long-lasting. The USD/CAD trade now hinges on updates from Trump for more TACO setups.
If USD/CAD stays below 1.3700, the focus shifts back to 1.3628 and possibly lower. Below that, the long-term structure suggests a broader range between 1.3500 and 1.3770.

USDCAD TRADE SETUPWait for retest the entry level and bearish momentum candle then take a trade for Sell otherwise skip this setup

USDCAD Trade Plan 26/06/2025Dear Traders,
🧠 USD/CAD Technical Analysis – June 26, 2025
On the 4H chart, we observe a confirmed breakout from the descending trendline, followed by a correction. Price is now retracing toward the demand zone between 1.3635 – 1.3610, which is expected to act as support.
✅ Support Zone: 1.3635 – 1.3610
📌 Resistance Zone: 1.3885 – 1.3925
🎯 Final Target: 1.4020
🛡 Stop Loss: Below 1.3515
⚖ Risk-to-Reward Ratio: 1 : 3.17
The structure of higher lows along with the broken trendline confirms a bullish bias. A confirmation candle in the demand zone may offer a solid long entry opportunity.
Regards,
Alireza!

USDCAD possible Long ideaUSDCAD seems to have turned bullish and doing a retracement in H4.
Based on existing confirmation, there is a chance that it reach to liquidity level 1.37392
This is for educational purpose only. Not an investment or financial advise.

USDCAD - Bullish Story: Strong Bullish rally from previous - Market make a corrective move till 0.382 level of FIB and followed by Bullish Flag pattern.
Anticipate : we anticipate market to continue the bullish trend and we plan our entry on the breakout of flag neck line.
PLAN : entry point is break of neckline level, TPs will be as projected through Pole of FLAG.

USDCAD RT of Supply Zone then ShortPrice has retraced back into a key supply zone just under the June High. We are now watching for strong bearish price action (PA) to confirm a potential short entry from this area.
Key Zone to Watch:
Supply Zone: 1.3756 – 1.3796
Optimistic stops can be placed above the zone if strong rejection occurs
Plan:
Seek bearish PA within the highlighted supply zone
Wait for confirmation via a bearish candle close
Enter below the trigger candle once setup forms
Targets:
Target 1: 1.3622
Extended Target / June Low: 1.3543
If no rejection occurs and price breaks above the zone with conviction, the setup becomes invalid and we reassess.
Execution will be reactive, not predictive — we trade confirmation, not speculation.

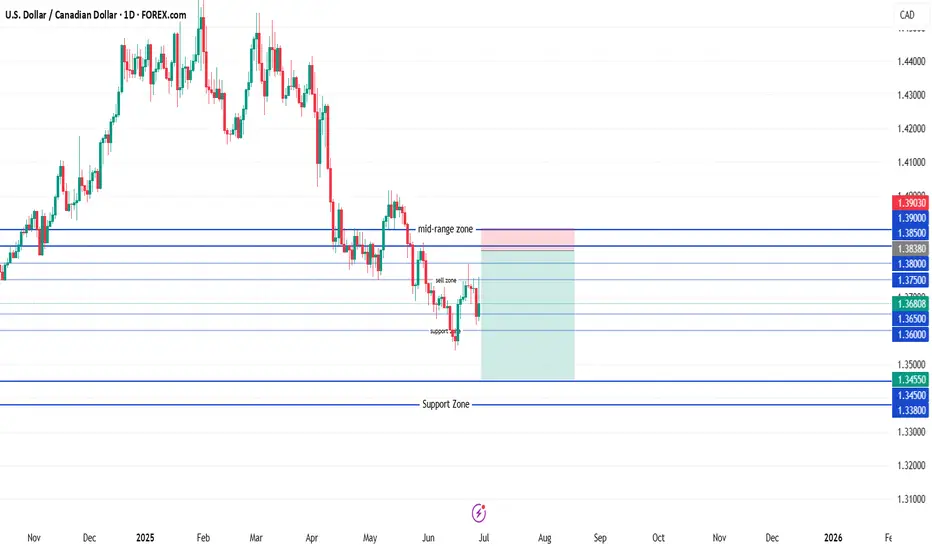
USD/CAD ShortSell-limit order: 1.3838
Stop-loss: 1.3903
Target 1: 1.3705
Target 2: 1.3605
Target 3 (optional runner): 1.3455
Place the limit at 1.3838 and keep the stop above 1.3900; scale out at the listed targets as price moves in your favor.
Should we keep an eye on it?!Hello friends..
This week we should be more on the chart, because most of the charts are in an attractive range for trading.
What our team sees is that the chart (US Dollar to Canadian Dollar) has hit a good range that we previously identified in the daily time frame and has managed to change the trend from a bearish to an upward trend. In the 4-hour time frame, the price shows us the trend change. Now we have to wait and look for a buy trade in the specified range.
The target for this trade can also be 1.3924.
It should be noted that as long as the price does not break the swing low (the line at the bottom) with the candle body, the trend remains upward.
So this week you can put this chart on your watch list.
You can follow our page to see more analysis.

USDCAD ( Weekly CLS Setup) Everything is clear here: a bearish order flow, with signs of manipulation and liquidity grabs above the structure highs. EUR/USD is trending upwards, presenting a good opportunity for a short trade on USD/CAD

When Charts Lie: How Fundamentals Rescued My Forex TradingEvery trader knows the frustration: your analysis is technically flawless, but the market moves against you. I learned this brutally in Q1 2024 when my USD/CAD short—backed by textbook bearish divergence and order block rejection—got steamrolled by a 190-pip rally after Canada’s surprise oil export announcement.
The Blind Spot in Pure Technicals
Price action traders often dismiss fundamentals as "noise," but three scenarios consistently break chart-based systems:
Policy Surprises (SNB removing EUR/CHF floor)
Geopolitical Shocks (Rubles during Ukraine invasion)
Structural Shifts (BOJ abandoning YCC)
These events share one trait: they change the market’s fundamental DNA, invalidating historical patterns.
A Practical Filter
I need to train myself to do something like this: To overlay two fundamental checks before technical entries:
Central Bank Calendar
No trades 12 hours before scheduled meetings
Monitor yield spreads (10YR US vs. DE)
Commodity Links
AUD/USD: Iron ore inventories
USD/CAD: WTI backwardation
Case Study: April 2024 GBP/USD
Technicals suggested continuation above 1.2700
Fundamental red flag: UK real wages shrinking
Outcome: False breakout, 140-pip drop
Your Turn
Try this today: On your next trade, ask:
Is there scheduled event risk?
Does this align with rate expectations?
Are commodities/equities confirming?
The goal isn’t perfection—it’s avoiding obvious mismatches.
For me, I read my own words on what should be done, and most probably, I won't do it. I think the above is too much. I believe there must be an easier way to merge Technical and Fundamental Analysis.

USD/CAD💰Symbol: { USD/CAD }
🟩Price: { 1.36868 }
🟥Stop: { 1.37236 }
1️⃣profit: { 1.36594 }
2️⃣profit: { 1.36183 }
3️⃣profit: { 1.35893 }
4️⃣profit: { 1.35562 }
📊Check your chart before entering.
🚨Check before use to make sure there is no important news.🚨

USD/CAD MILKEDUSD/CAD MILKED we went long on this trade as price delivery switched from a bearish program to a bullish program easy trades, easy setups

USDCAD Strongest long-term Sell in the market right now.At the beginning of the year (January 15, see chart below), we made an unpopular bearish call at the time, hinting that the USDCAD pair was approaching its Resistance Zone, hence a multi-year Top was in order:
As you can see, the moment the price hit that Resistance Zone, it got instantly rejected and a new Bearish Leg started, which has extended up to this day. This time we view this on the 1M time-frame where the Support levels are more clearly illustrated.
More particularly, the 1M MA50 (blue trend-line) poses as the first one, in fact it has been holding since September 2022. Our Target is still located at 1.26000, which is marginally above the 0236 Fibonacci level, which has been the 1st Target during both previous Bearish Legs. Also it is where the 1M MA200 (orange trend-line) is headed to, and there are high chances of a long-term bounce there.
-------------------------------------------------------------------------------
** Please LIKE 👍, FOLLOW ✅, SHARE 🙌 and COMMENT ✍ if you enjoy this idea! Also share your ideas and charts in the comments section below! This is best way to keep it relevant, support us, keep the content here free and allow the idea to reach as many people as possible. **
-------------------------------------------------------------------------------
Disclosure: I am part of Trade Nation's Influencer program and receive a monthly fee for using their TradingView charts in my analysis.
💸💸💸💸💸💸
👇 👇 👇 👇 👇 👇

USDCAD: Very Bearish PatternThe USDCAD has created a head and shoulders pattern at a significant intraday horizontal resistance.
A bearish breakout from this neckline indicates strong selling pressure, suggesting that the pair is likely to continue declining, potentially reaching at least the 1.3600 level.

USDJPY and USDCAD Analysis todayHello traders, this is a complete multiple timeframe analysis of this pair. We see could find significant trading opportunities as per analysis upon price action confirmation we may take this trade. Smash the like button if you find value in this analysis and drop a comment if you have any questions or let me know which pair to cover in my next analysis.

USDCAD I Weekly CLS I Model 1I Target 3M CLS LowHey, Market Warriors, here is another outlook on this instrument
If you’ve been following me, you already know every setup you see is built around a CLS Footprint, a Key Level, Liquidity and a specific execution model.
If you haven't followed me yet, start now.
My trading system is completely mechanical — designed to remove emotions, opinions, and impulsive decisions. No messy diagonal lines. No random drawings. Just clarity, structure, and execution.
🧩 What is CLS?
CLS is real smart money — the combined power of major investment banks and central banks moving over 6.5 trillion dollars a day. Understanding their operations is key to markets.
✅ Understanding the behavior of CLS allows you to position yourself with the giants during the market manipulations — leading to buying lows and selling highs - cleaner entries, clearer exits, and consistent profits.
📍 Model 1
is right after the manipulation of the CLS candle when CIOD occurs, and we are targeting 50% of the CLS range. H4 CLS ranges supported by HTF go straight to the opposing range.
"Adapt what is useful, reject what is useless, and add what is specifically your own."
— David Perk aka Dave FX Hunter ⚔️
👍 Hit like if you find this analysis helpful, and don't hesitate to comment with your opinions, charts or any questions.

Lingrid | USDCAD Support Level Bounce OpportunityThe price perfectly fulfilled my last idea . FX:USDCAD is attempting to stabilize after a sharp drop from the 1.3696 resistance area, approaching the lower boundary of the falling wedge pattern. The price is testing the 1.3600–1.3550 support band, aligned with the blue descending trendline and historical pivot zones. A bullish rebound here could push the pair back toward 1.3696, while failure to hold exposes 1.3500 and lower.
📈 Key Levels
Buy zone: 1.3550–1.3600
Sell trigger: breakdown below 1.3550
Target: 1.3696
Buy trigger: breakout and retest of 1.3625–1.3650 zone
💡 Risks
Bearish momentum continuation toward 1.3500 if bounce fails
Weak volume recovery may trap buyers near 1.3620
Rejection near descending red trendline can maintain bearish pressure
If this idea resonates with you or you have your own opinion, traders, hit the comments. I’m excited to read your thoughts!

USDCAD BUY 1.3568On the 4-hour chart, USDCAD fluctuated and fell. Currently, we can pay attention to the area around 1.3568 below, which is a potential buying position for a bullish bat pattern. At the same time, this position is within the previous demand area.

USDCAD Bearish Reversal Trade Setup – 3H Chart Analysis (June 26 Entry Zone: 1.37279 – 1.37554
🔹 Stop Loss: 1.37934
🔹 Target: 1.35278
🔹 Risk-to-Reward (RR): ~1:2.5
🧠 Technical Breakdown
Trend Overview:
Overall trend shows a downtrend from earlier June, followed by a corrective bullish move.
Price failed to sustain above the 200 EMA (blue line), indicating continued bearish pressure.
Trade Line Break:
A steep bullish trendline was broken, signaling a potential trend reversal or deeper pullback.
Bearish Rejection Zone:
The purple zone (1.37279 – 1.37554) acted as resistance.
Price formed a lower high and rejected this zone, confirming selling interest.
Entry Strategy:
Short entry is ideally within or just below the rejection zone.
Aggressive entry already in play at current market price (1.36909) after confirmation.
Target Zone:
Projected towards 1.35278, aligning with previous support and fib retracement zone.
Large purple support zone near the target suggests a potential reversal area.
⚠️ Risk Notes
Be cautious of USD volatility due to upcoming economic events (noted with icons on the chart).
Stop loss above previous swing high minimizes risk of fakeouts.
✅ Summary:
This is a bearish swing setup aiming for a significant drop toward 1.35278. The clean rejection from resistance and trendline break supports a high-probability short opportunity with favorable risk-reward.

USDCAD – Friday June 27th, 2025USDCAD played beautifully to our bias, breaking the 1.36647 safe sell level and delivering 46 pips clean before pulling back.
If you weren’t already in, the pullback offered a decent re-entry window — but at this point I’m not looking for new trades today.
📌 Still Bearish
Here’s what I’m watching now:
Retest of 1.36647 → possible add-on entry
Break and close below 1.35432 → continuation play
No need to force anything ahead of the weekend. Structure remains bearish and we’ll reassess post-weekend for continuation.
