USD/CAD: Momentum Turns South Again with Fed Cut Bets BuildingDownside risks flagged in a separate trade idea earlier this week finally materialised for USD/CAD, resulting in the initial target being achieved. With the price now trading marginally below those levels and momentum indicators still bearish, another short setup has presented itself.
If USD/CAD continues to hold beneath 1.3650, shorts could be initiated below the level with a stop above for protection. The obvious target would be support at 1.3550, where the price bounced strongly in May.
With market pricing for Fed rate cuts continuing to build, narrowing yield differentials between the United States and Canada, downside is also favoured from a fundamental perspective.
Good luck!
DS
CADUSD trade ideas

USD/CAD unclear, lower next weekAnalysing DXY the current daily candle is anticipated to be a consolidation 3rd candle. Although the retracement off the daily Fair Value Gap on USD/CAD looks like the last bearish argument to be removed, I don't expect follow through today.
Rather wait for a 3rd candle on DXY and trade lower from the new Fair Value Gap.

Bullish Bat and Bullish Crab patternWe have added confluence on this long-term swing buy up to 1.37 and 1.38 area. Be Patient. Happy Trading.

USDCAD - Outlook Short on all IndicatorsUSDCAD - Outlook Short on all Indicators
TVC:DXY
FRED:TREASURY
ECONOMICS:USGD
US CONS
- The US Treasury is under $353.5 Billion.
- DXY will continue to fall.
- The Decline of the US Dollar will continue.
- US Debt has exceeded $36 Trillion
- US Federal Debt Deficiency of over $2 Trillion (Must be paid prior to Interest Payments)
- US Federal Interest (over $1 Trillion)
- War in Iran
- USD could be converted to GOLD and moved to BTC
- Moody's US credit rating reduce.
- Interest Rate Cuts
US PROS
- Trump could get funding from another country.
- Interest Rate increases
- Positive FOMC in July

USDCAD Wave Analysis – 26 June 2025
- USDCAD reversed from the resistance zone
- Likely to fall to support level 1.3545
USDCAD currency pair recently reversed down from the resistance zone between the resistance level 1.3770 (former support from the start of May), upper daily Bollinger Band and the 50% Fibonacci correction of the downward impulse from last October.
This resistance zone was further strengthened by the resistance trendline from the start of February.
USDCAD currency pair can be expected to fall to the next support level 1.3545, which reversed the price in the middle of June.

Bullish reversal?USD/CAD is falling towards a support level, which acts as a pullback support just above the 78.6% Fibonacci projection. A bounce from this level could indicate the formation of a double bottom pattern, potentially leading to a price rise toward our take profit target.
Entry: 1.3555
Why we like it:
There is a pullback support levle.
Stop loss: 1.3465
Why we like it:
There is a support level that lines up with the 127.2% Fibonacci extension and the 100% Fibonacci projection.
Take profit: 1.3677
Why we like it:
There is a pullback resistance.
Enjoying your TradingView experience? Review us!
Please be advised that the information presented on TradingView is provided to Vantage (‘Vantage Global Limited’, ‘we’) by a third-party provider (‘Everest Fortune Group’). Please be reminded that you are solely responsible for the trading decisions on your account. There is a very high degree of risk involved in trading. Any information and/or content is intended entirely for research, educational and informational purposes only and does not constitute investment or consultation advice or investment strategy. The information is not tailored to the investment needs of any specific person and therefore does not involve a consideration of any of the investment objectives, financial situation or needs of any viewer that may receive it. Kindly also note that past performance is not a reliable indicator of future results. Actual results may differ materially from those anticipated in forward-looking or past performance statements. We assume no liability as to the accuracy or completeness of any of the information and/or content provided herein and the Company cannot be held responsible for any omission, mistake nor for any loss or damage including without limitation to any loss of profit which may arise from reliance on any information supplied by Everest Fortune Group.

usdcadThe Canadian dollar is likely to move in one of 3 directions:
There is a weekly support and a weekly trend line ahead
There is a daily resistance and a 4-hour timeframe
If the 4-hour support is not broken, it is ready to buy

USDCAD: Bullish Continuation is Expected! Here is Why:
Our strategy, polished by years of trial and error has helped us identify what seems to be a great trading opportunity and we are here to share it with you as the time is ripe for us to buy USDCAD.
Disclosure: I am part of Trade Nation's Influencer program and receive a monthly fee for using their TradingView charts in my analysis.
❤️ Please, support our work with like & comment! ❤️

USDCAD: Price Approaching Buying Zone, Will DXY Bounce Back? The USDCAD pair has dropped significantly in recent times, particularly as the DXY index has plummeted. The extremely bearish nature of the DXY suggests that the price of USDCAD is melting. Both fundamental and technical indicators indicate a potential bullish price reversal for this pair, which could potentially hit our first take-profit area. This is a swing analysis, so please give time for the trade to get activated and for it to work out in our favour.
Please note that this analysis does not guarantee that the price will move as suggested. Before trading, it’s essential to conduct your own research.
If you’d like to assist us, we encourage you to consider the following actions:
- Like our ideas
- Provide comments on our ideas
- Share our ideas
Kind regards,
Team Setupsfx_
Much love ❤️🚀

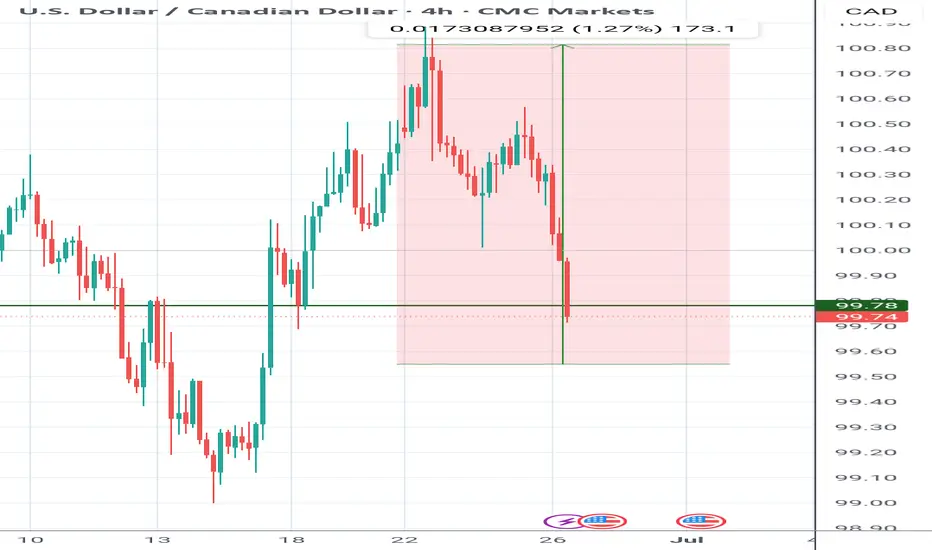
#USDCAD: 1000+ Pips Big Bullish Move With Three TargetsThe USDCAD is currently in a bearish trend since the day has dropped significantly and is still falling. We anticipate the price to drop slightly more before it reaches our entry zone. There are two entry points, and you can choose either one that aligns with your views. There are three targets, and you can set take profit targets that suit you best.
Good luck and trade safely.
Thanks for your support! 😊
If you want to help us out, here are a few things you can do:
- Like our ideas
- Comment on our ideas
- Share our ideas
Team Setupsfx_
❤️🚀

#USDCAD: Two Major Buying Zones, Patience Pays! As previously analysed, USDCAD is expected to decline towards our predetermined entry point. We anticipate a bearish US Dollar for the remainder of the week, which will ultimately lead USDCAD to reach the entry zone. Three distinct target areas exist, collectively worth over 1100 pips. Each entry point, stop loss, and take profit is clearly defined.
We wish you the best of luck and safe trading.
Thank you for your support.
If you wish to assist us, we encourage you to consider the following actions:
- Like our ideas
- Provide comments on our ideas
- Share our ideas
Kind Regards,
Team Setupsfx_
Much Love ❤️🚀

USDCAD Sell ForecastUSDCAD New Forecast👨💻👨💻
This is my personal trade and not in anyway a mandatory setup.
Note:
Follow proper risk management rules. Never risk more then 2% of your total capital. Money management is the key of success in this business...... Set your own SL & TP.
Please support this idea with a Like and COMMENT if you find it useful click "follow" on our profile if you will like these type of trading ideas delivered straight to your email in the future.
Thanks for your continued support!! lemme know your thoughts in the comment sec..

Bearish continuation for USDCADI see that the short term bullish pull back for USD is over by
- Head and shoulder pattern formation
- 50 ema crossing above price
- Bearish engulfing candles forming showing bearish momentum.

USDCAD bearish continuation expected
OANDA:USDCAD still bearish expected after today's events. Price bouncing and on some good, strong zones.
SUP zone: 1.37300
RES zone: 1.36000, 1.35600

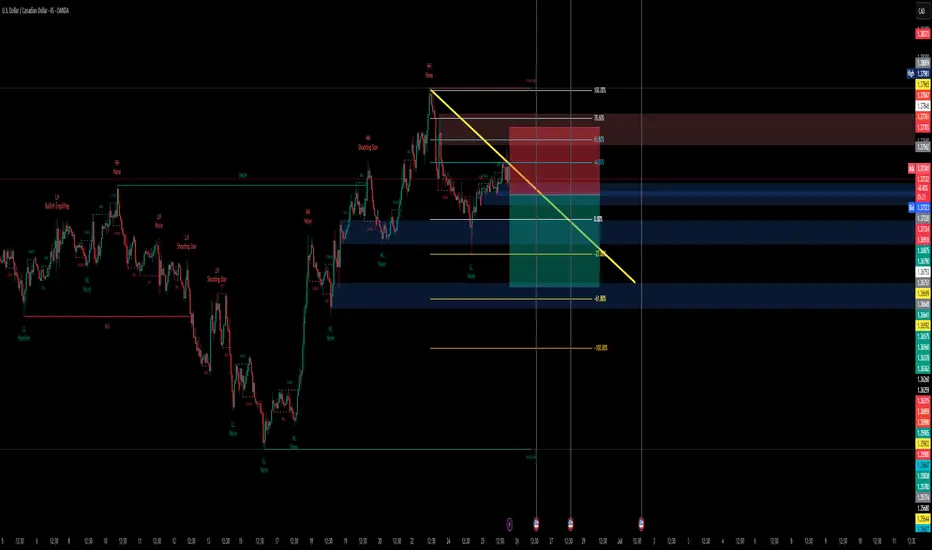
USDCAD: If This Breaks, USDCAD Might Be Lining Up a Smooth DropUSDCAD tapped into a clear liquidity zone and showed signs of weakness at the top. Price is now hovering near a potential break of structure, and a fair value gap has formed just above.
If we get that break, the idea is to wait for price to retrace into the FVG, then look for a clean continuation to the downside.
There’s also a bearish trendline holding well, adding pressure to the move. On top of that, a head and shoulders pattern is forming, another clue that momentum could be shifting lower.
No need to rush. Let the break happen. Let price return. Then act.

USDCAD Pressure Still to the DownsideHead and shoulders Pattern and bearish flag are strong confirmations that the overall trend is still bearish. However, now that the neckline of this H & S Pattern has been broken, be on the lookout for a minor retest before the downtrend resumes.
Patience Pays. The Trend is Your Friend.

USDCAD in Downtrend ContinuationForming a head and shoulders pattern, I believe the pair will continue its downtrend.
Sell Stop
Entry Price 1.3702
Stop Loss 1.3775
TP 1
Risk 1%
Lot Size 0.46

USD/CAD Forms Bullish Trend Structure – Key Levels to WatchUSD/CAD Forms Bullish Trend Structure – Key Levels to Watch
The USD/CAD pair has recently shown signs of a bullish trend formation, indicating a potential continuation of upward momentum in the coming trading sessions. The formation of a higher high on the 4-hour timeframe confirms a shift in market sentiment, suggesting that buyers are gaining control. This bullish structure signals that the pair may extend its gains, with key resistance and support levels guiding future price action.
Bullish Confirmation: Higher High Formation
A higher high is a classic technical indicator of an uptrend, reflecting increasing demand for the US dollar against the Canadian dollar. The recent price action confirms that bulls are dominating the market, increasing the likelihood of further upside movement. Traders should remain alert, as the prevailing trend suggests that any pullbacks may present buying opportunities unless a strong reversal pattern emerges.
Upside Targets: 1.38600 and 1.40100
If the bullish momentum continues, the USD/CAD pair could test the immediate resistance level at 1.38600. A decisive breakout above this level may accelerate the rally toward the next key target at 1.40100. These levels will act as critical zones where sellers might attempt to step in, but if buying pressure remains strong, the pair could extend its upward trajectory. Traders should watch for bullish continuation patterns near these resistance levels for potential breakout opportunities.
Support Level: 1.35300 as Key Floor
On the downside, 1.35300 serves as a crucial support level. Any corrective decline toward this zone could attract fresh buying interest, reinforcing the bullish outlook. A sustained break below this support would be necessary to invalidate the current uptrend, potentially shifting market sentiment in favor of the bears. Until then, traders may consider buying on dips near this support level.
Market Outlook: Bullish Bias Prevails
Given the recent price structure, the USD/CAD pair is expected to remain under buying pressure in the near term. Economic factors, including shifts in oil prices (which heavily influence the Canadian dollar) and Federal Reserve policy expectations, could further impact the pair’s movement. Traders should also monitor upcoming economic data releases, such as US inflation figures and Canadian employment reports, for additional market direction clues.
Conclusion
In summary, the USD/CAD pair has established a bullish trend, with higher highs reinforcing the upward bias. The immediate targets to watch are 1.38600 and 1.40100, while 1.35300 remains a critical support level. Unless there is a strong bearish reversal signal, the path of least resistance appears to be upward, making short-term bullish strategies favorable. As always, proper risk management and close monitoring of price action around key levels will be essential for navigating this market.

Usdcad1:6RR on this, proper analysis done. Apply proper risk management. I wont be accountable for anything. Feel free to follow my trades

USD/CAD H4 | Falling toward a pullback supportUSD/CAD is falling towards a pullback support and could potentially bounce off this level to climb higher.
Buy entry is at 1.3675 which is a pullback support that aligns closely with the 50% Fibonacci retracement.
Stop loss is at 1.3623 which is a level that lies underneath a swing-low support and the 61.8% Fibonacci retracement.
Take profit is at 1.3781 which is a swing-high resistance.
High Risk Investment Warning
Trading Forex/CFDs on margin carries a high level of risk and may not be suitable for all investors. Leverage can work against you.
Stratos Markets Limited (tradu.com ):
CFDs are complex instruments and come with a high risk of losing money rapidly due to leverage. 63% of retail investor accounts lose money when trading CFDs with this provider. You should consider whether you understand how CFDs work and whether you can afford to take the high risk of losing your money.
Stratos Europe Ltd (tradu.com ):
CFDs are complex instruments and come with a high risk of losing money rapidly due to leverage. 63% of retail investor accounts lose money when trading CFDs with this provider. You should consider whether you understand how CFDs work and whether you can afford to take the high risk of losing your money.
Stratos Global LLC (tradu.com ):
Losses can exceed deposits.
Please be advised that the information presented on TradingView is provided to Tradu (‘Company’, ‘we’) by a third-party provider (‘TFA Global Pte Ltd’). Please be reminded that you are solely responsible for the trading decisions on your account. There is a very high degree of risk involved in trading. Any information and/or content is intended entirely for research, educational and informational purposes only and does not constitute investment or consultation advice or investment strategy. The information is not tailored to the investment needs of any specific person and therefore does not involve a consideration of any of the investment objectives, financial situation or needs of any viewer that may receive it. Kindly also note that past performance is not a reliable indicator of future results. Actual results may differ materially from those anticipated in forward-looking or past performance statements. We assume no liability as to the accuracy or completeness of any of the information and/or content provided herein and the Company cannot be held responsible for any omission, mistake nor for any loss or damage including without limitation to any loss of profit which may arise from reliance on any information supplied by TFA Global Pte Ltd.
The speaker(s) is neither an employee, agent nor representative of Tradu and is therefore acting independently. The opinions given are their own, constitute general market commentary, and do not constitute the opinion or advice of Tradu or any form of personal or investment advice. Tradu neither endorses nor guarantees offerings of third-party speakers, nor is Tradu responsible for the content, veracity or opinions of third-party speakers, presenters or participants.

Falling towards major support?The Loonie (USD/CAD) is falling towards the pivot, which has been identified as an overlap support and could bounce to the 1st resistance.
Pivot: 1.3690
1st Support: 1.3667
1st Resistance: 1.3747
Risk Warning:
Trading Forex and CFDs carries a high level of risk to your capital and you should only trade with money you can afford to lose. Trading Forex and CFDs may not be suitable for all investors, so please ensure that you fully understand the risks involved and seek independent advice if necessary.
Disclaimer:
The above opinions given constitute general market commentary, and do not constitute the opinion or advice of IC Markets or any form of personal or investment advice.
Any opinions, news, research, analyses, prices, other information, or links to third-party sites contained on this website are provided on an "as-is" basis, are intended only to be informative, is not an advice nor a recommendation, nor research, or a record of our trading prices, or an offer of, or solicitation for a transaction in any financial instrument and thus should not be treated as such. The information provided does not involve any specific investment objectives, financial situation and needs of any specific person who may receive it. Please be aware, that past performance is not a reliable indicator of future performance and/or results. Past Performance or Forward-looking scenarios based upon the reasonable beliefs of the third-party provider are not a guarantee of future performance. Actual results may differ materially from those anticipated in forward-looking or past performance statements. IC Markets makes no representation or warranty and assumes no liability as to the accuracy or completeness of the information provided, nor any loss arising from any investment based on a recommendation, forecast or any information supplied by any third-party.
