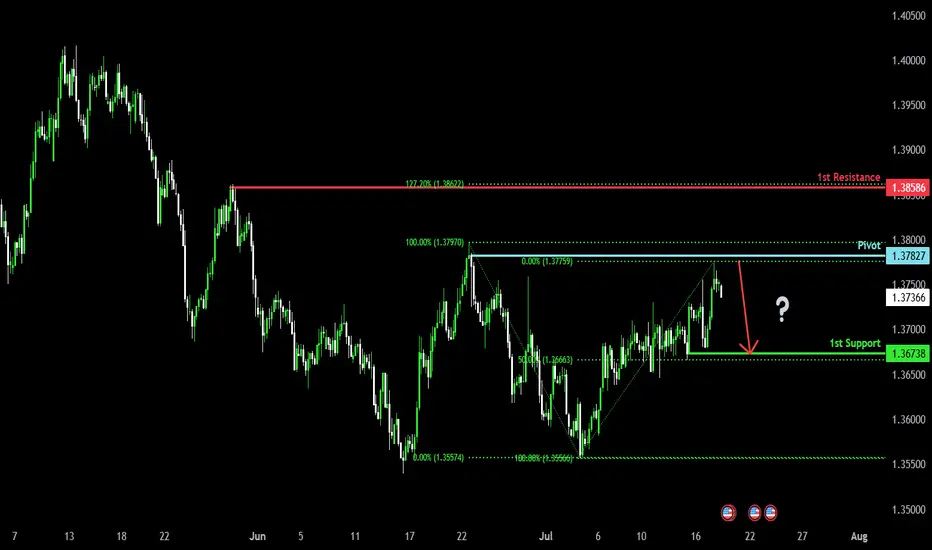
Heading into pullback resistance?The Loonie (USD/CAD) has rejected off the pivot which acts as a pullback resistance and could reverse to the pullback support that aligns with the 50% Fibonacci retracement.
Pivot: 1.3782
1st Support: 1.3673
1st Resistance: 1.3858
Risk Warning:
Trading Forex and CFDs carries a high level of risk to your capital and you should only trade with money you can afford to lose. Trading Forex and CFDs may not be suitable for all investors, so please ensure that you fully understand the risks involved and seek independent advice if necessary.
Disclaimer:
The above opinions given constitute general market commentary, and do not constitute the opinion or advice of IC Markets or any form of personal or investment advice.
Any opinions, news, research, analyses, prices, other information, or links to third-party sites contained on this website are provided on an "as-is" basis, are intended only to be informative, is not an advice nor a recommendation, nor research, or a record of our trading prices, or an offer of, or solicitation for a transaction in any financial instrument and thus should not be treated as such. The information provided does not involve any specific investment objectives, financial situation and needs of any specific person who may receive it. Please be aware, that past performance is not a reliable indicator of future performance and/or results. Past Performance or Forward-looking scenarios based upon the reasonable beliefs of the third-party provider are not a guarantee of future performance. Actual results may differ materially from those anticipated in forward-looking or past performance statements. IC Markets makes no representation or warranty and assumes no liability as to the accuracy or completeness of the information provided, nor any loss arising from any investment based on a recommendation, forecast or any information supplied by any third-party.
CADUSD trade ideas
USDCAD Massive Short! SELL!
My dear subscribers,
This is my opinion on the USDCAD next move:
The instrument tests an important psychological level 1.3730
Bias - Bearish
Technical Indicators: Supper Trend gives a precise Bearish signal, while Pivot Point HL predicts price changes and potential reversals in the market.
Target - 1.3668
My Stop Loss - 1.3761
About Used Indicators:
On the subsequent day, trading above the pivot point is thought to indicate ongoing bullish sentiment, while trading below the pivot point indicates bearish sentiment.
Disclosure: I am part of Trade Nation's Influencer program and receive a monthly fee for using their TradingView charts in my analysis.
———————————
WISH YOU ALL LUCK
USDCAD (U.S. Dollar/Canadian Dollar) long (buy) setupUSDCAD (U.S. Dollar/Canadian Dollar) long (buy) setup. Here's the breakdown:
**Setup Overview**
* **Entry Level:** Around 1.3700
* **Take Profit (TP):** 1.3812 (upper green zone)
* **Stop Loss (SL):** 1.3638 (lower red zone)
**Technical Observations**
* Price is bouncing from a rising trendline (diagonal black line), suggesting bullish support.
* Price is trading above the 50 EMA, 21 EMA, and 7 EMA — indicating bullish momentum.
* A strong bullish candle with high volume occurred before consolidation, showing buyer interest.
* Tight consolidation near the entry level suggests potential for a breakout continuation upward.
**Bias**
* **Bullish** bias as long as price remains above the trendline and EMAs.
* The trade offers a favorable risk-to-reward ratio, targeting a \~110 pip gain vs. \~60 pip risk.
*Summary**
The chart shows a bullish trade setup on USDCAD based on trendline support, EMA alignment, and volume confirmation. A breakout above 1.3700 aims for 1.3812, while invalidation lies below 1.3638.

USDCAD LongWe are looking to go long on this pair. It is on a Key Fibonacci level. We hoping to buy to the top of the FIB

USDCAD LONG DAILY FORECAST Q3 D14 W29 Y25USDCAD LONG DAILY FORECAST Q3 D14 W29 Y25
Professional Risk Managers👋
Welcome back to another FRGNT chart update📈
Diving into some Forex setups using predominantly higher time frame order blocks alongside confirmation breaks of structure.
Let’s see what price action is telling us today! 👀
💡Here are some trade confluences📝
✅Daily Order block identified
✅4H Order Block identified
✅1H Order Block identified
📈 Risk Management Principles
🔑 Core Execution Rules
Max 1% risk per trade — protect your capital, preserve your edge
Set alerts — let price come to your levels, not the other way around
Minimum 1:2 RR — if the reward doesn’t justify the risk, it’s not worth it
Focus on process, not outcomes — the outcome is random, your process is not
🧠 Remember: The edge lies in execution, not prediction. Your strategy is only as good as your discipline to follow it.
🧠 FRGNT Insight of the Day
"The market rewards structure and patience — not emotion or urgency."
Execute like a robot. Manage risk like a pro. Let the chart do the talking.
🏁 Final Words from FRGNT
📌 USDCAD is offering textbook alignment — structure, order flow, and confirmation are all in place.
📌 The opportunity is there — now it’s about how you show up to execute.
🎯 Trade with clarity. Act with conviction. Manage with precision.
🔑 Remember, to participate in trading comes always with a degree of risk, therefore as professional risk managers it remains vital that we stick to our risk management plan as well as our trading strategies.
📈The rest, we leave to the balance of probabilities.
💡Fail to plan. Plan to fail.
🏆It has always been that simple.
❤️Good luck with your trading journey, I shall see you at the very top.
🎯Trade consistent, FRGNT X

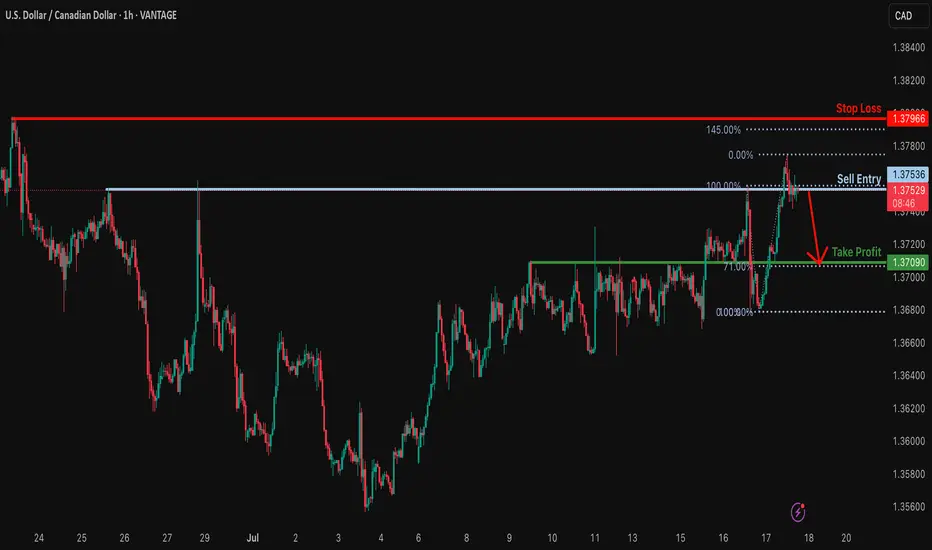
Bearish drop off pullback resistance?USD/CAD is reacting off the resistance level which is a pullback resistance and could reverse from this level to our take profit.
Entry: 1.3753
Why we like it:
There is a pullback resistance.
Stop loss: 1.3796
Why we like it:
There is a swing high resistance that is slightly above the 145% Fibonacci extension.
Take profit: 1.3709
Why we lik eit:
There is an overlap support that lines up with the 71% Fibonacci retracement.
Enjoying your TradingView experience? Review us!
Please be advised that the information presented on TradingView is provided to Vantage (‘Vantage Global Limited’, ‘we’) by a third-party provider (‘Everest Fortune Group’). Please be reminded that you are solely responsible for the trading decisions on your account. There is a very high degree of risk involved in trading. Any information and/or content is intended entirely for research, educational and informational purposes only and does not constitute investment or consultation advice or investment strategy. The information is not tailored to the investment needs of any specific person and therefore does not involve a consideration of any of the investment objectives, financial situation or needs of any viewer that may receive it. Kindly also note that past performance is not a reliable indicator of future results. Actual results may differ materially from those anticipated in forward-looking or past performance statements. We assume no liability as to the accuracy or completeness of any of the information and/or content provided herein and the Company cannot be held responsible for any omission, mistake nor for any loss or damage including without limitation to any loss of profit which may arise from reliance on any information supplied by Everest Fortune Group.
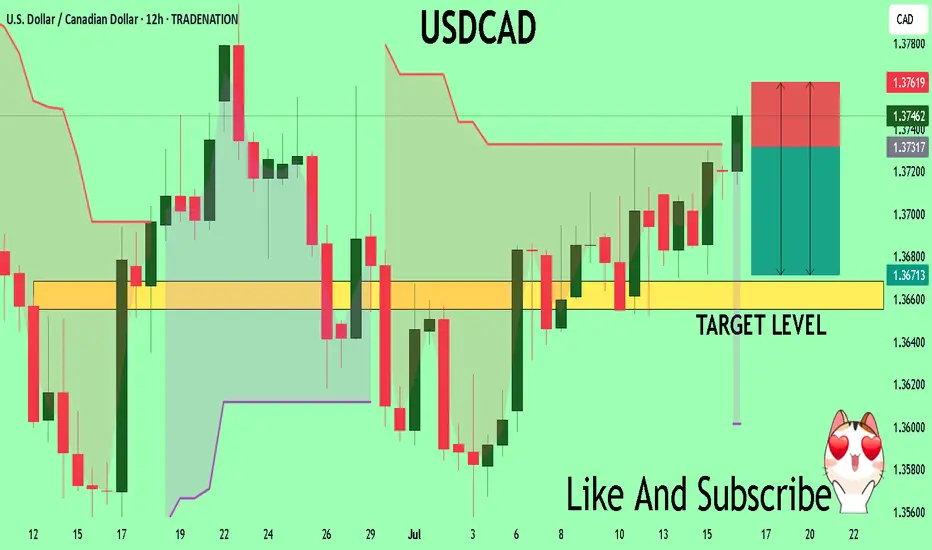
USDCAD oversold consolidation, resistance at 1.3760The USDCAD pair is currently trading with a bearish bias, aligned with the broader downward trend. Recent price action shows a retest of the previous resistance zone, suggesting a temporary sideways consolidation within the downtrend.
Key resistance is located at 1.3760, a prior consolidation zone. This level will be critical in determining the next directional move.
A bearish rejection from 1.3760 could confirm the resumption of the downtrend, targeting the next support levels at 1.3670, followed by 1.3650 and 1.3620 over a longer timeframe.
Conversely, a decisive breakout and daily close above 1.3760 would invalidate the current bearish setup, shifting sentiment to bullish and potentially triggering a move towards 1.3785, then 1.3800.
Conclusion:
The short-term outlook remains bearish unless the pair breaks and holds above 1.3760 Traders should watch for price action signals around this key level to confirm direction. A rejection favours fresh downside continuation, while a breakout signals a potential trend reversal or deeper correction.
This communication is for informational purposes only and should not be viewed as any form of recommendation as to a particular course of action or as investment advice. It is not intended as an offer or solicitation for the purchase or sale of any financial instrument or as an official confirmation of any transaction. Opinions, estimates and assumptions expressed herein are made as of the date of this communication and are subject to change without notice. This communication has been prepared based upon information, including market prices, data and other information, believed to be reliable; however, Trade Nation does not warrant its completeness or accuracy. All market prices and market data contained in or attached to this communication are indicative and subject to change without notice.
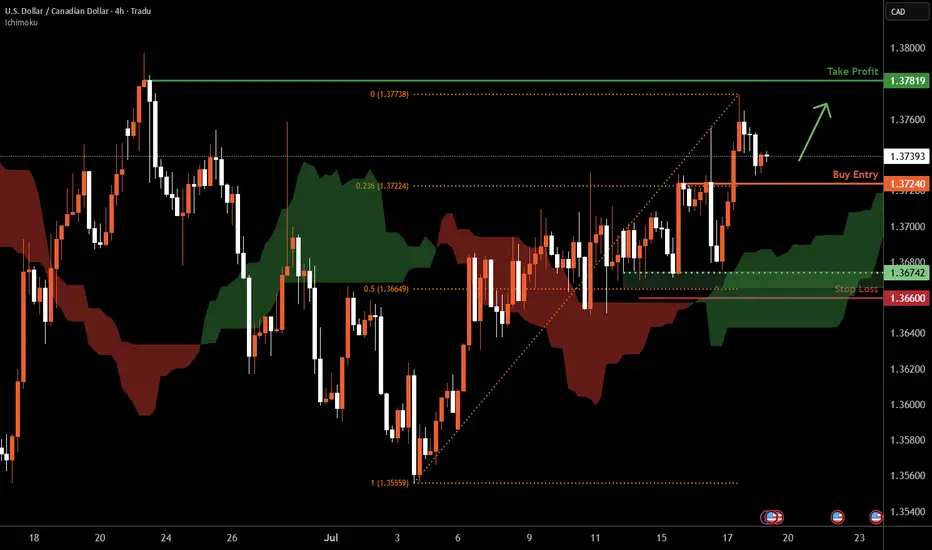
USD/CAD H4 | Potential bullish bounceUSD/CAD is falling towards a pullback support and could potentially bounce off this level to climb higher.
Buy entry is at 1.3724 which is a pullback support that aligns with the 23.6% Fibonacci retracement.
Stop loss is at 1.3660 which is a level that lies underneath a multi-swing-low support and the 50% Fibonacci retracement.
Take profit is at 1.3781 which is a swing-high resistance.
High Risk Investment Warning
Trading Forex/CFDs on margin carries a high level of risk and may not be suitable for all investors. Leverage can work against you.
Stratos Markets Limited (tradu.com ):
CFDs are complex instruments and come with a high risk of losing money rapidly due to leverage. 66% of retail investor accounts lose money when trading CFDs with this provider. You should consider whether you understand how CFDs work and whether you can afford to take the high risk of losing your money.
Stratos Europe Ltd (tradu.com ):
CFDs are complex instruments and come with a high risk of losing money rapidly due to leverage. 66% of retail investor accounts lose money when trading CFDs with this provider. You should consider whether you understand how CFDs work and whether you can afford to take the high risk of losing your money.
Stratos Global LLC (tradu.com ):
Losses can exceed deposits.
Please be advised that the information presented on TradingView is provided to Tradu (‘Company’, ‘we’) by a third-party provider (‘TFA Global Pte Ltd’). Please be reminded that you are solely responsible for the trading decisions on your account. There is a very high degree of risk involved in trading. Any information and/or content is intended entirely for research, educational and informational purposes only and does not constitute investment or consultation advice or investment strategy. The information is not tailored to the investment needs of any specific person and therefore does not involve a consideration of any of the investment objectives, financial situation or needs of any viewer that may receive it. Kindly also note that past performance is not a reliable indicator of future results. Actual results may differ materially from those anticipated in forward-looking or past performance statements. We assume no liability as to the accuracy or completeness of any of the information and/or content provided herein and the Company cannot be held responsible for any omission, mistake nor for any loss or damage including without limitation to any loss of profit which may arise from reliance on any information supplied by TFA Global Pte Ltd.
The speaker(s) is neither an employee, agent nor representative of Tradu and is therefore acting independently. The opinions given are their own, constitute general market commentary, and do not constitute the opinion or advice of Tradu or any form of personal or investment advice. Tradu neither endorses nor guarantees offerings of third-party speakers, nor is Tradu responsible for the content, veracity or opinions of third-party speakers, presenters or participants.
USD/CAD Institutional Buy Zone – Thief Trading Alert!🔥 USD/CAD "LOONIE BANK HEIST" 🔥 – THIEF TRADING STYLE (BULLISH SNIPER PLAN)
💸 ATTENTION: Market Robbers & Profit Pirates!
"Steal Like a Pro – Escape Before the Cops Arrive!"
🎯 MASTER TRADE PLAN (Based on Thief Trading Tactics):
Entry Zone (Pullback Heist):
📌 Pullback-1: Market Maker Trap Zone (1.35400+) – Wait for retest!
📌 Pullback-2: Institutional Buy Zone (1.33500+) – Confirm bullish momentum!
"Patience = Perfect Heist Timing. Don’t rush—ambush the trend!"
🎯 Profit Target: 1.38100 (or escape earlier if momentum fades).
🛑 Stop Loss (Escape Route): Nearest 4H Swing Low (wick/close) – Adjust based on risk & lot size!
🚨 SCALPERS’ WARNING:
"Only snipe LONG! Big pockets? Strike now. Small stack? Join swing robbers & trail your SL!"
📉 WHY THIS HEIST? (Bullish Triggers):
Technical + Fundamental alignment (COT, Macro, Sentiment).
Overbought but institutional demand holding strong.
"Bears are trapped—time to rob their stops!"
⚠️ CRITICAL ALERT:
News = Volatility = Police Ambush!
Avoid new trades during high-impact news.
Trailing SL = Your Getaway Car! Lock profits before reversals.
💥 BOOST THIS HEIST!
"Hit 👍, 🔔 Follow, and 🚀 Boost to fuel our next robbery! Let’s drain the banks together!"
🔮 NEXT HEIST COMING SOON… Stay tuned, partner! 🎭💰

US Dollar Strengthens Following Trump’s Tariff DecisionUS Dollar Strengthens Following Trump’s Tariff Decision
US President Donald Trump has announced his decision to impose new tariffs:
→ For Canada, tariffs are set at 35%. They are scheduled to take effect on 1 August, although negotiations may take place before this date, potentially influencing Trump’s final stance.
→ For many other countries, tariffs may be set at 15% or 20%;
→ For the European Union, the exact tariff levels have not yet been disclosed.
Overall, Trump’s latest comments have added to the uncertainty surrounding the specific tariffs to be applied to each country. The financial markets reacted as follows:
→ The US dollar strengthened against other currencies (including the Canadian dollar);
→ Equity markets saw a modest decline.
Technical Analysis of the USD/CAD Chart
As soon as the announcement of a 35% tariff on Canadian imports to the US was made public, the USD/CAD rate spiked sharply (as indicated by the arrow), reaching levels last seen at the end of June. In the hours that followed, the pair stabilised.
Taking a broader view, the chart appears to show a triangular formation, which consists of:
→ A descending resistance line (R);
→ A key support level (S) around 1.3570.
From this perspective, it is worth noting that the bulls’ attempt to break above the resistance line amid the 35% tariff news did not succeed, indicating strong selling pressure.
At the same time, the price action of USD/CAD in early July allows us to identify a local support level (marked by the blue line). This suggests that, for now, the pair is consolidating within a formation bounded by the blue support line and resistance line R.
However, how long this consolidation will last, and which direction the breakout will take, will most likely depend on the next round of news regarding US–Canada trade negotiations.
This article represents the opinion of the Companies operating under the FXOpen brand only. It is not to be construed as an offer, solicitation, or recommendation with respect to products and services provided by the Companies operating under the FXOpen brand, nor is it to be considered financial advice.

4 HOUR CONFIRMATION- USDCAD ENTRY UPDATEPrice tapped in our Weekly Demand ideal 👌 for long buys.
Previously i anticipated a trend shift H4 as guide , cmp price just break our int previous high meaning change a in trend as we anticipated
Now waiting for price to drop to our int demand then we rise or the breaker block can hold - major reactions

Bullish rise?USD/CAD has bounced off the support level which is a pullback support and could potentially rise from this level to our take profit.
Entry: 1.3660
Why we like it:
There is a a pullback support.
Stop loss: 1.3618
Why we like it:
There is a pullback support.
Take profit: 1.3780
Why we like it:
There is a pullback resistance.
Enjoying your TradingView experience? Review us!
Please be advised that the information presented on TradingView is provided to Vantage (‘Vantage Global Limited’, ‘we’) by a third-party provider (‘Everest Fortune Group’). Please be reminded that you are solely responsible for the trading decisions on your account. There is a very high degree of risk involved in trading. Any information and/or content is intended entirely for research, educational and informational purposes only and does not constitute investment or consultation advice or investment strategy. The information is not tailored to the investment needs of any specific person and therefore does not involve a consideration of any of the investment objectives, financial situation or needs of any viewer that may receive it. Kindly also note that past performance is not a reliable indicator of future results. Actual results may differ materially from those anticipated in forward-looking or past performance statements. We assume no liability as to the accuracy or completeness of any of the information and/or content provided herein and the Company cannot be held responsible for any omission, mistake nor for any loss or damage including without limitation to any loss of profit which may arise from reliance on any information supplied by Everest Fortune Group.

USDCAD bearish view
OANDA:USDCAD again on this pair, first analysis accurate, in new look having bearish view, price in PA moving, still we having nice structure, price is now come back in channel, looks like breaking first channel, which will take for confirmation and sign for bearish expectations.
SUP zone: 1.37400
RES zone: 1.36400, 1.36100

USDCAD - Bullish Falling WedgeHello Traders !
On Thursday 3 July, The USDCAD reached the support level (1.35400 - 1.35706).
The price formed a falling wedge pattern.
Currently, The resistance line is broken!
So, I expect a bullish move🚀
______________
TARGET: 1.37490🎯

14.07.2025 #USDCADBUY 1.36750 | SROP 1.36400 | STOP 1.37310 | Price movement within the local ascending channel.

USD/CAD is ready for takeoff.A highly strong trend is underway.
Based on market structure, USD/CAD is moving toward the 50% level of the daily bearish leg, and any resistance in its path is likely to be crushed.

Buy entry on USDCADPrice formed a double bottom, coincidently rejecting the upper trendline in higher time frame. Anticipate the long and TP at 1:1 DB formation.
Long USDCAD
The streets all knows about this pair..
Risk little percentage of your portfolio, while it will take weeks for it to fully develop by continually adding to your positions
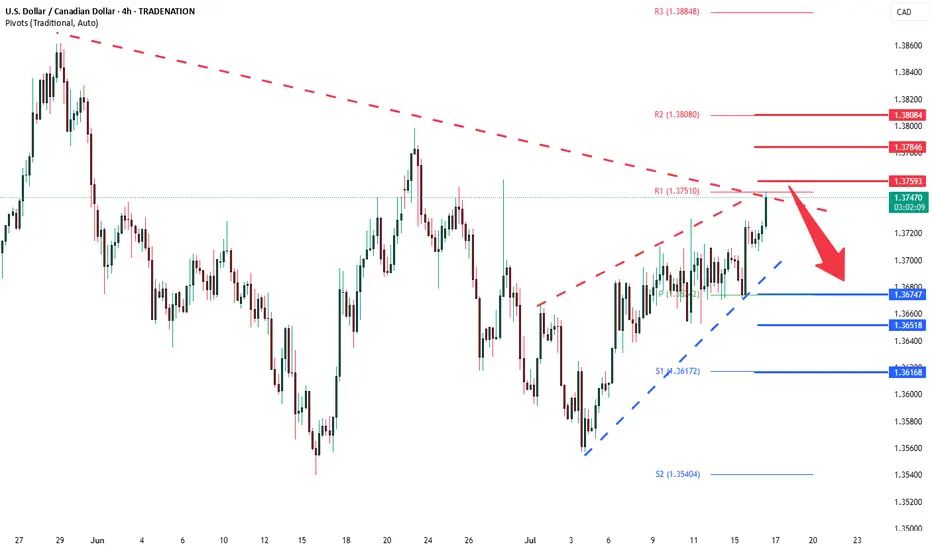
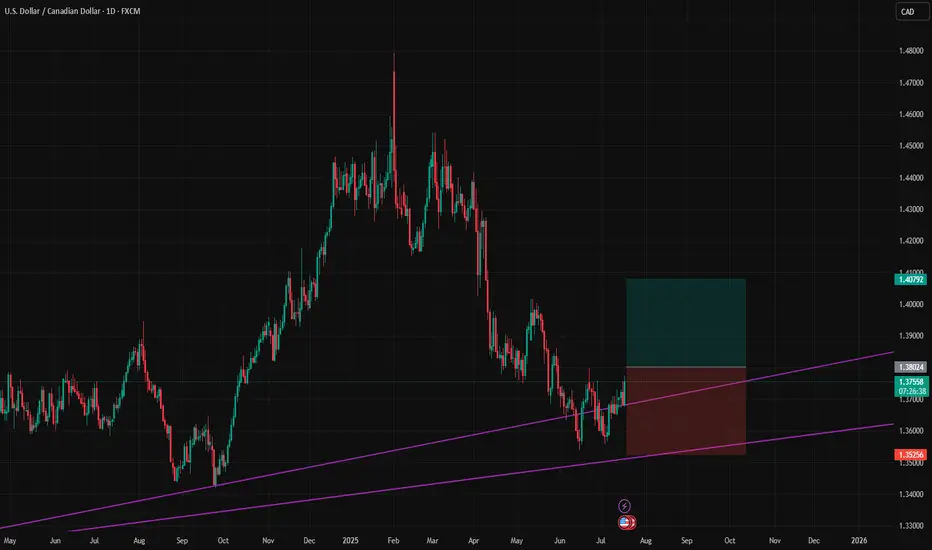
USDCAD is breaking the trendline againOnce again, FX_IDC:USDCAD is breaking its medium-term downside resistance line, drawn from the current highest point of this year. If the rate remains above it, we may see a few more bulls stepping in. Let's take a look.
MARKETSCOM:USDCAD
Let us know what you think in the comments below.
Thank you.
75.2% of retail investor accounts lose money when trading CFDs with this provider. You should consider whether you understand how CFDs work and whether you can afford to take the high risk of losing your money. Past performance is not necessarily indicative of future results. The value of investments may fall as well as rise and the investor may not get back the amount initially invested. This content is not intended for nor applicable to residents of the UK. Cryptocurrency CFDs and spread bets are restricted in the UK for all retail clients.

USDCAD D1 (Wave Analysis) - 11/7/2025USDCAD D1 (Wave Analysis) - 11/7/2025
As shown in chart, impulse Wave a or 1 is almost finished and we will go to corrective = wave b or 2.
as shown
regards,

Potential bearish drop?The Loonie (USD/CAD) has rejected off the pivot, which has been identified as an overlap resistance and could drop to the 61.8% Fibonacci support.
Pivot: 1.3688
1st Support: 1.3599
1st Resistance: 1.3743
Risk Warning:
Trading Forex and CFDs carries a high level of risk to your capital and you should only trade with money you can afford to lose. Trading Forex and CFDs may not be suitable for all investors, so please ensure that you fully understand the risks involved and seek independent advice if necessary.
Disclaimer:
The above opinions given constitute general market commentary, and do not constitute the opinion or advice of IC Markets or any form of personal or investment advice.
Any opinions, news, research, analyses, prices, other information, or links to third-party sites contained on this website are provided on an "as-is" basis, are intended only to be informative, is not an advice nor a recommendation, nor research, or a record of our trading prices, or an offer of, or solicitation for a transaction in any financial instrument and thus should not be treated as such. The information provided does not involve any specific investment objectives, financial situation and needs of any specific person who may receive it. Please be aware, that past performance is not a reliable indicator of future performance and/or results. Past Performance or Forward-looking scenarios based upon the reasonable beliefs of the third-party provider are not a guarantee of future performance. Actual results may differ materially from those anticipated in forward-looking or past performance statements. IC Markets makes no representation or warranty and assumes no liability as to the accuracy or completeness of the information provided, nor any loss arising from any investment based on a recommendation, forecast or any information supplied by any third-party.

USDCAD's Opportunity Bell Is Ringing — Don’t Miss Out!Hey there, my valued friends!
I’ve prepared a fresh USDCAD analysis just for you.
📌 If the 1.37245 level breaks, the next target will be 1.38000.
Every single like you send my way is the biggest motivation behind sharing these analyses.
🙌 Huge thanks to each and every one of you who supports me!
Would you like to add a visual or a catchy headline to boost engagement even more? I can help with that too.

USDCAD LONG DAILY FORECAST Q3 D11 W28 Y25USDCAD LONG DAILY FORECAST Q3 D11 W28 Y25
It’s Fun Coupon Friday! 💸🔥
Professional Risk Managers👋
Welcome back to another FRGNT chart update📈
Diving into some Forex setups using predominantly higher time frame order blocks alongside confirmation breaks of structure.
Let’s see what price action is telling us today! 👀
💡Here are some trade confluences📝
✅Daily Order block identified
✅4H Order Block identified
✅1H Order Block identified
🔑 Remember, to participate in trading comes always with a degree of risk, therefore as professional risk managers it remains vital that we stick to our risk management plan as well as our trading strategies.
📈The rest, we leave to the balance of probabilities.
💡Fail to plan. Plan to fail.
🏆It has always been that simple.
❤️Good luck with your trading journey, I shall see you at the very top.
🎯Trade consistent, FRGNT X
