UsdcadSorry I posted be4 I made a mistake in the pairs I was to post my usdcad trade the 1 I posted was the wan I had privately and was a mistake
CADUSD trade ideas

USD/CADThe pair has been in a clear downtrend, forming a bottom around the 1.3665 area, followed by a noticeable bullish rebound with consecutive bullish candles.
Key Support Zone:
1.3665 – Represents the recent bottom and a significant reversal point.
Upcoming Resistance Levels:
1.3818: A horizontal resistance that has been tested multiple times and is close to the current price.
1.3860 – 1.3880: A strong resistance zone, marking a previous reversal point.
1.3920 – 1.3950: The next resistance zone after a breakout, corresponding to a prior lower high.
Bullish Scenario (currently more likely):
If the upward momentum continues, price may reach the 1.3860 zone and potentially break above it toward 1.3920, provided it stabilizes above 1.3818.
Bearish Scenario (if the rally fails):
If the price forms a reversal candle near 1.3818 and fails to break through, a pullback may occur toward 1.3730, and possibly retest 1.3665.

USD/CAD Bulls Emerge at Confluent SupportUSD/CAD has responded to confluent support at 1.3714/29 - a region defined by the 78.6% retracement of the September rally and the 38.2% retracement of the 2021 advance. Note that the 25% parallel of the descending pitchfork converges on this threshold over the next few days and a break / close below is needed to fuel the next leg of the decline / mark downtrend resumption.
Initial resistance is eyed with the 61.8% retracement of the late 2023 advance / May open at 1.3794/98 and is backed closely by the median-line. Rallies should be limited to this slope IF price is heading lower on this stretch with a break / close below this pivot zone exposing subsequent objectives at 1.3590- 1.3614 and 1.3504/23 . Broader bearish invalidation extends into the 200-day moving average at 1.3990-1.4019 .
-MB

USD/CAD Defends Support but Bears Still LurkingUSD/CAD is clinging to key horizontal support around 1.3780 after a recent sharp decline:
Support Retest: Price briefly dipped below the 1.3780 area before buyers stepped in, forming a potential short-term base.
Downtrend Intact: Price remains well below both the 50- and 200-day SMAs, which are beginning to fan out—an increasingly bearish configuration.
Momentum Weak: MACD is negative and RSI is hovering just above oversold territory (~38), suggesting continued bearish pressure despite the bounce.
Critical Levels: A break below 1.3780 could open the door to 1.3420 (October support), while upside recovery would need a move above the 200-day (~1.40) to shift the broader tone.
The bounce may offer a short-term reprieve, but unless bulls reclaim trend-defining moving averages, the bears remain in control.
-MW

USDCAD: Strong Bearish Confirmation ?! 🇺🇸🇨🇦
I see an important sign of strength of the sellers on USDCAD
on an hourly time frame after a release of the today's US fundamentals.
The price violated a support line of a horizontal range and is retesting
that at the moment.
I believe that the price may drop at least to1.374 level soon.
❤️Please, support my work with like, thank you!❤️
I am part of Trade Nation's Influencer program and receive a monthly fee for using their TradingView charts in my analysis.

chakalaka @ Lap forex groupUSDCAD Potential selling continuation towards 1.34500 , fair entry with a good risk reward ratio is indicated on my analysis ...swing trading is the safest way to trade

Hourly bearish retraceFibonacci tool pegged to a high and low where the retrace levels have confluence with previous swing support and resistances.
RSI getting close to overbought levels.
The recent higher lows and higher highs could be setting up for a bear flag.
How high will this bearish retrace go?

USD CAD Broken his important supportUSDCAD has broken its important support at 1.38082 and is looking for an opportunity to reach its next target at 1.34279.

Usdcad I had this position this morning we have a good counter trend trade is a high probability trade am on a buy too on usdcad

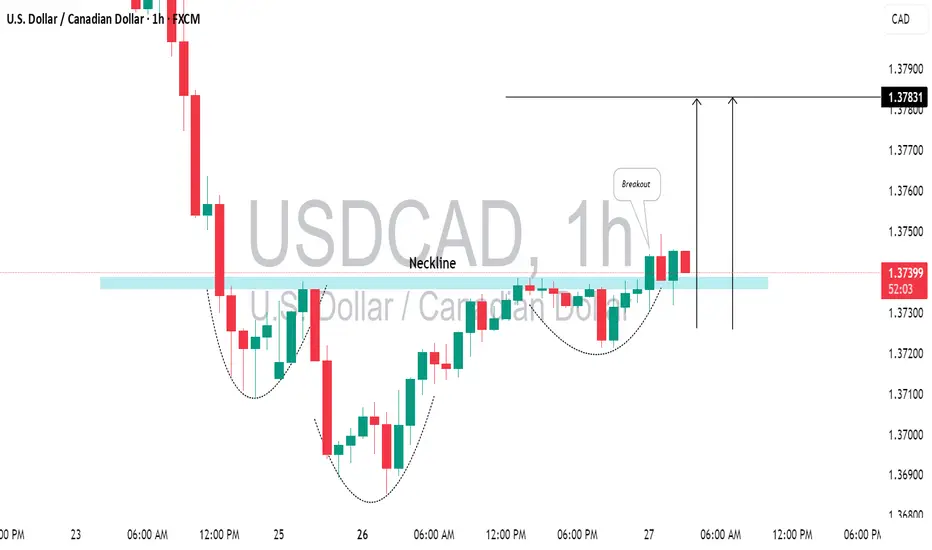
USDCAD: Bullish Reversal Confirmed?!The USDCAD formed an inverted head and shoulders pattern on hourly chart, indicating a strong bullish reversal with its neckline breakout.
This broken neckline now serves as important support, suggesting a potential rise to at least the 1.3783 level.
Trading Opportunity: USDCAD Long SetupGood morning All,
I've been analysing the USDCAD pair and noticed it's been oversold for some time. It just reached the midband of the falling channel yesterday, which suggests a potential long opportunity to me. I believe this setup offers a favourable risk-to-reward ratio of 1:2. Here are the details:
- Entry Point: 1.3734
- Take Profit (TP): 1.3888
- Stop Loss (SL): 1.3657
Wishing you all the best with your trades!
Ehsan

SNAP SHORT USDCAD SHORT FORECAST Q2 W22 D27 Y25🔥👀USDCAD SHORT FORECAST Q2 W22 D27 Y25
Professional Risk Managers👋
Welcome back to another FRGNT chart update📈
Diving into some Forex setups using predominantly higher time frame order blocks alongside confirmation breaks of structure.
💡Here are some trade confluences📝
✅4H Order block
✅4H 50 EMA
✅Intraday bearish breaks of structure
✅15’ order block identified
🔑 Remember, to participate in trading comes always with a degree of risk, therefore as professional risk managers it remains vital that we stick to our risk management plan as well as our trading strategies.
📈The rest, we leave to the balance of probabilities.
💡Fail to plan. Plan to fail.
🏆It has always been that simple.
❤️Good luck with your trading journey, I shall see you at the very top.
🎯Trade consistent, FRGNT X

USD-CAD Bearish Bias! Sell!
Hello,Traders!
USD-CAD is trading in a
Downtrend and the pair
Made a bearish breakout
Of the key horizontal level
Of 1.3774 which is now a
Resistance and the pair is
Making a local pullback
To retest the new resistance
From where we will be
Expecting a further
Bearish continuation
Sell!
Comment and subscribe to help us grow!
Check out other forecasts below too!
Disclosure: I am part of Trade Nation's Influencer program and receive a monthly fee for using their TradingView charts in my analysis.

USDCADI'm waiting for a breakout retracement especially from lower timeframe like H4 then sell the market

Check the trend It is expected that after some fluctuation and correction in the resistance area, the downtrend will continue. If the price breaks through the resistance area, it can rise to the resistance trend line.

USDCAD: Long Trade with Entry/SL/TP
USDCAD
- Classic bullish formation
- Our team expects pullback
SUGGESTED TRADE:
Swing Trade
Long USDCAD
Entry - 1.3731
Sl - 1.3673
Tp - 1.3833
Our Risk - 1%
Start protection of your profits from lower levels
Disclosure: I am part of Trade Nation's Influencer program and receive a monthly fee for using their TradingView charts in my analysis.
❤️ Please, support our work with like & comment! ❤️

USDCAD: Bearish Outlook For This Week Explained 🇺🇸🇨🇦
USDCAD will likely continue a bearish trend that the market
established in February.
A bearish breakout of a support line of a horizontal parallel
channel on a daily provides a strong confirmation.
Next goal - 1.3655
❤️Please, support my work with like, thank you!❤️
I am part of Trade Nation's Influencer program and receive a monthly fee for using their TradingView charts in my analysis.

USD/CAD - continues the downtrendOn USD/CAD , it's nice to see a strong sell-off from the price of 1.37540 and 1.38150 . It's also encouraging to observe a strong volume area where a lot of contracts are accumulated.
I believe that sellers from this area will defend their short positions. When the price returns to this area, strong sellers will push the market down again.
Strong S/R zone from the past and high volume cluster are the main reasons for my decision to go short on this trade.
Happy trading,
Dale

Perfect buy level usdcadOur last selling idea almost hited tp
Now we looking it for buy side
Wait to reached our level then enter into buy with confirmation

USDCAD - NEW BREAKDOWN !Hello Traders !
After a huge bearish move, The USDCAD price broke the support level (1.37506 - 1.37814).
This key level becomes new resistance!
So, I expect a new bearish move📉
_______________
TARGET: 1.36480🎯

USDCAD DECLINES FURTHER!!Price declined further in the past few days and reacts in an ascending trend line . This is a crucial point where we could either see price drop further. I expect a weaker USD.

Market Analysis: USD/CAD Declines SteadilyMarket Analysis: USD/CAD Declines Steadily
USD/CAD declined and now is consolidating below the 1.3800 level.
Important Takeaways for USD/CAD Analysis Today
- USD/CAD started a fresh decline after it failed to clear the 1.4000 resistance.
- There is a connecting bearish trend line with resistance at 1.3740 on the hourly chart at FXOpen.
USD/CAD Technical Analysis
On the hourly chart of USD/CAD at FXOpen, the pair climbed toward the 1.3900 resistance zone before the bears appeared. The US Dollar formed a swing high near 1.3890 and recently declined below the 1.3800 support against the Canadian Dollar.
There was also a close below the 50-hour simple moving average and 1.3750. The bulls are now active near the 1.3700 level, but they might fail to protect more losses. If there is an upside correction, the pair could face resistance near the 1.3740 level.
There is also a connecting bearish trend line with resistance at 1.3740. The trend line is near the 23.6% Fib retracement level of the downward move from the 1.3888 swing high to the 1.3694 low.
If there is a fresh increase, the pair could face resistance near the 1.3790 level. It is close to the 50% Fib retracement level of the downward move from the 1.3888 swing high to the 1.3694 low. The next key resistance on the USD/CAD chart is near the 1.3815 level.
If there is an upside break above 1.3815, the pair could rise toward the 1.3890 resistance. The next major resistance is near the 1.3935 level, above which it could rise steadily toward the 1.4000 resistance zone.
Immediate support is near the 1.3695 level. The first major support is near 1.3660. A close below the 1.3660 level might trigger a strong decline. In the stated case, USD/CAD might test 1.3600. Any more losses may possibly open the doors for a drop toward the 1.3550 support.
This article represents the opinion of the Companies operating under the FXOpen brand only. It is not to be construed as an offer, solicitation, or recommendation with respect to products and services provided by the Companies operating under the FXOpen brand, nor is it to be considered financial advice.

USDCAD | 23.05.2025BUY 1.37750 | STOP 1.37000 | TAKE 1.38800 | Formation of a short-term corrective reversal from an important support range.
