USD/CAD(20250516)Today's AnalysisMarket news:
Fed Chairman Powell: The Fed is adjusting its overall policy-making framework. Zero interest rate is no longer a basic situation. The wording of underemployment and average inflation rate needs to be reconsidered. PCE is expected to drop to 2.2% in April.
Technical analysis:
Today's buying and selling boundaries:
1.3972
Support and resistance levels:
1.4020
1.4002
1.3990
1.3953
1.3941
1.3923
Trading strategy:
If the price breaks through 1.3972, consider buying, the first target price is 1.3990
If the price breaks through 1.3953, consider selling, the first target price is 1.3941
CADUSD trade ideas

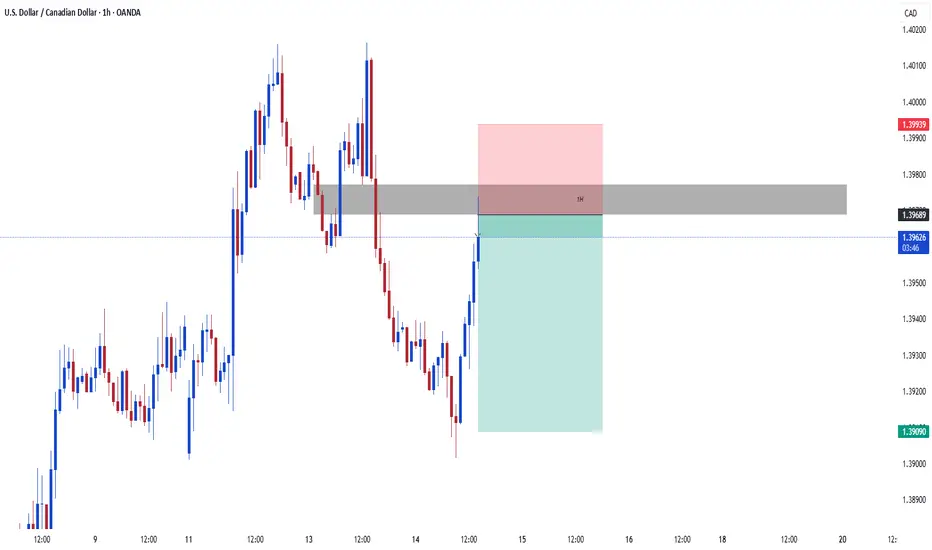
OUTLOOK ON USDCADUSDCAD broke proper structure on daily timeframe , showing us its change of character and we will be looking for sells from the OB that caused the impulsive move to the downside.
currently looking at a sell on USDCAD , but further confirmation is needed before I take the trade.

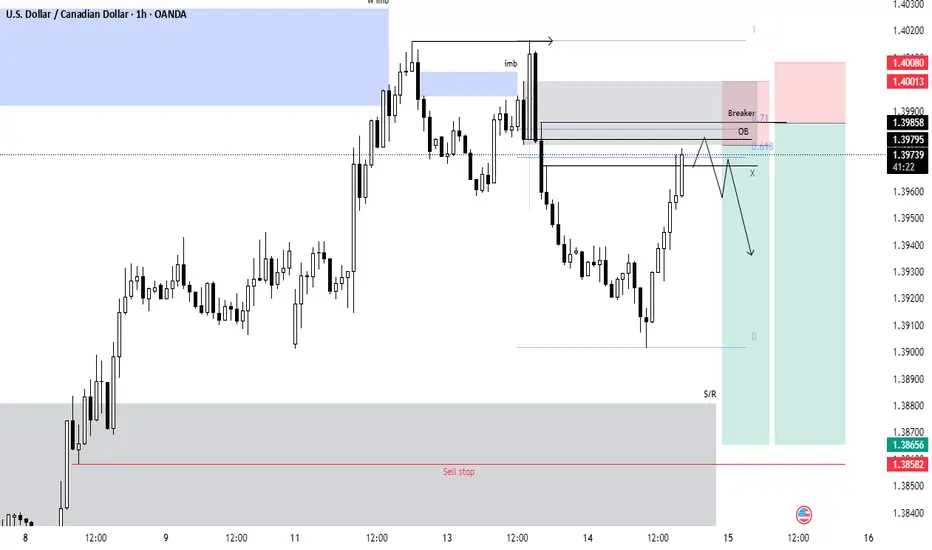
USDCAD (BOS 4H + Demand + OTE)Hello Traders!
We have BOS on 4H, in OTE zone - unmitigated Demand and OB. After closing IMB we can expect reversal. Demand can be also liquidity, because it is a reason to mitigate our OB.
Set alarms and wait for confirmation on LTF!
PS. Price must build liquidity to our POI, not impulse.
TP - new HH.
Have a profitable day and don't forget to subscribe for updates!

USDCAD SHORT FORECAST Q2 W20 D16 Y25USDCAD SHORT FORECAST Q2 W20 D16 Y25
Professional Risk Managers👋
Welcome back to another FRGNT chart update📈
Diving into some Forex setups using predominantly higher time frame order blocks alongside confirmation breaks of structure.
Let’s see what price action is telling us today!
💡Here are some trade confluences📝
✅Intraday breaks of structure
✅Tokyo ranges to be filled
✅15' order block identified
✅4 Hour order block
✅4 Hour 50 EMA
🔑 Remember, to participate in trading comes always with a degree of risk, therefore as professional risk managers it remains vital that we stick to our risk management plan as well as our trading strategies.
📈The rest, we leave to the balance of probabilities.
💡Fail to plan. Plan to fail.
🏆It has always been that simple.
❤️Good luck with your trading journey, I shall see you at the very top.
🎯Trade consistent, FRGNT X

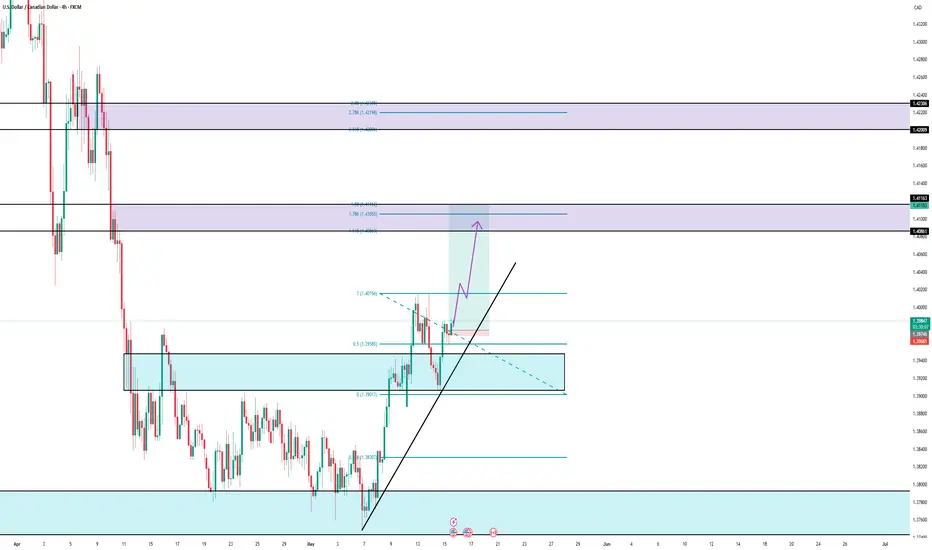
USDCAD: Bullish Wave on the Horizon?USDCAD: Bullish Wave on the Horizon?
From early April to early May, USDCAD moved within a broad accumulation pattern without a clear direction.
However, in the past week, the pair made its first bullish wave, climbing nearly 260 pips.
Now, USDCAD appears to be accumulating once again, potentially setting up for another bullish wave.
If this momentum continues, the price may extend toward the 1.4100 and 1.4200 levels.
You may find more details in the chart!
Thank you and Good Luck!
❤️PS: Please support with a like or comment if you find this analysis useful for your trading day❤️
Disclosure: I am part of Trade Nation's Influencer program and receive a monthly fee for using their TradingView charts in my analysis.

USD/CAD long positionEntry: Long at 1.3850
Stop Loss: 1.3775
Risk: 5 positions, each with 0.1% risk (total 0.5%)
Outlook: Medium-term (days to weeks)
Notes: Acknowledges potential downside to 1.36 if 1.38 breaks. Will consider re-entry at 1.36 if stopped out.


USDCAD Is Bullish! Long!The USD/CAD exchange rate consolidated near 1.3980 during the European trading session, after the Canadian dollar (CAD) came under pressure due to falling crude oil prices, enabling the pair to recover earlier losses. Given that Canada is the largest crude oil exporter to the U.S., declining oil prices typically dampen CAD sentiment.
USD/CAD is displaying a complex technical trend. On the daily chart, the price is currently consolidating around the 1.3980 level. The pair has rebounded from a recent low of 1.3749 and is now attempting to break through the key psychological barrier of 1.4000. If it can surpass both the 1.4000 psychological level and the 1.4050 resistance, further upside toward 1.4150 could be possible. On the downside, key support lies at 1.3890 (the lower edge of the recent consolidation range) and 1.3749 (the recent low).
you are currently struggling with losses, or are unsure which of the numerous trading strategies to follow, at this moment, you can choose to observe the operations within our channel.

Long trade
1Hr TF overview
30 TF entry
🟩 Buyside Trade Log
📈 Pair: USD/CAD
🏷️ Type: Intraday | Tokyo Session PM
🧠 Setup: Breakout
🆔 Trade ID: #USDCAD-0512A
📅 Date: Monday, 12th May 2025
🕔 Time: 5:00 PM
🔹 Entry Price: 1.39273
🔹 Profit Target: 1.41764 (+1.79%)
🔹 Stop Loss: 1.38991 (-0.20%)
🔹 Risk-Reward Ratio: 8.83
🔍 Reasoning: Price action context
Buyside trade initiated based on Wyckoff methodology, identifying accumulation phases during the Tokyo PM session. Breakout entry was timed as price moved out of the accumulation zone, aligning with Phase D, where price begins to mark up toward higher liquidity zones.

usdcad RBR demand zone O/S range here we have a clear rally base rally outside the range on usd-cad. On the 5 min we had a strong move away. the market then gave us a great fair value. big range allowing us a lot of room for profit. the market tapped into the zone the second time on May 14th 5 days after its creation


DECISION OF THE CHIEF VILLAGE BEARJust yesterday, the bears in the woods came into the city, we travelled all the way into Arkansas on AUDUSD but were later deported back to Australia after we hit a Stop loss (a rough ride I must add). Afterwards, the village Chief Bear called for a Bear meeting earlier today and I was present in that meeting. We did not like the deportation style and I could tell you that emotions were heightened in that meeting...damn!.
CONCLUSION: The Village Chief Bear decided to send some mercenaries yet again into the city to scout for a flowing river full of fish and also a very nice bee hive, large enough to feed the community, and I am one of them. To carry this out, we need an FVG at a region where we observed some foul play of price. Price action demands that it will come back to that region and as such, we took our strike almost after everything SEEMS right.
I am with a bag of fish just incase we get ambushed (do with this info whatever you can), I hope we won't be jailed before being deported this time.
USDCAD Is Bullish! Long!
Here is our detailed technical review for USDCAD.
Time Frame: 1h
Current Trend: Bullish
Sentiment: Oversold (based on 7-period RSI)
Forecast: Bullish
The market is trading around a solid horizontal structure 1.398.
The above observations make me that the market will inevitably achieve 1.401 level.
P.S
We determine oversold/overbought condition with RSI indicator.
When it drops below 30 - the market is considered to be oversold.
When it bounces above 70 - the market is considered to be overbought.
Disclosure: I am part of Trade Nation's Influencer program and receive a monthly fee for using their TradingView charts in my analysis.
Like and subscribe and comment my ideas if you enjoy them!

USDCAD POTENTIAL TO CONTINUE RALLYGood evening to all trader!!
Here my analysis which i focus on the trend. The news about tariff was one the most hot topic. Based on fundamental analysis with the news come up in this week. Im looking for another shot with strong TVC:DXY
The Purple zone as Resistance and The Blue Zone as Support
Have a good day and stay safe with the market always.

Short budddyyy!!!
1.39400 close below this area within 12 more hours…
My break of structure
Divergence
Nsync
And price action confluences have been met.
I have a short bias for the rest of the trading day.
We might reach a little higher before my anticipation of this pair going short.
What are your thoughts?
Trade safely my friend’s

USDCAD short limitShort limit, wait for breakdown this resistant line with a short -term target of at least 10%+ from here.

USD/CAD For Bullishwait for pull-back near by entry point and then go long
general trend is up trend
have fun :)

USDCAD: Short Signal Explained
USDCAD
- Classic bearish formation
- Our team expects fall
SUGGESTED TRADE:
Swing Trade
Sell USDCAD
Entry Level - 1.3963
Sl - 1.4002
Tp - 1.3895
Our Risk - 1%
Start protection of your profits from lower levels
Disclosure: I am part of Trade Nation's Influencer program and receive a monthly fee for using their TradingView charts in my analysis.
❤️ Please, support our work with like & comment! ❤️

USDCADHello Traders! 👋
What are your thoughts on USDCAD?
This pair found support at the bottom of the channel and a key support zone, triggering the beginning of a bullish move.
We now expect the price to consolidate briefly within this support area, and then continue moving upward toward the specified targets.
Will this support hold and drive the next leg higher? Share your thoughts below!
Don’t forget to like and share your thoughts in the comments! ❤️

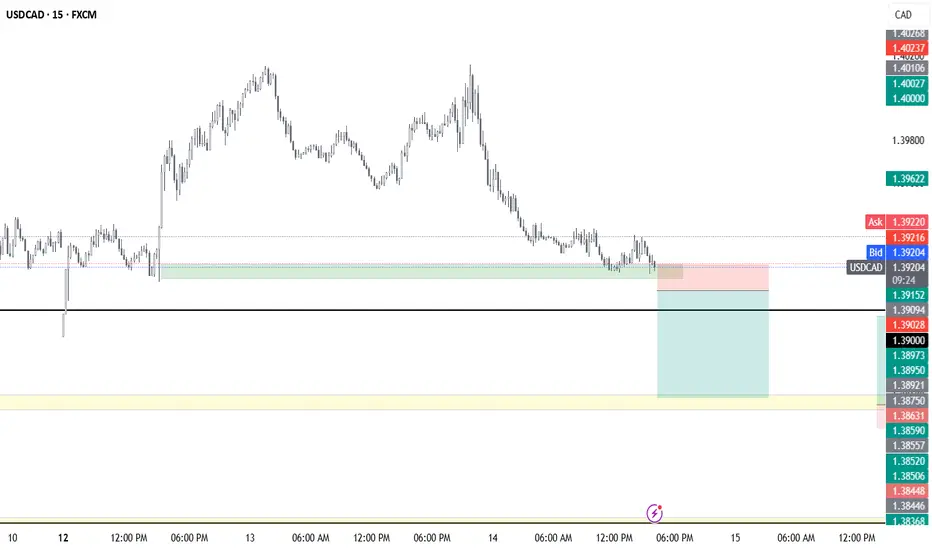
USDCAD SELL SETUP📉 USDCAD SELL SETUP – May 14, 2025( This setup wait for the a bearish candle - might be around NY open)
🔻 Entry: 1.39094
🎯 TP: 1.38590 (🟢 50 PIPS)
🛑 SL: 1.39216 (🔴 12 PIPS)
⚖️ RRR: 1:4.1 ✅
📍 Confluences:
🔸 Clean break + retest from support turned resistance
🔸 Price sitting just below H1 supply zone — weak bullish pressure
🛡 SL Guidance:
Once price makes a new M5/M15 low, SL can be manually adjusted to 15 pips max to trail smartly and protect profit. 🎯
USDCAD MARKET FORECASTLooking into this pair which is developing Nicely! Let's look this with a close eye guys!
