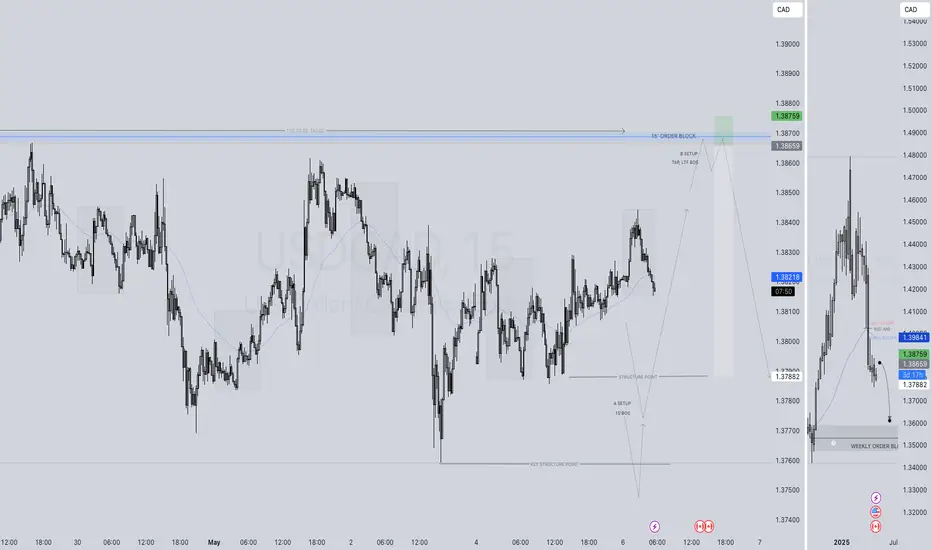
USDCAD SHORT FORECAST Q2 W19 D7 Y25USDCAD SHORT FORECAST Q2 W19 D7 Y25
Professional Risk Managers👋
Welcome back to another FRGNT chart update📈
Diving into some Forex setups using predominantly higher time frame order blocks alongside confirmation breaks of structure.
Let’s see what price action is telling us today!
💡Here are some trade confluences📝
✅Intraday breaks of structure
✅Tokyo ranges to be filled
✅15' order block identified
✅ inconclusive regarding 15' mitigated, therefore 5' order block identified after potential 15' mitigation
✅4 Hour order block
✅4 Hour 50 EMA
🔑 Remember, to participate in trading comes always with a degree of risk, therefore as professional risk managers it remains vital that we stick to our risk management plan as well as our trading strategies.
📈The rest, we leave to the balance of probabilities.
💡Fail to plan. Plan to fail.
🏆It has always been that simple.
❤️Good luck with your trading journey, I shall see you at the very top.
🎯Trade consistent, FRGNT X
CADUSD trade ideas

USDCAD → Storming the support level to break throughFX:USDCAD continues to storm support within the trading range amid a global downtrend
The currency pair is within the range, but the battle for support continues. The reaction to false breakouts is weakening and the price continues to attack the 1.378 level, which only increases the chances of a further decline
The dollar is rebounding from resistance and beginning to fall, which is having a corresponding effect on USDCAD. If the currency pair breaks 1.378 and consolidates below the level, this could trigger a continuation of the trend after consolidation...
Resistance levels: 1.381, 1.383
Support levels: 1.378, 1.374
Focus on the lower boundary of the trading range at 1.378. The role of the range is consolidation against the backdrop of a downtrend. Thus, a breakout of support will activate the distribution phase
Best regards, R. Linda!

USDCAD Is Bullish! Long!
Here is our detailed technical review for USDCAD.
Time Frame: 12h
Current Trend: Bullish
Sentiment: Oversold (based on 7-period RSI)
Forecast: Bullish
The market is approaching a significant support area 1.378.
The underlined horizontal cluster clearly indicates a highly probable bullish movement with target 1.399 level.
P.S
Overbought describes a period of time where there has been a significant and consistent upward move in price over a period of time without much pullback.
Disclosure: I am part of Trade Nation's Influencer program and receive a monthly fee for using their TradingView charts in my analysis.
Like and subscribe and comment my ideas if you enjoy them!

BUY USDCAD for bearish false breakout STOP LOSS : STOP LOSS BUY USDCAD for bearish false breakout
STOP LOSS : STOP LOSS position is left opened ( am only closing this trade based on a candle stick pattern)
First what is false breakout, A false breakout in Forex occurs when the price breaks through a key level (like support or resistance) but quickly reverses and returns to its original range, often trapping traders who were expecting a continuation of the breakout. It's essentially a false signal, indicating a potential trend reversal or continuation, but the price doesn't follow through....
Secondly what is divergence ,In forex trading, divergence occurs when the price of a currency pair moves in one direction, while a technical indicator (like an oscillator) moves in the opposite direction. This mismatch can signal a potential trend reversal or weakening trend. There are two main types: bullish and bearish divergence........
On this trade we are taking it because we saw regular bullish Divergence,
Regular Bullish Divergence
In case of Regular Bullish Divergence:
* The Indicator shows Higher Lows
* Actual Market Price shows Lower Lows
We can see a strong divergence on the RSI already and There is a strong trend reversal on the daily time frame chart.....
The daily time frame is showing strength of trend reversal from this strong level of Support so we are looking for the trend reversal and correction push from here .....
TAKE PROFIT : take profit will be when the trend comes to an end, feel from to send me a direct DM if you have any question about take profit or anything
Remember to risk only what you are comfortable with…….trading with the trend, patient and good risk management is the key to success here
Usdcad PWL?!Good day traders, we back with USDCAD on the 4h TF. Well for this setup I am looking for price to take out out previous week low, previous week we had a candle stick pattern recognition after we saw price move lower but failing to close lower told a different story that price is not yet ready to start moving higher which honestly speaking was my bias last week. For the rest of the day I believe we can expect lower prices to close the day.

USDCAD SHORT FORECAST Q2 W19 D6 Y25USDCAD SHORT FORECAST Q2 W19 D6 Y25
Professional Risk Managers👋
Welcome back to another FRGNT chart update📈
Diving into some Forex setups using predominantly higher time frame order blocks alongside confirmation breaks of structure.
Let’s see what price action is telling us today!
💡Here are some trade confluences📝
✅Intraday breaks of structure
✅Tokyo ranges to be filled
✅15' order block identified
✅ inconclusive regarding 15' mitigated, therefore 5' order block identified after potential 15' mitigation
🔑 Remember, to participate in trading comes always with a degree of risk, therefore as professional risk managers it remains vital that we stick to our risk management plan as well as our trading strategies.
📈The rest, we leave to the balance of probabilities.
💡Fail to plan. Plan to fail.
🏆It has always been that simple.
❤️Good luck with your trading journey, I shall see you at the very top.
🎯Trade consistent, FRGNT X
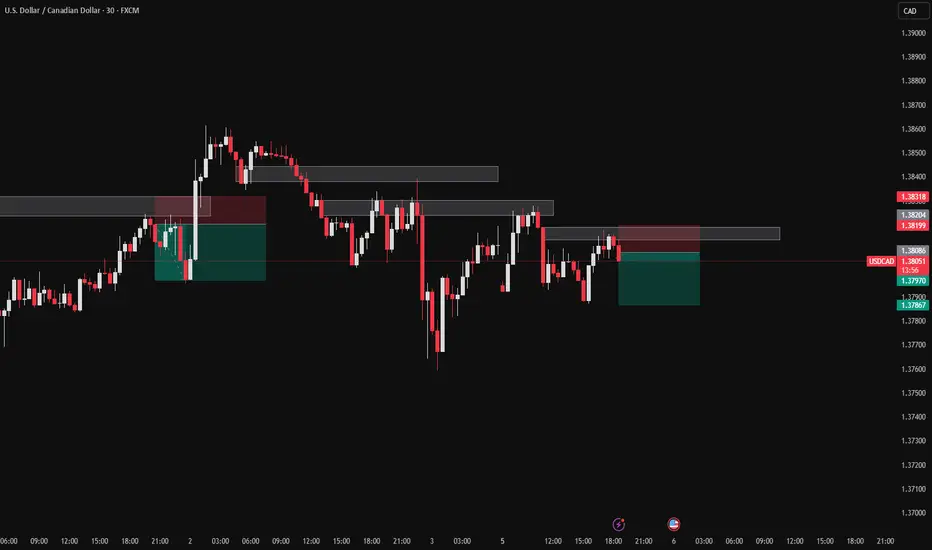
USD/CAD - Wedge Breakout (06.05.2025)The USD/CAD pair on the M30 timeframe presents a Potential Buying Opportunity due to a recent Formation of a Wedge Breakout Pattern. This suggests a shift in momentum towards the upside and a higher likelihood of further advances in the coming hours.
Possible Long Trade:
Entry: Consider Entering A Long Position around Trendline Of The Pattern.
Target Levels:
1st Resistance – 1.3893
2nd Resistance – 1.3928
🎁 Please hit the like button and
🎁 Leave a comment to support for My Post !
Your likes and comments are incredibly motivating and will encourage me to share more analysis with you.
Best Regards, KABHI_TA_TRADING
Thank you.


Bullish Breakout from Falling WedgeCurrently, the USD/CAD is in a crucial support area. The weakness of the US dollar and the improvement in the fundamental aspects of the Canadian dollar have created a tug-of-war between bulls and bears. Traders are adopting a strategy of selling high and buying low within the range of 1.3760-1.3844. Once the resistance/support level is broken through, they will follow the trend accordingly.
you are currently struggling with losses, or are unsure which of the numerous trading strategies to follow, at this moment, you can choose to observe the operations within our channel.

USD/CAD For Bullish as pull-backyou can go long now
or
wait for entry point and then go long
general trend is down trend
current phase is pull-back
your confirmation for bullish will be break the red arrow level and come back to retest it and then go up to target 2
have fun :)

Watching carefully USDCAD this weekWith the abundance of US & CAN data this week, we may see some interesting action in USDCAD pair.
Let's dig in.
Let us know what you think in the comments below.
Thank you.
77.3% of retail investor accounts lose money when trading CFDs with this provider. You should consider whether you understand how CFDs work and whether you can afford to take the high risk of losing your money. Past performance is not necessarily indicative of future results. The value of investments may fall as well as rise and the investor may not get back the amount initially invested. This content is not intended for nor applicable to residents of the UK. Cryptocurrency CFDs and spread bets are restricted in the UK for all retail clients.

USDCAD BULLISH OR BEARISH DETAILED ANALYSISUSDCAD is currently trading around 1.3820, exhibiting a bullish bias as it approaches the upper boundary of a consolidation range. The pair has been forming a symmetrical triangle pattern, indicating potential for a breakout. A decisive move above the 1.3850 resistance level could pave the way toward the 1.3920 target.
Fundamentally, the U.S. dollar has gained strength due to stronger-than-expected manufacturing data, with the ISM PMI rising to 48.7 in April, surpassing forecasts. This data has bolstered U.S. yields and supported the dollar. Conversely, the Canadian dollar has faced pressure from weaker domestic manufacturing activity, with the S\&P Global Canada Manufacturing PMI falling to 45.3, marking the sharpest contraction since May 2020 .
Additionally, recent U.S. tariff announcements on Canadian goods have introduced further uncertainty, potentially impacting Canada's export-driven economy. The Bank of Canada may consider easing monetary policy to counteract these challenges, which could further weaken the Canadian dollar.
In summary, USDCAD is poised for a potential breakout above 1.3850, driven by a combination of technical patterns and fundamental factors favoring the U.S. dollar. Traders should monitor key resistance levels and economic indicators to confirm the continuation of this upward trend.

usdcadDisclaimer:
Trading involves risk. These signals are for informational purposes only and do not constitute financial advice. Past performance is not indicative of future results. Use at your own risk. Always trade responsibly.
audnzdDisclaimer:
Trading involves risk. These signals are for informational purposes only and do not constitute financial advice. Past performance is not indicative of future results. Use at your own risk. Always trade responsibly.

USDCAD SHORT FORECAST Q2 W19 D5 Y25USDCAD SHORT FORECAST Q2 W19 D5 Y25
Professional Risk Managers👋
Welcome back to another FRGNT chart update📈
Diving into some Forex setups using predominantly higher time frame order blocks alongside confirmation breaks of structure.
Let’s see what price action is telling us today!
💡Here are some trade confluences📝
✅Intraday breaks of structure
✅Tokyo ranges to be filled
✅15' order block identified
🔑 Remember, to participate in trading comes always with a degree of risk, therefore as professional risk managers it remains vital that we stick to our risk management plan as well as our trading strategies.
📈The rest, we leave to the balance of probabilities.
💡Fail to plan. Plan to fail.
🏆It has always been that simple.
❤️Good luck with your trading journey, I shall see you at the very top.
🎯Trade consistent, FRGNT X

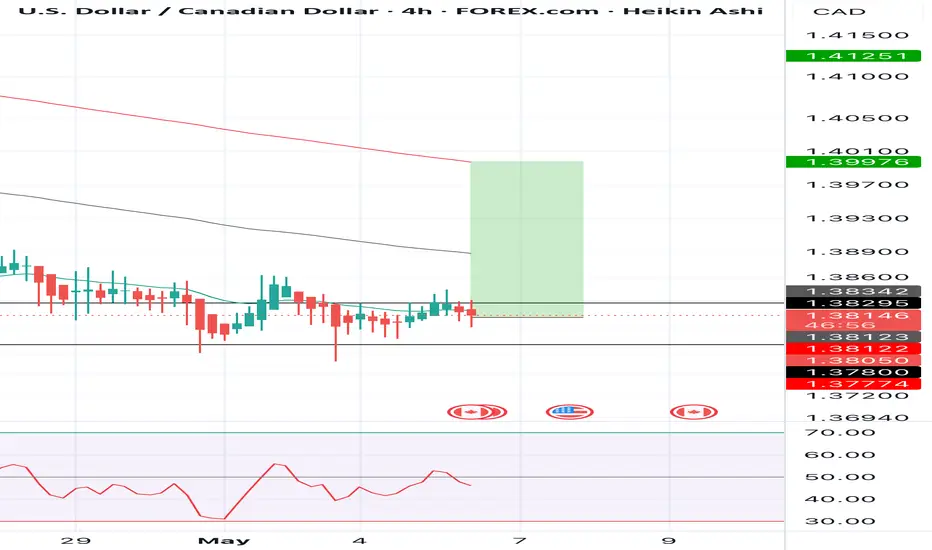
USD/CAD: Time to Go Long?On the monthly chart, USD/CAD has found strong support, signaling a potential bullish continuation. With anticipated USD strength in the coming weeks, there’s a clear opportunity for the pair to move higher.
We are targeting 1.40180 as the first objective, with the potential to extend towards 1.41500 if momentum continues.
On the daily chart, the price is showing signs of weakness but also bullish intent, suggesting a possible retracement before a move higher. Ideally, a pullback into the 1.38490 – 1.38450 zone would offer a high-probability long entry.

USDCAD Monthly – Seller Initiative in PlayHey traders and investors!
Take a look at the monthly chart of USDCAD.
The price has been in a sideways range for quite some time, and the seller initiative is currently active.
📌 At the upper boundary of the range, a seller zone (red box) has formed, along with a seller-side Decision bar (IKC), which has now hit the buyer zone (blue box).
⚠️ With this structure, it makes more sense to look for short setups.
This analysis is based on the Initiative Analysis concept (IA).
Wishing you profitable trades!

USDCAD Potential Long PlayRetailers are short + bullish structure + Strong Demand zone. Potential Play? only problem, the zone does seem kinda at equillibrium

The possible uprising of USDCAD, 4hr1. Technical Analysis
• Trendline + Horizontal Support
A clearly defined uptrend line, drawn from the March ’24 low through the August and April pullbacks, intersects the 1.3810–1.3850 area. That same zone has flipped from support to resistance and back again over the past year, marking it as a high‑probability reversal point.
• Bullish Divergence
On the 4‑hour RSI, the most recent price low dipped slightly below March’s low while RSI held higher. This divergence at a key support zone suggests selling momentum is exhausted and buyers may be stepping in.
• Entry, Stops & Targets
• Entry: Look for a clean bullish 4H candle (pin bar, engulfing bar, etc.) around 1.3820–1.3850, where trendline and horizontal support converge.
• Stop: Place below 1.3680, under the April swing low and next structural demand area.
• Target 1: 1.4168 (recent mid‑range swing high)
• Target 2: 1.4467–1.4542 (major supply zone from late 2024)
This setup offers roughly a 1:4 risk‑to‑reward ratio if both targets are reached.
• Higher‑Timeframe Confirmation
A daily close back above 1.3850 would reinforce this zone’s support role. Wait for that or a clear 4‑hour bullish pattern before committing.
2. Fundamental Analysis
• Oil Price Pressure
WTI has slid toward the low‑$60s on OPEC+ supply increases and softer Chinese demand. With Canada heavily reliant on oil revenues, lower crude prices tend to weaken CAD against USD.
• Policy Divergence
The Bank of Canada remains on hold at 2.75% and markets anticipate cuts later in 2025, while the Federal Reserve holds funds rates at 5.25–5.50%. That yield gap supports USD strength.
• Growth Differential
Canada’s Q1 GDP underperformed expectations—soft energy and mining output—whereas U.S. growth is still running near 2–3%. The disparity favors USD.
• Risk Sentiment
Elevated U.S.–China trade tensions and global growth concerns have nudged markets into risk‑off mode, a backdrop in which USD typically outperforms commodity‑linked currencies like CAD.
Bottom Line
With a multi‑touch trendline and horizontal flip level converging around 1.3820–1.3850, coupled with RSI divergence and dovish CAD fundamentals versus a still‑hawkish Fed, this is a textbook long setup. Wait for a convincing 4‑hour bullish signal in the zone, use a stop under 1.3680, and target 1.4168 first, then 1.4467–1.4542.

USD_CAD WILL GO DOWN|SHORT|
✅USD_CAD is consolidating
Beneath the horizontal resistance
Of 1.3862 so we are bearish
Biased and we will be expecting
A further bearish move down
This trading week
SHORT🔥
✅Like and subscribe to never miss a new idea!✅
Disclosure: I am part of Trade Nation's Influencer program and receive a monthly fee for using their TradingView charts in my analysis.

BullishI'm currently looking for bullish run...
Targets
TP 1 - 1.38931
TP 2 - 1.39860
TP 3 - 1.41254
SL - 1.38118

Analysis of the USD/CAD Exchange RateAs of last Friday, the USD/CAD exchange rate traded in the range of 1.3800 - 1.3850, down 0.0217% compared to the previous day. The key resistance level was 1.3844, and the support level was 1.3760. In the short term, the fluctuations are dominated by the US non - farm payrolls data and trade policies: strong US employment data may support the rebound of the US dollar.
you are currently struggling with losses, or are unsure which of the numerous trading strategies to follow, at this moment, you can choose to observe the operations within our channel.

USDCADON THE 4HR TIMEFRAME
⚡️We established the key monthly zone.
⚡️weekly trendline.
⚡️wide divergence all signaling bullish and hence rhyming with the monthly,
⚡️weekly and daily bullish bias.
Our confirmation will be the break of the 4hr trend line for a possible quick entry long!!
It's Bullish🚀 guyss
