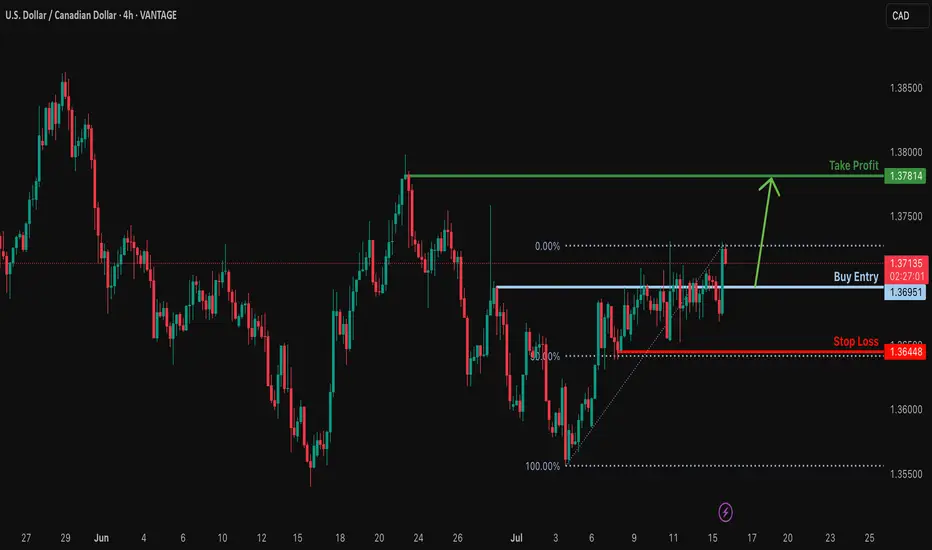
Bullish bounce off pullback support?USD/CAD is falling towards the support level which is a pullback support and could bounce from this level to our take profit.
Entry: 1.3695
Why we like it:
There is a pullback support.
Stop loss: 1.3644
Why we like it:
There is a pullback support that aligns with the 50% Fibonacci retracement.
Take profit: 1.3781
Why we lik eit:
There is a pullback resistance.
Enjoying your TradingView experience? Review us!
Please be advised that the information presented on TradingView is provided to Vantage (‘Vantage Global Limited’, ‘we’) by a third-party provider (‘Everest Fortune Group’). Please be reminded that you are solely responsible for the trading decisions on your account. There is a very high degree of risk involved in trading. Any information and/or content is intended entirely for research, educational and informational purposes only and does not constitute investment or consultation advice or investment strategy. The information is not tailored to the investment needs of any specific person and therefore does not involve a consideration of any of the investment objectives, financial situation or needs of any viewer that may receive it. Kindly also note that past performance is not a reliable indicator of future results. Actual results may differ materially from those anticipated in forward-looking or past performance statements. We assume no liability as to the accuracy or completeness of any of the information and/or content provided herein and the Company cannot be held responsible for any omission, mistake nor for any loss or damage including without limitation to any loss of profit which may arise from reliance on any information supplied by Everest Fortune Group.
CADUSD trade ideas
Remains Below 1.3700 Ahead of CPI Data from the US and CADUSD/CAD Remains Below 1.3700 Ahead of CPI Data from the US and Canada
USD/CAD continues to decline ahead of inflation data from both the US and Canada.
The US inflation rate is expected to rise to 2.7% year-over-year in June, up from 2.4% recorded in May.
Meanwhile, Canada’s CPI is forecasted to increase by 1.9% year-over-year in June, up from 1.7% in May.
USD/CAD is trading around 1.3690 during the European session on Tuesday, following two days of gains. The pair is declining as the US dollar (USD) continues to weaken ahead of the June CPI data from the US. The inflation figures will provide new insights into the Federal Reserve's (Fed) monetary outlook.
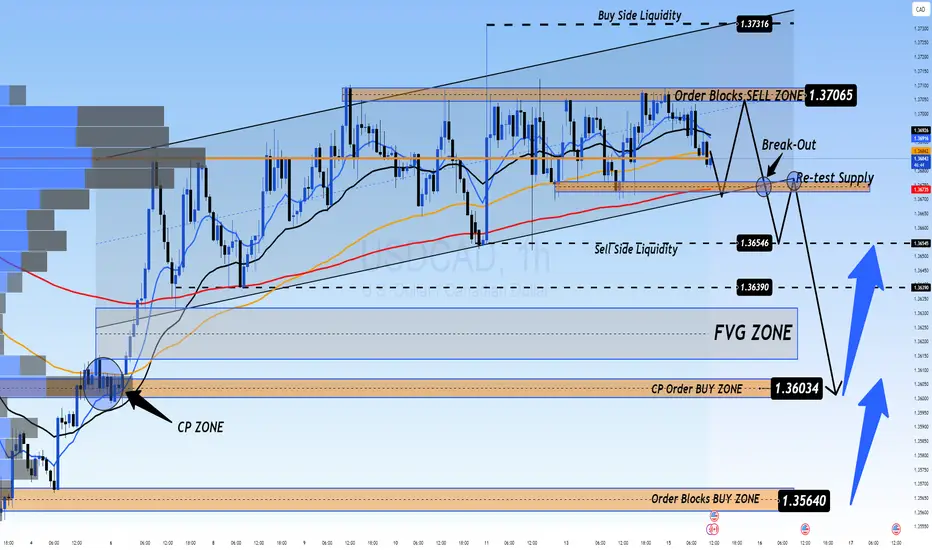
📉 Market Outlook for USD/CAD – Possible Drop on CPI Release
The USDCAD is still in a downtrend, and a sharp drop could occur with today’s CPI data release. Currently, there are two Buy Side Liquidity zones above and Sell Side Liquidity below, with the price balanced around the VPOC zone, which will soon decide the direction after the CPI announcement today.
Market liquidity still holds a FVG below, and with CPI data expected to favor USD, this could trigger a sharp drop towards this liquidity zone, possibly nearing CP OBS at 1.3600, followed by a potential rebound.
If price breaks CP zone, it may head toward a strong OB zone near 1.35xxx. Therefore, caution is advised when monitoring these OB zones.
🎯 Trading Strategy for Today
🟢 BUY ZONE: 1.36000
SL: 1.35500
TP: 1.36500 → 1.37000 → 1.37500 → ????
💬 What are your thoughts on USD/CAD ahead of the CPI data release? Do you expect a strong bounce or a continued decline? Share your views and join the conversation below!
👉 Follow for more updates and insights, and join the community to discuss real-time market moves!
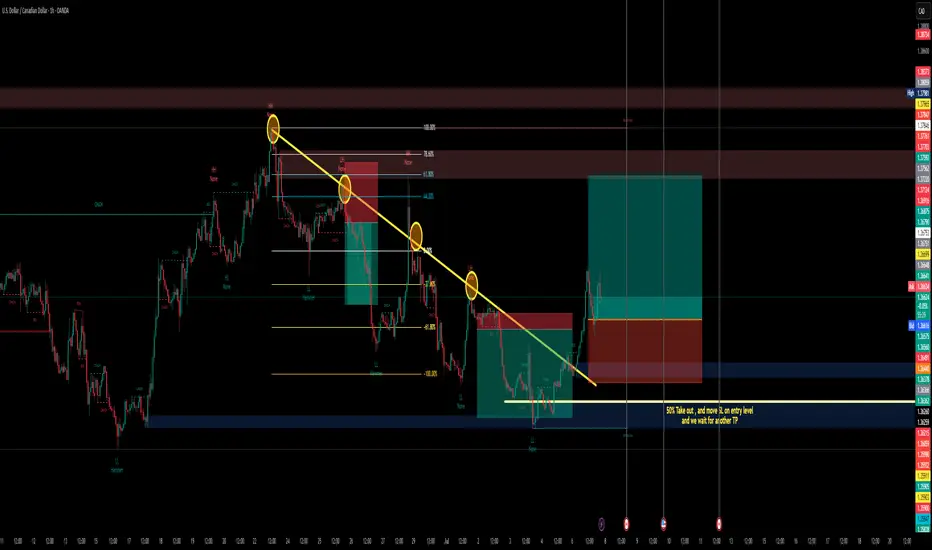
usdcad Buy1. Trendline Breakout
The yellow descending trendline has multiple confirmed touchpoints (marked with yellow circles), showing it was a respected resistance.
Break and close above the trendline indicates a potential end to the downtrend, signaling a trend reversal to the upside.
USDCAD is breaking the trendline againOnce again, FX_IDC:USDCAD is breaking its medium-term downside resistance line, drawn from the current highest point of this year. If the rate remains above it, we may see a few more bulls stepping in. Let's take a look.
MARKETSCOM:USDCAD
Let us know what you think in the comments below.
Thank you.
75.2% of retail investor accounts lose money when trading CFDs with this provider. You should consider whether you understand how CFDs work and whether you can afford to take the high risk of losing your money. Past performance is not necessarily indicative of future results. The value of investments may fall as well as rise and the investor may not get back the amount initially invested. This content is not intended for nor applicable to residents of the UK. Cryptocurrency CFDs and spread bets are restricted in the UK for all retail clients.

SHORT USDCADyou can find your sell entry now cus its already at the poi reacting always remember lower tf mss still the best to me

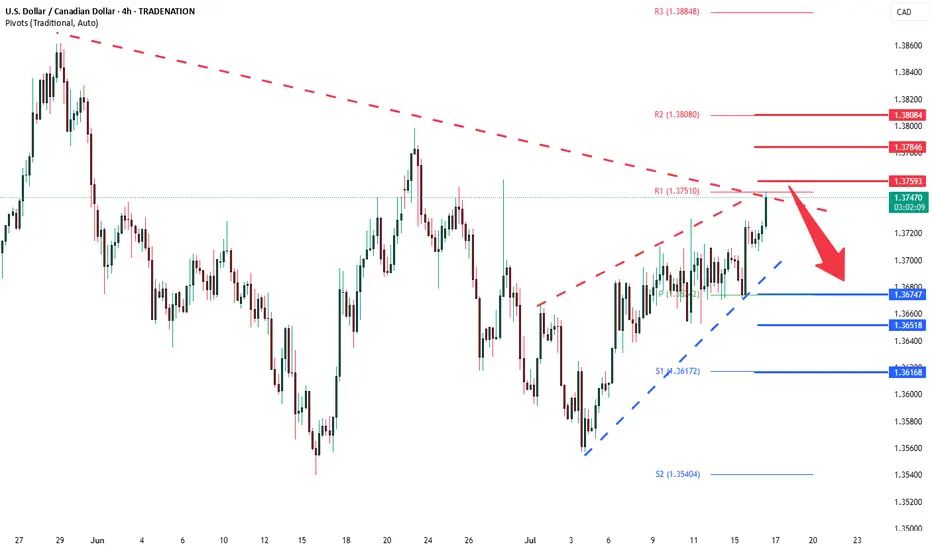
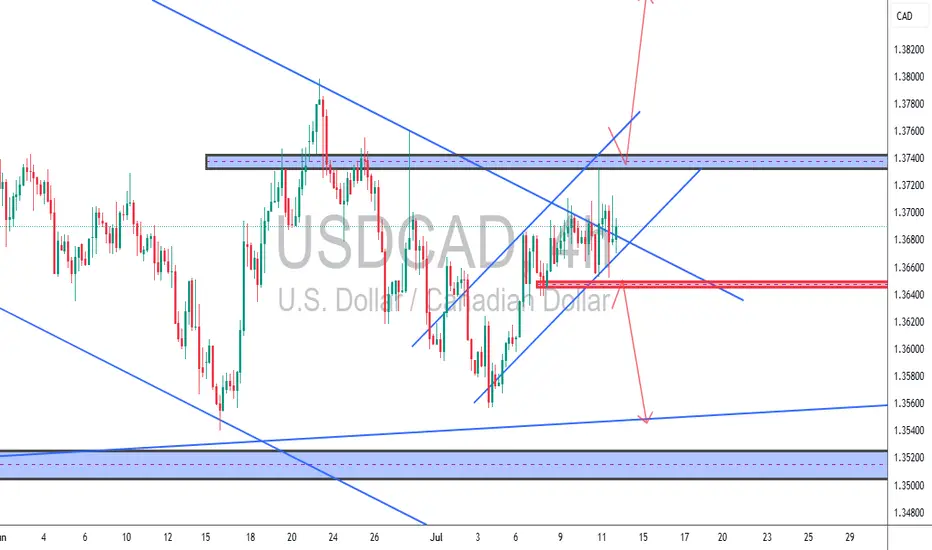
Bearish drop?USD/CAD is rising towards the resistance level which is an overlap resistance at lines up with the 38.2% Fibonacci retracement and could drop from this level to our take profit.
Entry: 1.3706
Why we like it:
There is an overlap resistance that aligns with the 38.2% Fibonacci retracement.
Stop loss: 1.3746
Why we like it:
There is a swing high resistance.
Take profit: 1.3653
Why we like it:
There is a pullback support.
Enjoying your TradingView experience? Review us!
Please be advised that the information presented on TradingView is provided to Vantage (‘Vantage Global Limited’, ‘we’) by a third-party provider (‘Everest Fortune Group’). Please be reminded that you are solely responsible for the trading decisions on your account. There is a very high degree of risk involved in trading. Any information and/or content is intended entirely for research, educational and informational purposes only and does not constitute investment or consultation advice or investment strategy. The information is not tailored to the investment needs of any specific person and therefore does not involve a consideration of any of the investment objectives, financial situation or needs of any viewer that may receive it. Kindly also note that past performance is not a reliable indicator of future results. Actual results may differ materially from those anticipated in forward-looking or past performance statements. We assume no liability as to the accuracy or completeness of any of the information and/or content provided herein and the Company cannot be held responsible for any omission, mistake nor for any loss or damage including without limitation to any loss of profit which may arise from reliance on any information supplied by Everest Fortune Group.

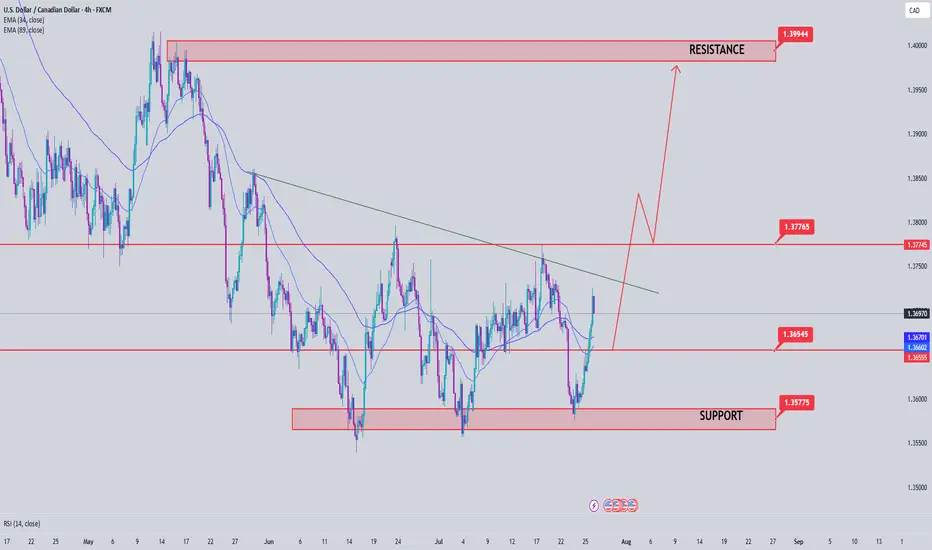
USDCAD oversold consolidation, resistance at 1.3760The USDCAD pair is currently trading with a bearish bias, aligned with the broader downward trend. Recent price action shows a retest of the previous resistance zone, suggesting a temporary sideways consolidation within the downtrend.
Key resistance is located at 1.3760, a prior consolidation zone. This level will be critical in determining the next directional move.
A bearish rejection from 1.3760 could confirm the resumption of the downtrend, targeting the next support levels at 1.3670, followed by 1.3650 and 1.3620 over a longer timeframe.
Conversely, a decisive breakout and daily close above 1.3760 would invalidate the current bearish setup, shifting sentiment to bullish and potentially triggering a move towards 1.3785, then 1.3800.
Conclusion:
The short-term outlook remains bearish unless the pair breaks and holds above 1.3760 Traders should watch for price action signals around this key level to confirm direction. A rejection favours fresh downside continuation, while a breakout signals a potential trend reversal or deeper correction.
This communication is for informational purposes only and should not be viewed as any form of recommendation as to a particular course of action or as investment advice. It is not intended as an offer or solicitation for the purchase or sale of any financial instrument or as an official confirmation of any transaction. Opinions, estimates and assumptions expressed herein are made as of the date of this communication and are subject to change without notice. This communication has been prepared based upon information, including market prices, data and other information, believed to be reliable; however, Trade Nation does not warrant its completeness or accuracy. All market prices and market data contained in or attached to this communication are indicative and subject to change without notice.
Usdcad strong buyStrong buy expected
Weekly and monthly too oversold pair
Daily down trend breaks already which giving the good signs for buyers
Strong bullish correction expected

USDCAD (U.S. Dollar/Canadian Dollar) long (buy) setupUSDCAD (U.S. Dollar/Canadian Dollar) long (buy) setup. Here's the breakdown:
**Setup Overview**
* **Entry Level:** Around 1.3700
* **Take Profit (TP):** 1.3812 (upper green zone)
* **Stop Loss (SL):** 1.3638 (lower red zone)
**Technical Observations**
* Price is bouncing from a rising trendline (diagonal black line), suggesting bullish support.
* Price is trading above the 50 EMA, 21 EMA, and 7 EMA — indicating bullish momentum.
* A strong bullish candle with high volume occurred before consolidation, showing buyer interest.
* Tight consolidation near the entry level suggests potential for a breakout continuation upward.
**Bias**
* **Bullish** bias as long as price remains above the trendline and EMAs.
* The trade offers a favorable risk-to-reward ratio, targeting a \~110 pip gain vs. \~60 pip risk.
*Summary**
The chart shows a bullish trade setup on USDCAD based on trendline support, EMA alignment, and volume confirmation. A breakout above 1.3700 aims for 1.3812, while invalidation lies below 1.3638.

USDCAD still bullish?
OANDA:USDCAD what's next, we are have bullish push, currently price in ASCENDING CHANNEL and in ascending channel is visible and one more ASCENDING CHANNEL (marked yelow), interesting chart,- can we see higher bullish push?
SUP zone: 1.36800
RES zone: 1.37600, 1.37900

USD/CAD Institutional Buy Zone – Thief Trading Alert!🔥 USD/CAD "LOONIE BANK HEIST" 🔥 – THIEF TRADING STYLE (BULLISH SNIPER PLAN)
💸 ATTENTION: Market Robbers & Profit Pirates!
"Steal Like a Pro – Escape Before the Cops Arrive!"
🎯 MASTER TRADE PLAN (Based on Thief Trading Tactics):
Entry Zone (Pullback Heist):
📌 Pullback-1: Market Maker Trap Zone (1.35400+) – Wait for retest!
📌 Pullback-2: Institutional Buy Zone (1.33500+) – Confirm bullish momentum!
"Patience = Perfect Heist Timing. Don’t rush—ambush the trend!"
🎯 Profit Target: 1.38100 (or escape earlier if momentum fades).
🛑 Stop Loss (Escape Route): Nearest 4H Swing Low (wick/close) – Adjust based on risk & lot size!
🚨 SCALPERS’ WARNING:
"Only snipe LONG! Big pockets? Strike now. Small stack? Join swing robbers & trail your SL!"
📉 WHY THIS HEIST? (Bullish Triggers):
Technical + Fundamental alignment (COT, Macro, Sentiment).
Overbought but institutional demand holding strong.
"Bears are trapped—time to rob their stops!"
⚠️ CRITICAL ALERT:
News = Volatility = Police Ambush!
Avoid new trades during high-impact news.
Trailing SL = Your Getaway Car! Lock profits before reversals.
💥 BOOST THIS HEIST!
"Hit 👍, 🔔 Follow, and 🚀 Boost to fuel our next robbery! Let’s drain the banks together!"
🔮 NEXT HEIST COMING SOON… Stay tuned, partner! 🎭💰

USDCAD BEARISH Likely Slow drift downward, unless oil spikes.
Caution:
U.S. data later in the week (like CPI) could reverse the move.
For now, the path of least resistance is lower for USD/CAD, possibly toward

SDCAD 4H – Compression at Resistance📉📈 USDCAD 4H – Compression at Resistance | Breakout or Rejection?
Price is consolidating near a major supply zone inside a wedge structure.
We're at a key decision point: a clean breakout above 1.3750 = bullish continuation; a rejection and break of minor trendline support = bearish drop back to demand.
🧠 TCB Strategy in play: waiting for breakout confirmation or reversal candle.
Long above 1.3750 → Target 1.3840
Short below 1.3660 → Target 1.3560
🎯 High RRR in both directions.
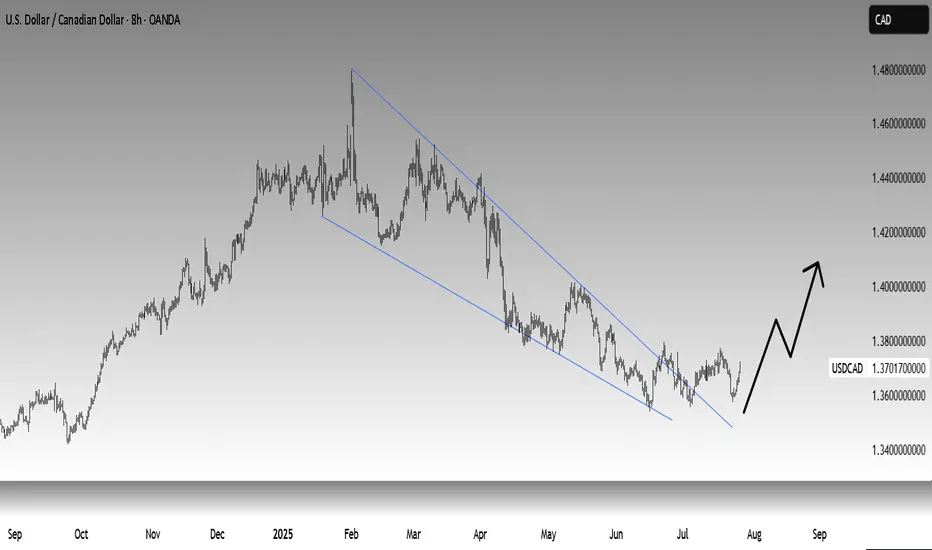
USDCAD Analysis week 31🌐Fundamental Analysis
The Canadian dollar continued to decline against the US dollar on Friday. Trump returned to threatening tariffs on Canada as trade deals remain limited. The August 1 deadline for tariffs is approaching and Canada has not made much of a move so far.
🕯Technical Analysis
USDCAD continues to rally towards the 1.4000 resistance zone. A recovery of the pair to 1.365 is a good momentum for USDCAD to break the trendline and break 1.37700. The trading strategy for next week is mainly to look for BUY points when there is a recovery of the wave structure. If the important support of the week 1.357 is broken, the uptrend will reverse.
📈📉Trading Signals
BUY USDCAD 1.365-1.363 Stoploss 1.360
BUY Break out 1.37700
Buy usdcadWe have seen how price create a reversal pattern Wich is triple bottom advisable we are to wait for breaking of the above resistant (and retest) before buying
USDCAD – Bullish OutlookThe US Dollar continues to show strength against the Canadian Dollar. Price closed firmly at 1.3700, signaling strong bullish momentum and potential continuation.
📈 Trade Idea: Long USDCAD
🔹 Entry: 1.3700
🔹 Targets:
First Target: 1.3800
Second Target: 1.3900
Extended Target: 1.4000+
Strong USD fundamentals, coupled with technical strength on higher timeframes, support further upside in this pair. Watching for bullish follow-through and potential breakout above recent resistance.
USDCAD analysis 1day frame We have bat 🦇 pattern and also ob ..I expect from this area 1.35114-1.34500 go buy for long to the targets in the chart

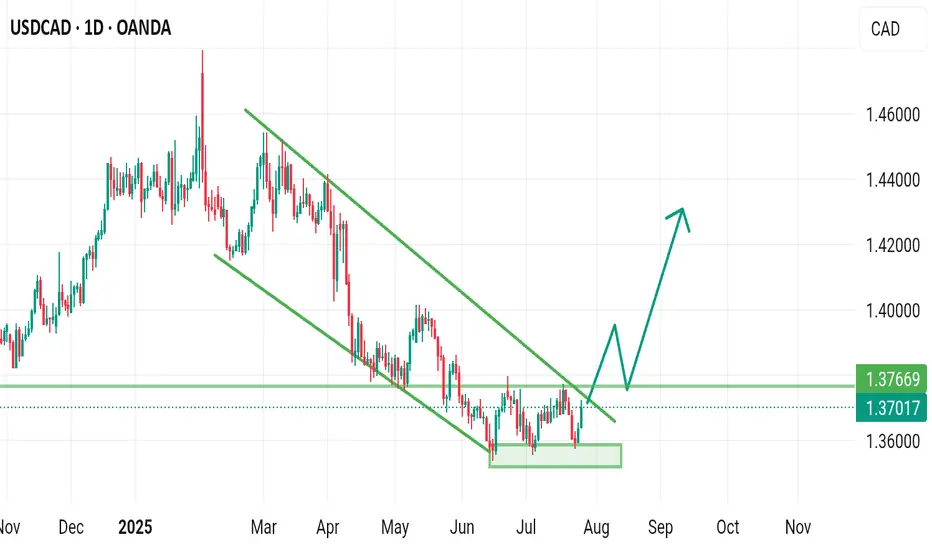
USDCAD Wave Analysis – 25 July 2025
- USDCAD rising inside sideways price range inside
- Likely to reach resistance level 1.3800
USDCAD currency pair recently reversed from the key support level 1.3575 (which is the lower boundary of the sideways price range inside which the price has been trading from June).
The upward reversal from the support level 1.3575 created the daily Japanese candlesticks reversal pattern Morning Star.
USDCAD currency pair can be expected to rise to the next resistance level 1.3800 (upper border of this sideways price range, top of wave (2)).

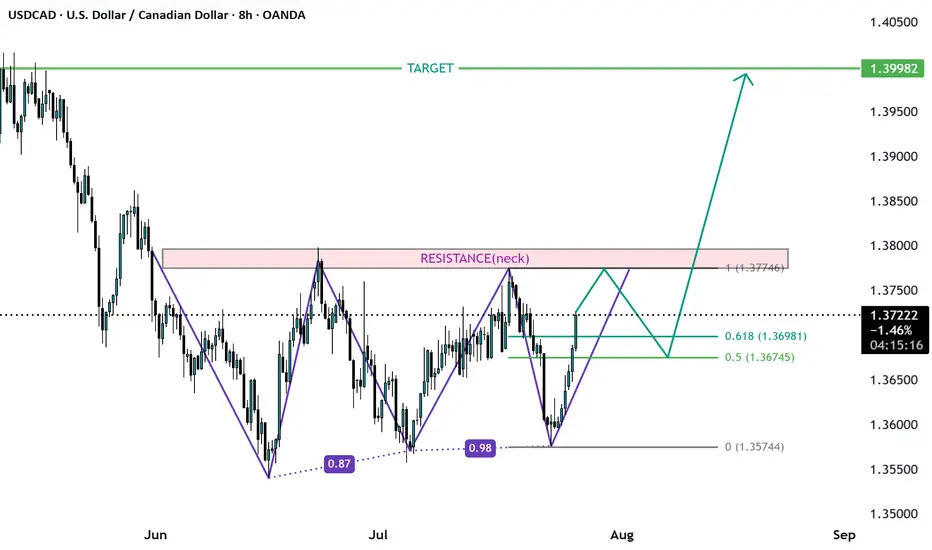
USDCAD Triple Bottom? Ready for long run?USDCAD formed a triple bottom on high time frame and is likely to Reach target of 1.4. the third bottom is also formed and is about finish soon the pattern. Enter the trade when the neck is broken or if the price come to 0.5 fib level from this bottom level.
Long USDCADUCAD has showed good candlestick formation, rejects on trendline. I am going to buy this, targeting to fibo 4.23.

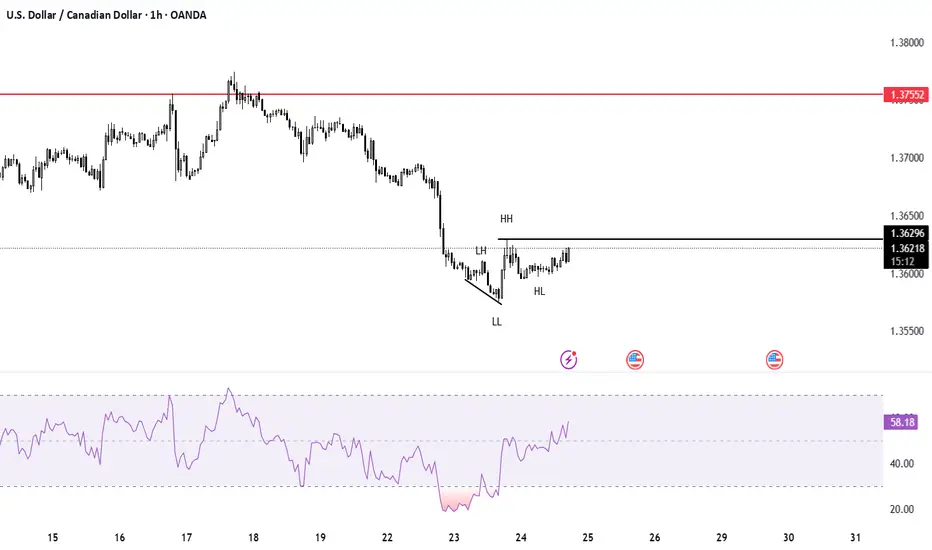
usdcad swing trade long3 bull points
Rsi div
Trend reversal
Double bottom at 1D timeframe
RRR 1:2
hold for more longer but with proper risk management..
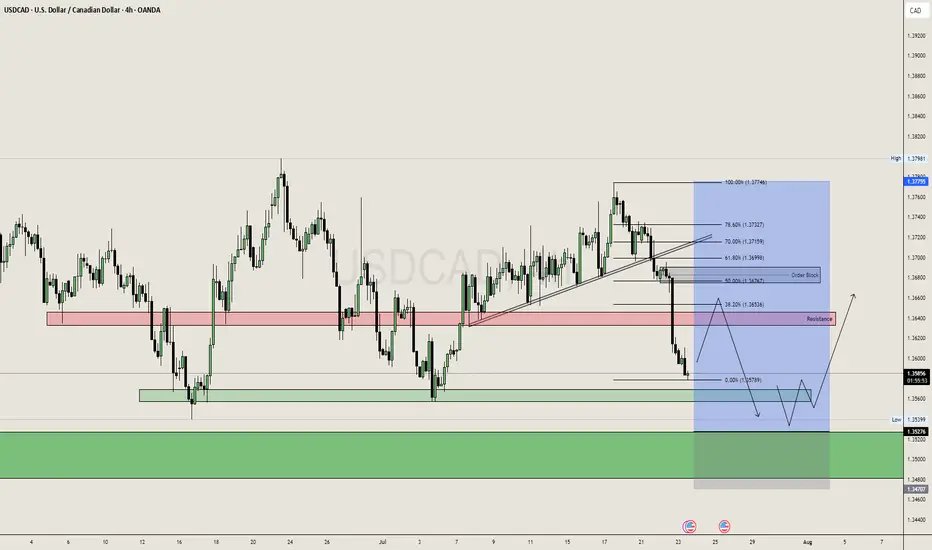
USDCAD, we can see a pullbackUSDCAD is in Range in Daily, and daily range is enough to capture 200-250 pips. So keeping that in mind we can plan a buy trade USDCAD from the Daily Demand Area 1.3500 - 1.3550 Area.
And 1H Trend is Bearish So we can also look for the Sell from the 1.3650 aka Resistance Zone (4H), but after this selling move it is risky to sell at current price i.e. 1.3580 So wait for fib area or look for buys only from Demand Zone.
USD/CAD(20250725)Today's AnalysisMarket news:
The European Central Bank announced that it would maintain the three key interest rates unchanged, reiterated data dependence, warned that the external environment is highly uncertain, and President Lagarde did not rule out the possibility of future rate hikes. Traders reduced their bets on ECB rate cuts.
Technical analysis:
Today's buying and selling boundaries:
1.3626
Support and resistance levels:
1.3689
1.3666
1.3651
1.3602
1.3587
1.3563
Trading strategy:
If the price breaks through 1.3651, consider buying, with the first target price of 1.3666
If the price breaks through 1.3626, consider selling, with the first target price of 1.3602
