USDCAD / U.S. Dollar – Canadian Dollar (4H) – ABC Bearish PatterUSDCAD / U.S. Dollar – Canadian Dollar (4H) – ABC Bearish Pattern Completion at PCZ
Pattern Overview:
Pattern Type: ABC Bearish (Potential Reversal)
Asset: USDCAD
Timeframe: 4H
Trade Type: Short Bias – Rejection observed near PCZ zone
🔎 Key Levels
XA: 1.37880 → 1.35574
AB: 1.35574 → 1.37742
BC: Completed right into the PCZ, aligning with 127.2% and 161.8% projection zones
Rejection confirmed below 1.3774, entering pullback
📐 Fibonacci Extensions & Key Ratios
127.2% Projection: 1.37368
161.8% Extension: 1.37855
Retracement Target Zone (PCZ/Support):
50.0% = 1.36842
61.8% = 1.36629
💡 Price Action & Setup
The price has completed a textbook ABC structure into a confluence projection zone (PCZ), showing signs of exhaustion at 1.3774. This area aligns with a previous swing high and fib confluence, now acting as resistance.
The first leg of the pullback is underway, and momentum is favoring a deeper move toward the 1.3680 – 1.3660 PCZ, which aligns with key fibs and 200 SMA support.
🧠 Market Sentiment
DXY consolidating near highs – potential exhaustion
Crude oil stabilizing supports CAD
CAD correlation is enhancing bearish weight on this pair post-ABC
📊 Next Potential Movement
Targeting the 1.3680–1.3660 support cluster
If PCZ fails to hold on any retest → potential continuation down toward 1.3600 swing
Resistance to watch: 1.3737–1.3750 (any candle close above this weakens setup)
🛡 Risk Management
Short entries from the 1.3760–1.3770 area are valid
Stop-loss ideally above 1.3790 (beyond 161.8%)
Scaling out near 1.3680 and 1.3660, both technical targets and 200 SMA confluence
📌 Conclusion
Price completed a high-probability ABC Bearish structure and is now reacting from a strong confluence zone. While confirmation is still unfolding, momentum favors downside, and all eyes are on the next leg toward the PCZ support range.
“Bearish patterns are warnings, not guarantees. But confluence zones give them authority.”
CADUSD trade ideas

USDCAD bearish structureprice action, you gotta love structure thou. 🧭 Current Sentiment
Bias: Neutral to Bearish (subject to change based on upcoming U.S. data and oil prices)
Market Context: Consolidating in a tight range after recent USD weakness & steady CAD support from oil prices.

USDCAD SELLUSD/CAD retakes 1.3700, eyes multi-week top amid a broadly firmer USD
The USD/CAD pair attracts some dip-buying during the Asian session on Thursday and climbs further beyond the 1.3700 mark amid a broadly firmer US Dollar. Spot prices have now reversed the previous day's retracement slide from a three-week high and seem poised to appreciate further
The year will be politically marked by Trump’s return to the White House. A Republican government is seen as positive for financial markets, but Trump’s pledge to cut taxes and impose tariffs on foreign goods and services may introduce uncertainty to both the political and economic landscape.
Canada’s political crisis peaked in late 2024 with a no-confidence vote against Prime Minister Justin Trudeau, leading to snap elections and a weakened Liberal minority government. Policy uncertainty and economic challenges dominate 2025’s outlook, raising concerns over market stability and investor confidence.
The BoC is set to continue easing interest rates through 2025, at least at a faster pace than the Fed is expected to, which could apply pressure on CAD’s already-rising rate differentia
TP 1 1.37214
TP 2 1.37095
TP 3 1.36987
RESISTANCE 1.37413

USD/CAD(20250718)Today's AnalysisMarket news:
① Kugler: It is appropriate to keep the interest rate policy stable for "a while".
② Daly: Whether to cut interest rates in July or September is not the most critical.
③ Bostic: It may be difficult to cut interest rates in the short term.
Technical analysis:
Today's buying and selling boundaries:
1.3735
Support and resistance levels:
1.3827
1.3792
1.3770
1.3700
1.3678
1.3644
Trading strategy:
If it breaks through 1.3770, consider buying in, the first target price is 1.3792
If it breaks through 1.3735, consider selling in, the first target price is 1.3700

USD_CAD LOCAL SHORT|
✅USD_CAD is going up now
But a strong resistance level is ahead at 1.3800
Thus I am expecting a pullback
And a move down towards the target of 1.3720
SHORT🔥
✅Like and subscribe to never miss a new idea!✅
Disclosure: I am part of Trade Nation's Influencer program and receive a monthly fee for using their TradingView charts in my analysis.

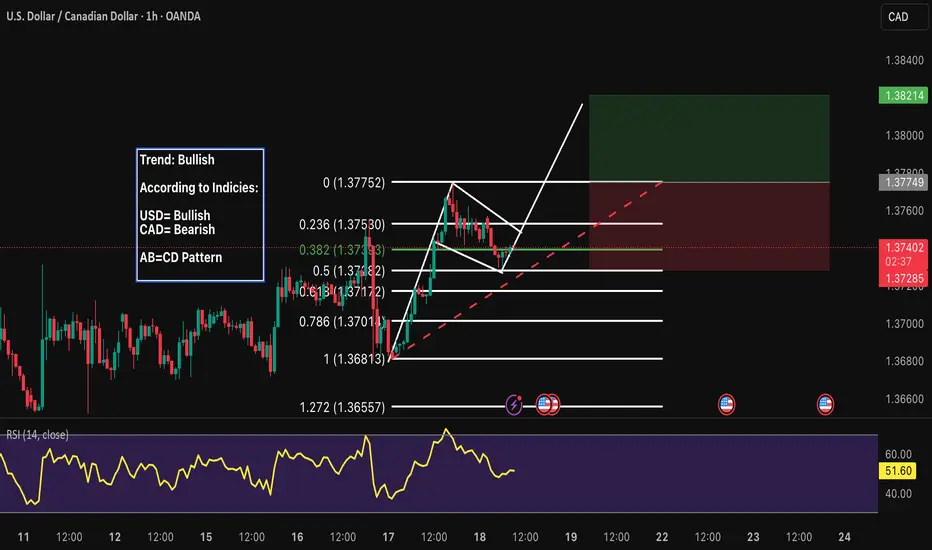
AUDCAD LONG 17-7-2025Indices : dxy bullish
cxy : bearish
trend : buliish
divergence : n/a
continuation hh & hl
reversal : n/a
harmonics : n/a
bias : bullish
order typr : buy limit at fib 0.5

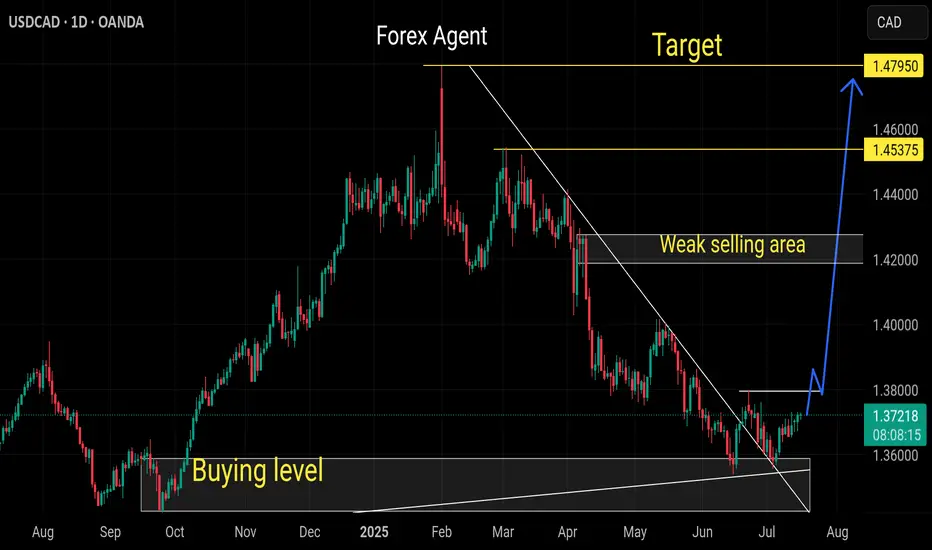
USDCAD Analysis – July 16, 2025
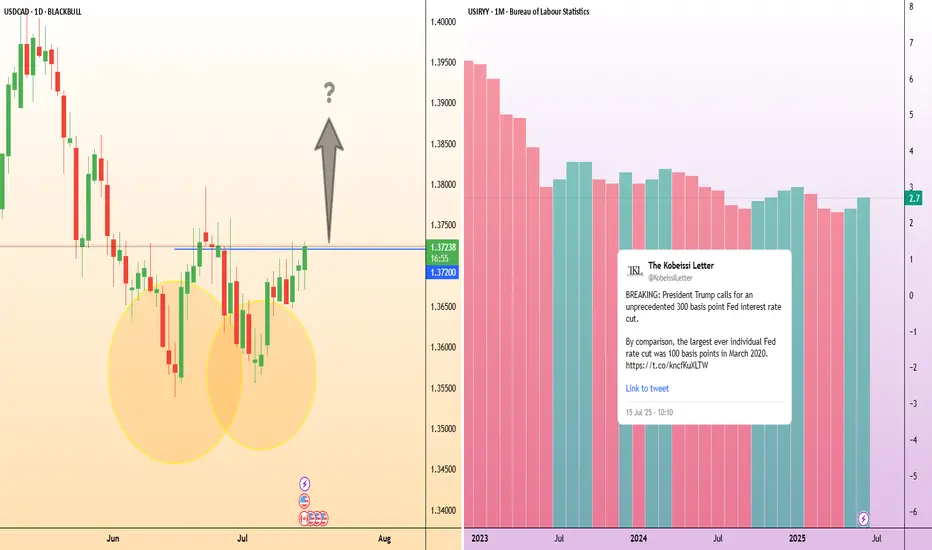
Following the ceasefire between Iran and Israel, oil prices have weakened, reducing support for the Canadian dollar, which is closely tied to crude. As a result, CAD could remain among the weaker currencies over the next two weeks.
Meanwhile, the US dollar may gain strength following the CPI data released on July 15, 2025, potentially setting up a favorable swing opportunity for USDCAD bulls.
🟥 High-Risk Setup – R:R 7.0
This aggressive setup targets a sharp upside move with a tight stop loss, aiming for a high reward relative to the risk. It's suitable for traders comfortable with volatility and willing to accept a lower probability for a higher payout.
🟦 Moderate-Risk Setup – R:R 2.5
A more balanced scenario with a wider stop and a closer target, offering a higher probability of success and smoother trade management. This setup aligns well with swing trading strategies seeking consistent results.
Both setups are based on the current price action structure visible on the chart.
Trade safe, manage your risk, and follow your plan. ✅

Strong buy usdcadA strong buy wave coming
Monthly already oversold pair
Daily sell trend already breaks giving a signals for buyers
As usd gonna strong among all Cross pairs
Usdcad strong buyStrong buy expected
Weekly and monthly too oversold pair
Daily down trend breaks already which giving the good signs for buyers
Strong bullish correction expected

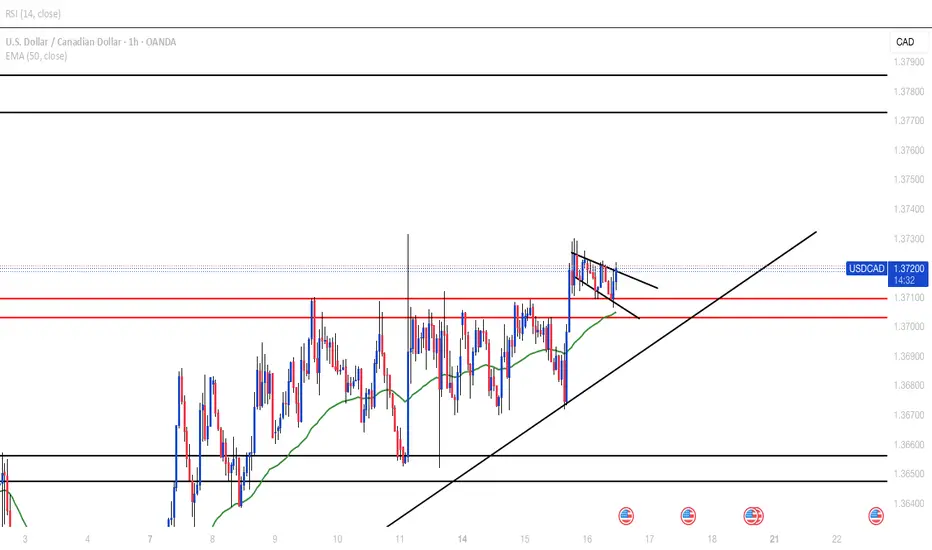
USDCADBroke H1 resistance and price is forming a bullish flag as it retests the zone. Possible movement to next H4 resistance around 1.37700
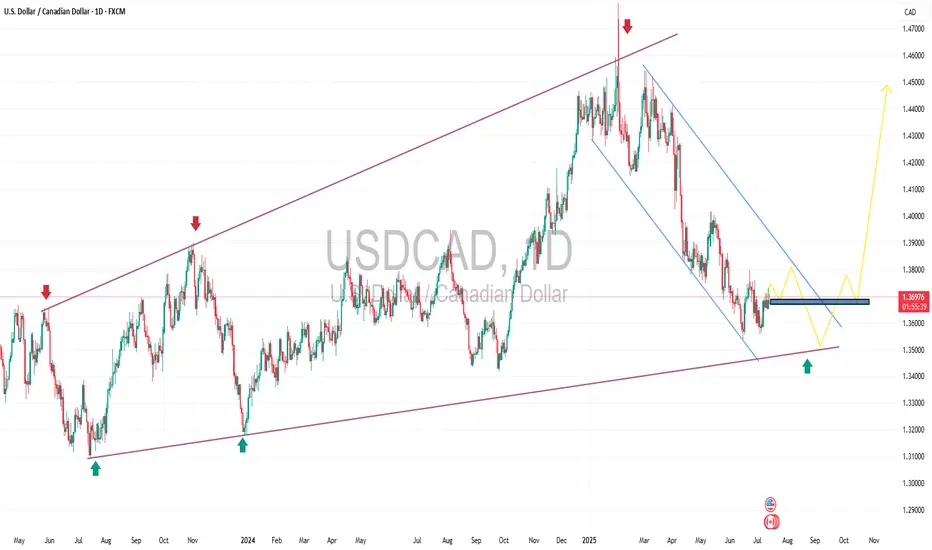
uptrendGiven the support trend line being broken, it is expected that the upward trend will form up to the specified resistance area and then a trend change will be likely. Then the continuation of the downward trend will be possible.

USD/CAD(20250716)Today's AnalysisMarket news:
① The annual rate of the overall CPI in the United States in June rose to 2.7%, the highest since February, in line with market expectations, and the monthly rate was 0.3%, the highest since January, in line with market expectations; the annual rate of the core CPI rose to 2.9%, the highest since February, lower than the expected 3%, but slightly higher than 2.8% last month, and the monthly rate was 0.2%, lower than the market expectation of 0.3%.
② Interest rate futures still show that the Fed is unlikely to cut interest rates this month, but there is a high possibility of a 25 basis point cut in September.
③ Fed mouthpiece: The CPI report will not change the Fed's policy direction.
④ Trump: Consumer prices are low and the federal funds rate should be lowered immediately. The Fed should cut interest rates by 3 percentage points.
⑤ Fed Collins: The core inflation rate is expected to remain at about 3% by the end of the year, and the Fed should maintain active patience.
Technical analysis:
Today's buying and selling boundaries:
1.3708
Support and resistance levels:
1.3766
1.3744
1.3730
1.3685
1.3671
1.3650
Trading strategy:
If the price breaks through 1.3730, consider buying, the first target price is 1.3744
If the price breaks through 1.3708, consider selling, the first target price is 1.3685

USD/CAD: Inflation gaps create opportunityIn the U.S., inflation accelerated for a second straight month, with headline CPI reaching 2.7% year-on-year in June as President Trump’s tariffs begin to push up the cost of a range of goods.
Increasing inflation could likely heighten the Federal Reserve’s reluctance to cut its interest rate, in defiance of Trump’s public demand. This could provide upward momentum for USD/CAD if expectations for rate cuts are delayed.
USD/CAD is showing signs of a potential trend reversal after finding strong support around 1.3600 in late June. Price action has since formed a series of higher lows, and the recent breakout attempt above 1.3720 suggests bullish momentum could be building.
Canada’s inflation rate, released at the same time as the US’s, edged up to 1.9%, staying below the Bank of Canada’s 2% target for a third consecutive month. With the BoC already signalling easing bias, this divergence in inflation paths may limit CAD strength.
USD/CAD Coils Below Key ResistanceUSD/CAD has rallied nearly 1.3% off the monthly low with the advance now testing resistance at 1.3729/50- a region defined by the 38.2% retracement of the 2021 rally and the May opening-range lows. Note that pitchfork resistance converges on this threshold over the next few days and further highlights the technical significance of this key zone- looking for a reaction off this mark this week.
USD/CAD is trading within the confines of an embedded channel extending off the monthly low with the weekly opening range taking shape just below confluent resistance at 1.3729/50. Ultimately, a breach / close above the June high / 61.8% retracement of the December 2023 advance at 1.3795/98 is needed to suggest a more significant low was registered last month / a larger trend reversal is underway. Subsequent resistance seen at the 2022 high close / 2023 high at 1.3881/99 and the 2022 high / 2020 March weekly-reversal close at 1.3977/90- both levels of interest for possible topside exhaustion / price inflection IF reached.
Initial support rests with the weekly range lows at 1.3670- a break / close below the monthly channel would threaten resumption of the broader downtrend. Subsequent support objectives unchanged at the yearly low-day close (LDC) / May, June, July lows at 1.3571/90 and the Fibonacci confluence at 1.3504/23.
Bottom line: The USD/CAD is testing confluent resistance at the February downtrend with the weekly opening-range set just below- look for the breakout in the days ahead and watch the weekly close here. From a trading standpoint, losses would need to be limited to the weekly lows IF price is heading for a breakout on this stretch with a close above 1.3795 ultimately needed to put the bulls in control.
-MB

USDCAD LONG DAILY FORECAST Q3 D15 W29 Y25USDCAD LONG DAILY FORECAST Q3 D15 W29 Y25
Professional Risk Managers👋
Welcome back to another FRGNT chart update📈
Diving into some Forex setups using predominantly higher time frame order blocks alongside confirmation breaks of structure.
Let’s see what price action is telling us today! 👀
💡Here are some trade confluences📝
✅Daily Order block identified
✅4H Order Block identified
✅1H Order Block identified
🔑 Remember, to participate in trading comes always with a degree of risk, therefore as professional risk managers it remains vital that we stick to our risk management plan as well as our trading strategies.
📈The rest, we leave to the balance of probabilities.
💡Fail to plan. Plan to fail.
🏆It has always been that simple.
❤️Good luck with your trading journey, I shall see you at the very top.
🎯Trade consistent, FRGNT X

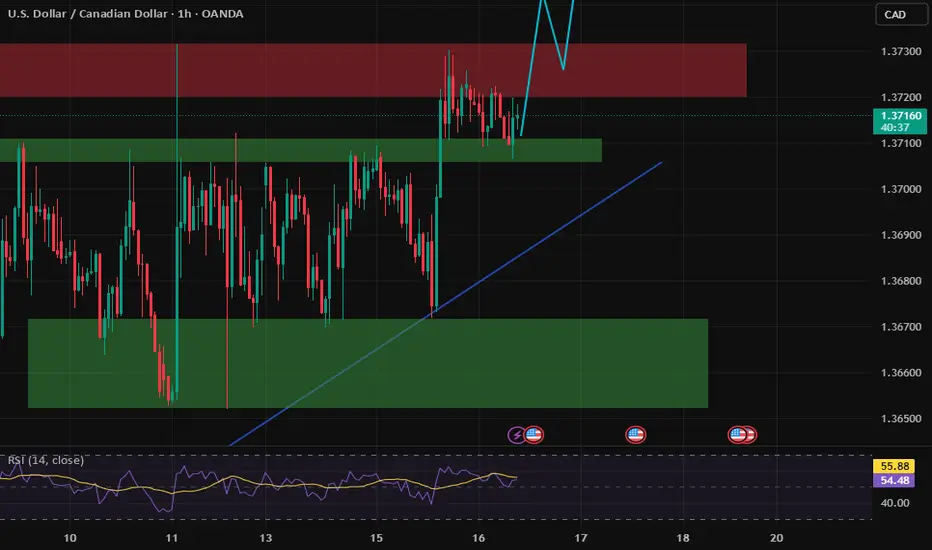
USDCAD Analysis (4H TF)USDCAD Analysis (4H TF)
The market has been in a strong downtrend, clearly marked by multiple Break of Structure (BOS). However, we’re now seeing signs of accumulation at the lower levels, with multiple CHoCH (Change of Character) signaling a possible trend shift.
Price is currently consolidating around 1.3700, tapping into previous supply and demand zones. If the bullish structure holds, we could see a continuation upward toward the next resistance.
What I’m watching:
- A clear breakout and retest above the 1.3730 zone
- Bullish confirmation before entering
- Tight risk management, as we’re still inside a larger descending channel
Trade idea: Wait for a clean breakout or a reaction from the supply zone. Let the market confirm your bias.

USDCADwe see price trading inside a channel , and we have downtrend inside channel were expecting breakout and retest and long term BUY
possibility of uptrendConsidering the price behavior in the current resistance range, possible scenarios have been identified. With the resistance range broken and stabilized above, a continuation of the upward trend is likely.

usd cad cup and handleit seems the handle is broken and if you touch the body you may burn your hand, for archiving the matter im doing this idea feel free to comment and share your ideas

Beautiful Long USDCAD is getting ready next weekI love this pair once I will see a break and retest of the level I will place my order long.
In the moment it is on the POC level so it will be soon go long. I am looking for the engulfing pattern to sit on my level and I am going to teke the trade.

USDCAD Will Move Higher! Long!
Take a look at our analysis for USDCAD.
Time Frame: 2h
Current Trend: Bullish
Sentiment: Oversold (based on 7-period RSI)
Forecast: Bullish
The market is testing a major horizontal structure 1.368.
Taking into consideration the structure & trend analysis, I believe that the market will reach 1.373 level soon.
P.S
We determine oversold/overbought condition with RSI indicator.
When it drops below 30 - the market is considered to be oversold.
When it bounces above 70 - the market is considered to be overbought.
Disclosure: I am part of Trade Nation's Influencer program and receive a monthly fee for using their TradingView charts in my analysis.
Like and subscribe and comment my ideas if you enjoy them!
