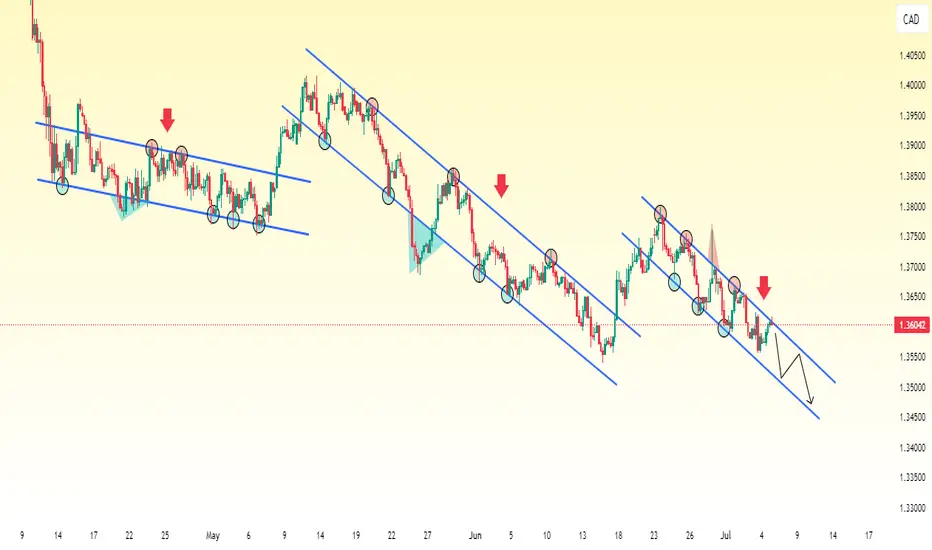
USD/CAD in a Strong Downtrend – Lower Channels Keep FormingUSD/CAD is currently in a strong bearish trend, forming a series of descending channels.
The price initially moved lower within a downward-sloping channel, then broke out to the upside, suggesting a reversal or deeper correction. However, this breakout was short-lived.
Instead of continuing higher, USD/CAD lost momentum and began forming a new descending channel, resuming its bearish movement. This pattern has repeated, each time the price breaks out upward, it quickly shifts back into a new downward channel, making lower lows each time.
This behavior indicates a bearish continuation structure, where temporary upward moves are corrective in nature and serve as setups for the next leg down. The consistent formation of new lower channels after brief pullbacks reflects ongoing selling pressure and trader sentiment favoring the downside.
CADUSD trade ideas
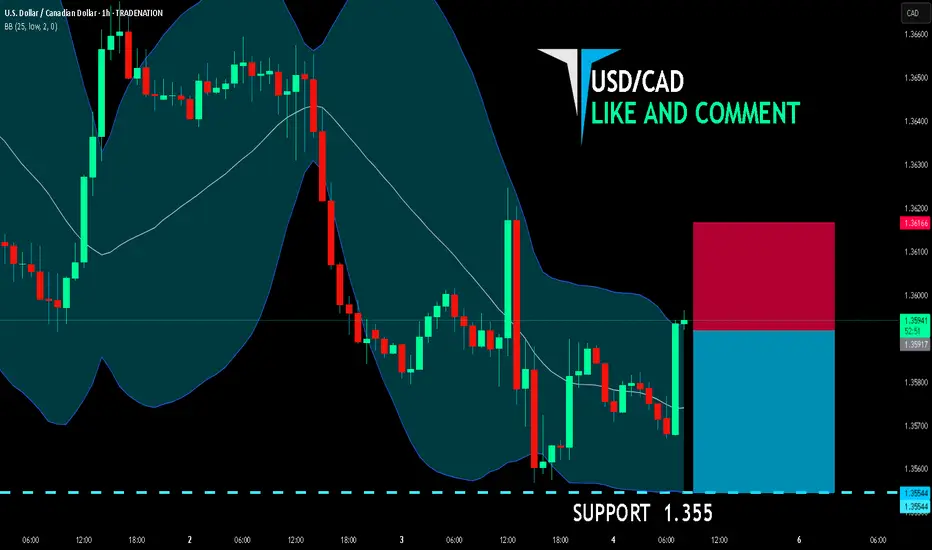
USD-CAD Local Rebound! Buy!
Hello,Traders!
USD-CAD is trading in a
Strong downtrend but
The pair made a retest
Of the horizontal support
Level of 1.3540 from where
We are already seeing a
Bullish rebound and we
Will be expecting a
Further move up
Buy!
Comment and subscribe to help us grow!
Check out other forecasts below too!
Disclosure: I am part of Trade Nation's Influencer program and receive a monthly fee for using their TradingView charts in my analysis.

USDCAD 15/3 Pullback LongOverall up trend. When the pull back reach congestion, will take off. Still need to monitor the CAD news later.

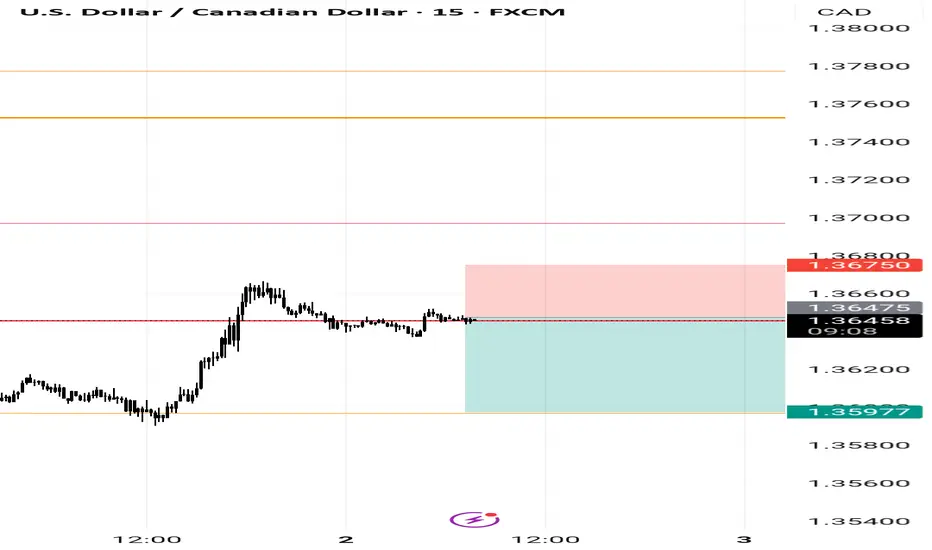
USDCAD: Long Signal with Entry/SL/TP
USDCAD
- Classic bullish formation
- Our team expects growth
SUGGESTED TRADE:
Swing Trade
Buy USDCAD
Entry Level - 1.3605
Sl - 1.3575
Tp - 1.3668
Our Risk - 1%
Start protection of your profits from lower levels
Disclosure: I am part of Trade Nation's Influencer program and receive a monthly fee for using their TradingView charts in my analysis.
❤️ Please, support our work with like & comment! ❤️

3 PM Market Update _ USDCADWhat happened was that the market reversed into a buy sentiment which i was able to take advantage of by using my strategy!!

USD/CADIt is very amazing chart 1h frame
Entry point 1.3600
stop loss below 1.39450 (93.4 point)
T1 1.39232 (325 Point)
T2 1.40417 (443 Point)
T3 141600 (558 Point)

USD/CAD💰Symbol: { USD/CAD }
🟩Price: { 1.35785 }
🟥Stop: { 1.35534 }
1️⃣profit: { 1.36017 }
2️⃣profit: { 1.36286 }
3️⃣profit: { 1.36588 }
📊Check your chart before entering.
🚨Check before use to make sure there is no important news.🚨

usdcad longs Since dxy is showing some bullish momentum and was expecting a strong dollar if we close bullish on this 30 min candle we can go long ..quick newyork trades

Usdcad Usdcad as we can see is on a uptrend we hv 1d 1w on a uptrend and we are expecting a break and a retest on the 4hrs den we buy but this trade is a high probability trade
Trade Idea For USDCADDon't forget to follow!!
Eurusd on our medium timeframe is CT to the higher timeframe so at this stage we only targeting a fixed 1:5RR.

USD/CAD SHORT FROM RESISTANCE
USD/CAD SIGNAL
Trade Direction: short
Entry Level: 1.359
Target Level: 1.355
Stop Loss: 1.361
RISK PROFILE
Risk level: medium
Suggested risk: 1%
Timeframe: 1h
Disclosure: I am part of Trade Nation's Influencer program and receive a monthly fee for using their TradingView charts in my analysis.
✅LIKE AND COMMENT MY IDEAS✅
USDCAD LONG DAILY FORECAST Q3 D4 W27 Y25USDCAD LONG DAILY FORECAST Q3 D4 W27 Y25
Professional Risk Managers👋
Welcome back to another FRGNT chart update📈
Diving into some Forex setups using predominantly higher time frame order blocks alongside confirmation breaks of structure.
Let’s see what price action is telling us today! 👀
💡Here are some trade confluences📝
✅Daily Order block identified
✅4H Order Block identified
✅1H Order Block identified
🔑 Remember, to participate in trading comes always with a degree of risk, therefore as professional risk managers it remains vital that we stick to our risk management plan as well as our trading strategies.
📈The rest, we leave to the balance of probabilities.
💡Fail to plan. Plan to fail.
🏆It has always been that simple.
❤️Good luck with your trading journey, I shall see you at the very top.
🎯Trade consistent, FRGNT X

USDCAD offers good R:R opportunityAs the price corrected, its forming a falling wedges pattern. And the best thing is all the new lower low was appear alongside the higher low on MACD, it's such a strong BULLISH DIVERGENCE signal.
I believe in the next 2-3 trading days, 100-150 pips upward movement is very likely to happen.

Bearish drop?The Loonie (USD/CAD) is rising towards the pivot and could drop to the 1st support that aligns with the 161.8% Fibonacci extension.
Pivot: 1.3580
1st Support: 1.3540
1st Resistance: 1.3601
Risk Warning:
Trading Forex and CFDs carries a high level of risk to your capital and you should only trade with money you can afford to lose. Trading Forex and CFDs may not be suitable for all investors, so please ensure that you fully understand the risks involved and seek independent advice if necessary.
Disclaimer:
The above opinions given constitute general market commentary, and do not constitute the opinion or advice of IC Markets or any form of personal or investment advice.
Any opinions, news, research, analyses, prices, other information, or links to third-party sites contained on this website are provided on an "as-is" basis, are intended only to be informative, is not an advice nor a recommendation, nor research, or a record of our trading prices, or an offer of, or solicitation for a transaction in any financial instrument and thus should not be treated as such. The information provided does not involve any specific investment objectives, financial situation and needs of any specific person who may receive it. Please be aware, that past performance is not a reliable indicator of future performance and/or results. Past Performance or Forward-looking scenarios based upon the reasonable beliefs of the third-party provider are not a guarantee of future performance. Actual results may differ materially from those anticipated in forward-looking or past performance statements. IC Markets makes no representation or warranty and assumes no liability as to the accuracy or completeness of the information provided, nor any loss arising from any investment based on a recommendation, forecast or any information supplied by any third-party.

Falling towards pullback support?USD/CAD us falling towards the support level which is a pullback support that lines up with the 138.2% Fibonacci extension and the 78.6% Fibonacci projection and could bounce from this level to our take profit.
Entry: 1.3549
Why we like it:
There is a pullback support level that lines up with the 138.2% Fibonacci extension and the 78.6% Fibonacci projection.
Stop loss: 1.3499
Why we like it:
There is a support level at the 100% Fibonacci projection.
Take profit: 1.3690
Why we like it:
There is a pullback resistance level.
Enjoying your TradingView experience? Review us!
Please be advised that the information presented on TradingView is provided to Vantage (‘Vantage Global Limited’, ‘we’) by a third-party provider (‘Everest Fortune Group’). Please be reminded that you are solely responsible for the trading decisions on your account. There is a very high degree of risk involved in trading. Any information and/or content is intended entirely for research, educational and informational purposes only and does not constitute investment or consultation advice or investment strategy. The information is not tailored to the investment needs of any specific person and therefore does not involve a consideration of any of the investment objectives, financial situation or needs of any viewer that may receive it. Kindly also note that past performance is not a reliable indicator of future results. Actual results may differ materially from those anticipated in forward-looking or past performance statements. We assume no liability as to the accuracy or completeness of any of the information and/or content provided herein and the Company cannot be held responsible for any omission, mistake nor for any loss or damage including without limitation to any loss of profit which may arise from reliance on any information supplied by Everest Fortune Group.

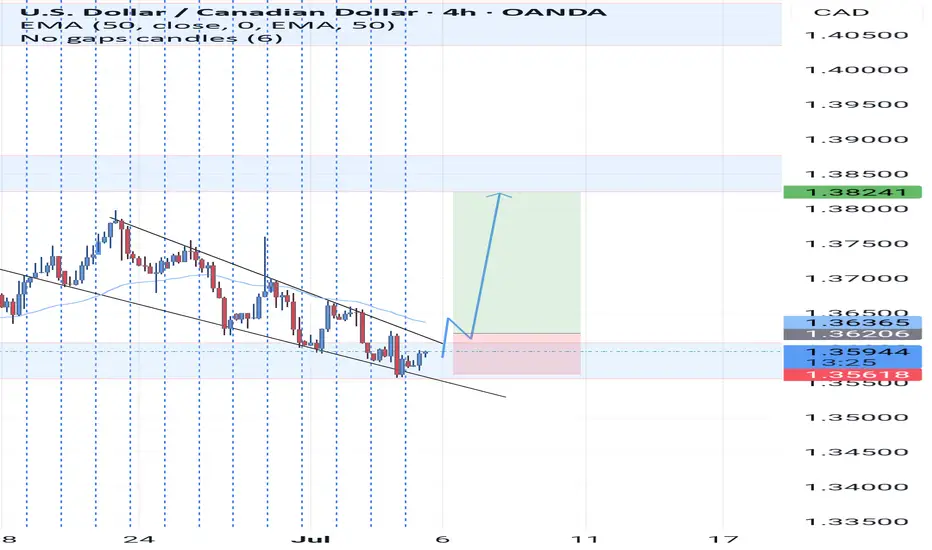
Two Wedges on USD/CAD: Waiting for the FRL ConfirmationWe have two descending wedges on USD/CAD across different timeframes:
H1: Clean falling wedge structure since March, price near the lower boundary.
H4: Same wedge structure, aligning with the larger phase.
FRL Entry Confirmation:
Following the Fractal Reversal Law (FRL), we do not enter immediately.
We wait for:
✅ A full candle close above the neckline of the local double bottom,
✅ Where the neckline on H1 aligns precisely with the 100 SMA.
This confirms phase reversal and removes noise, making the entry safe.
🎯 Targets:
1️⃣ 1.36676 – First take profit, retesting the neckline break.
2️⃣ 1.37914 – Mid-term target, wedge mid-level.
3️⃣ 1.38561 – 1.40155 – Full wedge top, long-term objective.
Why This Matters:
✅ Positive US unemployment data supports USD strength.
✅ The wedge is 3+ months wide, adding reliability to the breakout.
✅ Alignment with 100 SMA increases the accuracy of FRL signals.
✅ The trade offers a clear Risk/Reward above 1:2.5.
Trading is capital management under uncertainty.
The red horizontal zone is uncertainty; the neckline is the Rubicon where the market becomes clear. Don’t fear uncertainty. Wait for clarity.

Bullilsh bounce?The Loonie (USD/CAD) has bounced off the pivot and could rise to the 1st resistance which is also a pullback resistance that lines up with the 61.8% Fibonacci retracement.
Pivot: 1.3576
1st Support: 1.3540
1st Resistance: 1.3629
Risk Warning:
Trading Forex and CFDs carries a high level of risk to your capital and you should only trade with money you can afford to lose. Trading Forex and CFDs may not be suitable for all investors, so please ensure that you fully understand the risks involved and seek independent advice if necessary.
Disclaimer:
The above opinions given constitute general market commentary, and do not constitute the opinion or advice of IC Markets or any form of personal or investment advice.
Any opinions, news, research, analyses, prices, other information, or links to third-party sites contained on this website are provided on an "as-is" basis, are intended only to be informative, is not an advice nor a recommendation, nor research, or a record of our trading prices, or an offer of, or solicitation for a transaction in any financial instrument and thus should not be treated as such. The information provided does not involve any specific investment objectives, financial situation and needs of any specific person who may receive it. Please be aware, that past performance is not a reliable indicator of future performance and/or results. Past Performance or Forward-looking scenarios based upon the reasonable beliefs of the third-party provider are not a guarantee of future performance. Actual results may differ materially from those anticipated in forward-looking or past performance statements. IC Markets makes no representation or warranty and assumes no liability as to the accuracy or completeness of the information provided, nor any loss arising from any investment based on a recommendation, forecast or any information supplied by any third-party.

sell from pivotgood RR
on Daily chart I saw down trend
so I was looking for sell
price now is retsting the pivot
that was resistance, broke down and now may be support for continuing the down trend
Unlocking the Bull Vault: USD/CAD Heist Setup🕵️♂️💼 The Loonie Vault Raid: USD/CAD Buy Blueprint 💰🔐
🌟Hi! Hola! Ola! Bonjour! Hallo! Marhaba!🌟
To All Currency Conquerors, Market Raiders & Profit Seekers 💸🚁🕶️
Welcome to another Thief Trading Style playbook, crafted for bold traders ready to infiltrate the Forex vaults with precision.
📜 Mission Brief – The Loonie USD/CAD Buy Op:
Using a blend of 🔥strategic market intel🔥 (technical + fundamental), we’re gearing up for a targeted buy operation. The goal? Extract max profits and vanish before the guards show up. 🏃♂️💨
🎯 ENTRY POINT – Authorized Access Only!
🎯 Buy Zone #1: Around 1.37000+
🎯 Buy Zone #2: Around 1.36400 (Caution: This is Market Maker Trap turf – approach wisely)
⏳ Wait for pullback signs & reversal confirmation before execution – The real pros enter when the crowd hesitates.
🛑 STOP LOSS – Backup Plan if Things Go South
🧠 Wise raiders always have an exit route!
🔹 SL Strategy 1: Nearest Swing Low on 2H timeframe (e.g., 1.36000)
🔹 SL Strategy 2: Institutional Buy Zone SL (1.34000 or deeper)
💡 Position sizing and risk tolerance are your call, but don’t skip this shield.
🏴☠️ TARGET – Where the Loot Lies
🎯 Aim for 1.39500 or exit early if the heat rises (volatility spike/consolidation stalls)
💼 Remember, the best thieves know when to grab the bag and bounce.
💹 Scalpers Advisory – Shortcuts to Riches
👀 Only ride the bullish tide.
💰 If you’ve got capital muscle, dive in. If not, roll with the swing crew.
📌 Trail that SL like a pro – don’t get caught slippin’.
📊 Why We Strike Now – The Big Picture
USD/CAD is showing bullish signs backed by:
✔️ Macro shifts
✔️ COT reports
✔️ Sentiment shift
✔️ Intermarket synergy
✔️ Smart money positioning
🔗 Full intel available – KlicK & explore!
⚠️ High Alert: News & Chaos Protocol
🚨 News drops = alarm bells.
To survive:
📌 Avoid fresh trades during major releases
📌 Use trailing SL to protect your gains
📌 Don’t overexpose – one vault at a time
💖 Support the Crew – Hit BOOST
Your boost helps fund the next mission. Show love, share strength, and become part of the Forex Heist Syndicate 🕵️♂️💵💼
One chart at a time, we rewrite the game.
🎯 Stay locked in – next mission drops soon... 🤑💻🚀

USDCAD LONG CHART PATTERN USDCAD (Canadian Dollar)
Trend: Bearish after breakout from an ascending channel
Resistance Level: 1.38500
Support Level / Target: 1.36000
Idea: Price has hit resistance → expect reversal → target is 1.36000

Possibility of uptrend The triangle pattern is expected to complete at the current support level according to the indicated directions. Then, a trend change is likely to occur and the start of an uptrend is likely. A break of the red support level will likely indicate a continuation of the downtrend.

Bullish bounce?USD/CAD is falling towards the support level which is a pullback support that aligns with the 138.2% Fibonacci extension and could bounce from this level to our take profit.
Entry: 1.3553
Why we like it:
There is a pullback support level that lines up with the 138.2% Fibonacci extension.
Stop loss: 1.3510
Why we like it:
There is a support level at the 78.6% Fibonacci projection.
Take profit: 1.3661
Why we like it:
There is a pullback resistance level.
Enjoying your TradingView experience? Review us!
Please be advised that the information presented on TradingView is provided to Vantage (‘Vantage Global Limited’, ‘we’) by a third-party provider (‘Everest Fortune Group’). Please be reminded that you are solely responsible for the trading decisions on your account. There is a very high degree of risk involved in trading. Any information and/or content is intended entirely for research, educational and informational purposes only and does not constitute investment or consultation advice or investment strategy. The information is not tailored to the investment needs of any specific person and therefore does not involve a consideration of any of the investment objectives, financial situation or needs of any viewer that may receive it. Kindly also note that past performance is not a reliable indicator of future results. Actual results may differ materially from those anticipated in forward-looking or past performance statements. We assume no liability as to the accuracy or completeness of any of the information and/or content provided herein and the Company cannot be held responsible for any omission, mistake nor for any loss or damage including without limitation to any loss of profit which may arise from reliance on any information supplied by Everest Fortune Group.

USDCAD bearish consolidation resistance at 1.3700The USDCAD currency pair remains in a bearish technical structure, consistent with the prevailing downtrend. Recent price action suggests sideways consolidation, indicating indecision as the pair pauses before its next directional move.
Key Technical Levels:
Resistance:
1.3700 – Key pivot zone; previously acted as intraday resistance.
1.3740 – Minor resistance.
1.3790 – Stronger resistance zone and potential reversal point.
Support:
1.3566 – Initial downside target on renewed selling pressure.
1.3544 – Intermediate support.
1.3520 – Long-term support and potential demand zone.
Scenario Analysis:
Bearish Case (Favored):
Price is consolidating below the key 1.3700 level. A failure to break above this resistance could trigger a renewed move lower. A bearish rejection from this level may open the path toward 1.3566, then 1.3544 and 1.3520 over a longer timeframe.
Bullish Case (Alternative):
A confirmed breakout and daily close above 1.3700 would invalidate the current bearish setup. This could shift sentiment to bullish and trigger a move toward the next resistance zones at 1.3740 and 1.3790.
Conclusion:
The technical bias for USDCAD remains bearish while price trades below the 1.3700 resistance zone. Traders should watch for a rejection from this level to confirm further downside potential. However, a sustained break above 1.3700 would neutralize the bearish setup and suggest scope for a short-term bullish reversal.
This communication is for informational purposes only and should not be viewed as any form of recommendation as to a particular course of action or as investment advice. It is not intended as an offer or solicitation for the purchase or sale of any financial instrument or as an official confirmation of any transaction. Opinions, estimates and assumptions expressed herein are made as of the date of this communication and are subject to change without notice. This communication has been prepared based upon information, including market prices, data and other information, believed to be reliable; however, Trade Nation does not warrant its completeness or accuracy. All market prices and market data contained in or attached to this communication are indicative and subject to change without notice.
