Pancakeswap Long term analysisThe piece of cake is ready to be eaten. Do not let it go!
Cake should be involve with trend line for some time.
PLEASE #DYOR
CAKEPERP trade ideas

CAKE UpdateCake is right now consolidating in this channel a clear break out would cause a 30% pump and more even.

cake bullish break above resistance 3rd time and holding- cake breaking resistance for 3rd time, showing significant bullish momentum
- this is also supported with on chain analysis-
- TVL at 79.31 %
- top 3 wallet holding cake liquidity providers currently at 23.27 mill cake, couple days ago at 24.76, so with increasing supply price going up shows demand is there and charts are pointing to this------ BULLISH!!!!
- make sure to stake directly on pancakeswap- this will reduce the chance of exchanges making commision and selling down! therefore we'll see much higher prices sooner!!

cake bullish move on daily green candle- target ATHgreen candlestick change on daily heikin ashi
- hopefully breaks resistance and targets ATH

CAKE Long IdeaSo as you know CAKE is the native token of Pancake Swap. Pancake Swap is home to a ton of the shitcoins, CATGIRL and all that type of stuff. I don't put any money into shitcoins apart from a few swings on SHIB a few days back. As shitcoins continue to grow, which I believe they will as the average retail investor gets drawn in by stuff like DOGE or SHIB and the 10000x potential if you essentially buy a $300 lottery ticket. As they grow I think it's very reasonable for CAKE to increase in value, especially as it was at like +$8 from here in September.
As far as TA goes I'm mainly looking to open a position for what is on the chart. There is a fib overlaid from the start of it's rise in July to its high in September. The orange box is also a historical S/R level which you can clearly see looking through the chart. The fib levels and this level are respected heavily. There is also a valid downward trendline acting as support. IMO this looks prime for a breakout soon.
The SL and TP levels are fairly easy to explain as well. The SL is very wide to account for large wicks, and is just below the orange box. The TP levels are simply the fib levels, but SL is moved up to the previous one after a new one is flipped.
The blue line is my ideal scenario. A drop to the orange box, and from there a bounce and breakthrough the resistance to the .382 fib level. Then from there a pullback to a retest at the .5 fib level and the past resistance trendline. Following this I'd hope for a steady rise through the .236 fib level for a quick retest and then it would proceed upward to ATH. Again, this is MY IDEAL scenario, there are still external factors such as BTC and ETH which could completely change the plan, but with how things are currently I think this blue line is 100% plausible.


Cake king termThis year cake will grow up a lot
Still good to be bought it can go up to 30$ until beginning of December

Cake price predictions- Bullish up to $100 in short to mid term- hitting long term support levels
- Total value locked seems to be rising- showing signs of reduced supply, currently 80%
- Hopefully expect price to reach ATH soon and maybe testing the $100 level short to mid term. Long term potential to $1000 but seems a bit far fetched considering market cap.
- On BSC Scan can see likely 20% remaining liquidity moslty all in exchanges, when this dries up further hopefully we'll see some nice price action to upside.
- currently great time to buy in around $18 to 20, and stake this on pancakeswap, and provide more upward thrust, NOT staking on the exchanges where they will take commission and reduce price potential as this commision will be added to selling pressure.
- TIP if you buy on the exchange, the exchange may try to block transfers off by saying issues with BSC, but essentially they don't want it going off their exchange, just be patient and remove it off the exchange, or transfer BUSD off exchange and buy directly on pancakeswap where you won't get these issues.

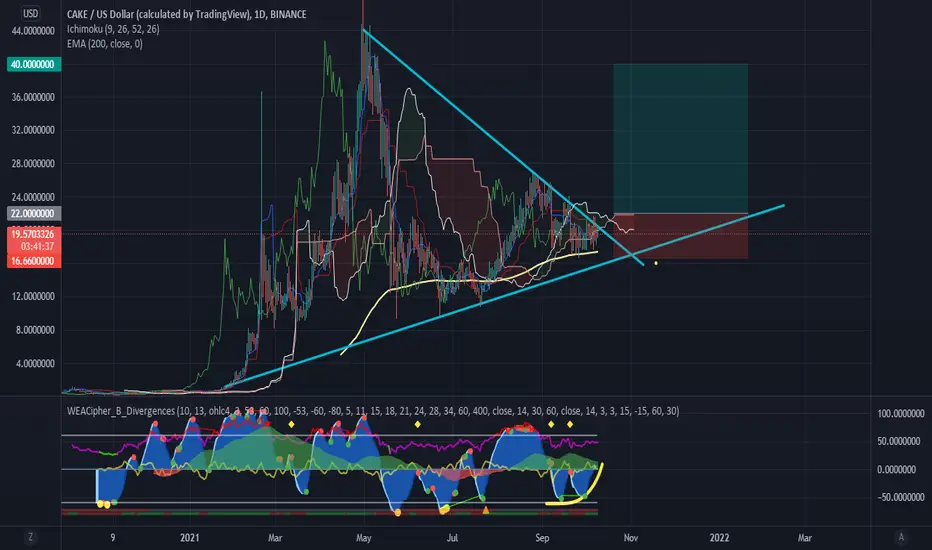
Cake could break up the triangleBuying #CAKE if price >= 22 on 4H because:
-near broking up (or down) a triangle
-on 4h: on MarketDecipher: anchor & trigger wave getting smaller & smaller (see yellow line)
-RSI going up since mid september
-on daily MACD bullish crossover daily since beginning of october
-above 200 EMA D &lower bull trendline acting as support so far.
Still below 200 EMA 4H
Order type:
BUY STOP: 22
TP: 40
Stop loss: 16.66
Risk to reward ratio: 3.37
Capital risk recommended: 1 or 2%
To avoid false break out, make sure price is >=22 on 4H time frame. if it goes up, wait for pull back, dont fomo.
As always, there will me more opportunities than you could ever handle.
If you are more willing to take a agressive trade, agressive you can buy even now.
We will update
Who is in ?
Cake set up This is cake. Amazing Chart and binance ecosystem also has a billion in funding. Send it

Cake with lots of C.R.E.A.MWe finally broke the strawberry line. It has been our resistance since May 1st. What a time to be dessert lover.

PancakeSwap (CAKE) - October 12Hello?
Welcome, traders.
By "following", you can always get new information quickly.
Please also click "Like".
Have a nice day.
-------------------------------------
(CAKEUSD 1W Chart) - Mid-Long-Term Perspective
Above the 9.0760290 point: the uptrend expected to continue
15.1757179-16.1961041 or more: Expected to create a new wave.
(1D chart)
First resistance section: 19.0812658-20.0044522
Second resistance section: 29.5050311-32.1525450 (psychological resistance section)
First support section: 15.1757179-16.1961041
Second support section: 9.0760290-10.8786252
It is important to maintain the price above the first resistance section.
Therefore, it is necessary to check if the price can be maintained above the first support level.
If it falls from the first support zone, it may touch the second support zone, so trade cautiously.
-----------------------------------------------------
(CAKEBTC 1W Chart) - Mid- to long-term perspective
1652 Satoshi-2070 Satoshi or more: Expected to continue upward trend
2687 Satoshi-2903 Satoshi or higher: Expected to create a new wave.
(1D chart)
First support section: 2687 Satoshi-2903 Satoshi section
Second support section: near the 1652 Satoshi point
First resistance section: 4174 Satoshi-4837 Satoshi section
Second resistance section: 6578 Satoshi-7068 Satoshi section
------------------------------------------
We recommend that you trade with your average unit price.
This is because, if the price is below your average unit price, whether it is in an uptrend or in a downtrend, there is a high possibility that you will not be able to get a big profit due to the psychological burden.
The center of all trading starts with the average unit price at which you start trading.
If you ignore this, you may be trading in the wrong direction.
Therefore, it is important to find a way to lower the average unit price and adjust the proportion of the investment, ultimately allowing the funds corresponding to the profits to regenerate themselves.
------------------------------------------------------------ -----------------------------------------------------
** All indicators are lagging indicators.
Therefore, it is important to be aware that the indicator moves accordingly with the movement of price and volume.
However, for the sake of convenience, we are talking in reverse for the interpretation of the indicator.
** The MRHAB-O and MRHAB-B indicators used in the chart are indicators of our channel that have not yet been released.
(Because it is not public, you can use this chart without any restrictions by sharing this chart and copying and pasting the indicators.)
** The wRSI_SR indicator is an indicator created by adding settings and options to the existing Stochastic RSI indicator.
Therefore, the interpretation is the same as the traditional Stochastic RSI indicator. (K, D line -> R, S line)
** The OBV indicator was re-created by applying a formula to the DepthHouse Trading indicator, an indicator disclosed by oh92. (Thanks for this.)
** Support or resistance is based on the closing price of the 1D chart.
** All descriptions are for reference only and do not guarantee a profit or loss in investment.
(Short-term Stop Loss can be said to be a point where profit and loss can be preserved or additional entry through split trading. It is a short-term investment perspective.)

don't forget the Cake inflationmy last prediction was to stay out of the market when the cake was on 25 $ (you can see the idea in my profile)
as we saw the cake has already reached its 61,8% fibo , while the other alt coins haven't yet ,and that's because if its huge inflation that what make me just short term investor in cake , so i'm waiting until the bitcoin falls to the 37k zone i will enter the cake mid term trade , and i expect the price will drop to 14_15 area ,(that would be the real 61% fib on cake on the market cap)
in worst case scenario i will be missed out and waiting another chance to enter , better than staying in minus ..
you can support me just by following me , and leaving like on the idea ..
Share your opinion in the comments
to compare the cake price with its inflation on market cap just see cake chart on cmc

CAKEUSDT daily break and retestPrice has broken the support to the downside, expecting a retest at my point of entry, then continuation

CAKE longSobald wir hier einen Breakout sehen - Kerze schließt über resistance , dieser bestätigt wird (4h oder D?)

CAKE LongSobald wir hier einen Breakout sehen - Kerze schließt über resistance , dieser bestätigt wird (4h oder D?)

CAKE/USDT Ready for another 100% from here..?#CAKE/USDT TA update:-
$CAKE currently trading at $20.5
Bullish as per chart.
Buying above $18.5-$20.5
Targets:- $27/$43/ATH
Stop Loss:- If any daily candle closed below $18
Support:- $18/$11
Resistance:- $27/$43
#DYOR

PancakeSwap (CAKE) - September 12Hello?
Welcome, traders.
By "following", you can always get new information quickly.
Please also click "Like".
Have a nice day.
-------------------------------------
(CAKEUSD 1W Chart)
It remains to be seen if the price can be maintained above the 15.1757179-16.1961041 segment.
If it declines from the 9.0760290 point, there is a possibility of entering the mid- to long-term investment area, so careful trading is required.
If the price holds above the 20.0044522 point, it is expected to create a new wave.
(1D chart)
If the price holds above the 19.0812658 point, it is expected that the uptrend will continue.
However, the uptrend is expected to accelerate only when it rises above the 22.7629293 point and breaks out of the downtrend line.
If it falls from the 15.1757179-16.1961041 section, you can touch the 9.0760290-10.8786252 section, so you need to trade carefully.
-------------------------------------
(CAKEBTC 1W chart)
It remains to be seen if the price can sustain above the 0.0002687-0.0002903 interval.
If it falls in the range of 0.0001652-0.0002687, it is highly likely to enter the mid- to long-term investment area, so careful trading is required.
(1D chart)
We need to see if we can find support at the 0.0004174-0.0004445 zone and move above the 0.0005074 point to break out of the downtrend line.
If the price holds above the 0.0005074 point, I would expect resistance in the 0.0006578-0.0007068 range.
If it falls in the 0.0003450-0.0003850 section, it can touch the 0.0002903 point or less, so Stop Loss is required to preserve profit and loss.
However, you can touch the 0.0002304-0.0002903 section and rise, so you need to think about how to respond.
------------------------------------------
We recommend that you trade with your average unit price.
This is because, if the price is below your average unit price, whether it is in an uptrend or in a downtrend, there is a high possibility that you will not be able to get a big profit due to the psychological burden.
The center of all trading starts with the average unit price at which you start trading.
If you ignore this, you may be trading in the wrong direction.
Therefore, it is important to find a way to lower the average unit price and adjust the proportion of the investment, ultimately allowing the funds corresponding to the profits to regenerate themselves.
------------------------------------------------------------ -----------------------------------------------------
** All indicators are lagging indicators.
Therefore, it is important to be aware that the indicator moves accordingly with the movement of price and volume.
However, for the sake of convenience, we are talking in reverse for the interpretation of the indicator.
** The wRSI_SR indicator is an indicator created by adding settings and options to the existing Stochastic RSI indicator.
Therefore, the interpretation is the same as the traditional Stochastic RSI indicator. (K, D line -> R, S line)
** The OBV indicator was re-created by applying a formula to the DepthHouse Trading indicator, an indicator disclosed by oh92. (Thanks for this.)
** See support, resistance, and abbreviation points.
** Support or resistance is based on the closing price of the 1D chart.
** All descriptions are for reference only and do not guarantee a profit or loss in investment.
Explanation of abbreviations displayed in the chart
R: A point or section of resistance that requires a response to preserve profits.
S-L: Stop Loss point or section
S: A point or section where you can buy to make a profit as a support point or section.
(Short-term Stop Loss can be said to be a point where profit and loss can be preserved or additional entry can be made through split trading. It is a short-term investment perspective.)
GAP refers to the difference in prices that occurred when the stock market, CME, and BAKKT exchanges were closed because they are not traded 24 hours a day.
G1 : Closing price when closed
G2: Opening price
(Example) Gap (G1-G2)

What happens when $CAKEUSD NFTs are adopted? I think we eventually rocket when public catches on to defi.

i think open ocean arriving to 40$1-not yet listed in big exchange
2-good idea for combination defi and cefi
3- big investor for example okex
4-good team from big company for example intel
5-socill media is very strong

CAKEUSD daily ewc log scaleW5 has reach Target, price still in channel, I think wave 5 will end soon price look choppy

CAKE - looking for longs Here is cake on the 1h timeframe, the reason for us being interested in this coin is that we have a daily uptrend which we have identified, it also looks like now we are about to see exhaustion to that trend and also a 4h level of buy pressure that will send price to the upside. For this trade to be valid we need to see full and complete exhaustion to this level and the uptrend then wait for entry confirmation which will be a significant pin bar on the 1h or a bullish engulfing candle signalling buyers are coming back in.

PancakeSwab/Usd looks bullish but vulnerable to correction PancakeSwab/Usd looks bullish but vulnerable to correction.....................................................................
